Adsorption of Phenol and Methylene Blue in Solution by Oil Palm Shell Activated Carbon Prepared by Chemical Activation
Buhani1 , Megafhit Puspitarini1, Rahmawaty1, Suharso1, Mita Rilyanti1, and Sumadi2
1Department of Chemistry, Faculty of Mathematic and Natural Sciences, University of Lampung, Jl. Soemantri Brodjonegoro No. 1 Bandar Lampung, 35145, Indonesia.
2Department of Electrical Engineering, Faculty of Engineering, University of Lampung, Jl. Soemantri Brodjonegoro No. 1 Bandar Lampung, Indonesia.
Corresponding Author E-mail: buhani_s@yahoo.co.id
DOI : http://dx.doi.org/10.13005/ojc/3404043
Article Received on : 02-05-2018
Article Accepted on : 07-07-2018
Article Published : 08 Aug 2018
In this research, it has been performed carbon activation of oil palm shells (CAC) prepared by chemical treatment as adsorbents of phenol and methylene blue (MB) in solution either in the form of single or in pair solution. The activation of carbon from the oil palm shells was done physically at a temperature of 700°C for 1 hour continued with chemical activation using 10% H3PO4 for 24 hours. Identification of functional groups on the carbon from oil palm shell before and after chemically activated was performed using infrared spectrophotometer (IR) and analysis of its surface morphology was carried out using scanning electron microscope (SEM). The phenol and MB adsorption process was performed in single and binary systems using the batch method. The adsorption of phenol on CAC is optimum at pH 8 while MB at pH 11 with optimum contact time of 90 min for phenol and 120 min for MB respectively. The phenol and MB adsorption data on the CAC in the single system follow the pseudo-second-order kinetics model with the adsorption rate constant of 0.399 and 0.769 g mmol-1 min-1 respectively. The adsorption isotherms of phenol and MB in CAC tend to follow Freundlich adsorption isotherm pattern with the adsorption intensity factor (n) for phenol, MB, phenol/MB, and MB/phenol: 1.739, 1.341, 1.334, and 1.293 respectively. The adsorbent of CAC is effective to remove phenol and MB in solution, either in single or paired condition.
KEYWORDS:Adsorption; Activated Carbon; Phenol; Methylene Blue
Download this article as:| Copy the following to cite this article: Buhani B, Puspitarini M, Rahmawaty R, Suharso S, Rilyanti M, Sumadi S. Adsorption of Phenol and Methylene Blue in Solution by Oil Palm Shell Activated Carbon Prepared by Chemical Activation. Orient J Chem 2018;34(4). |
| Copy the following to cite this URL: Buhani B, Puspitarini M, Rahmawaty R, Suharso S, Rilyanti M, Sumadi S. Adsorption of Phenol and Methylene Blue in Solution by Oil Palm Shell Activated Carbon Prepared by Chemical Activation. Orient J Chem 2018;34(4). Available from: http://www.orientjchem.org/?p=48171 |
Introduction
The industrial development and the use of synthetic inorganic and organic compounds for various purposes have a negative impact that is contamination of surface water resources and ground water resources.1 Organic pollutants that are biodegradable and non-biodegradable compounds have toxic properties. Pollutants of organic compounds from industrial waste are often encountered such as phenol (C6H5OH) compounds and dyes as MB (methylene blue/C16H18ClN3S).2,3
Separation of hazardous wastes derived from organic compounds is a common problem that is often faced currently. Several conventional methods have been done to overcome the problem of dye waste, such as oxidation,4 coagulation and floculation5, adsorption,6,7 and ion exchange.8 Among these methods, adsorption is one effective technique for separating organic compounds from waste. The adsorption method has advantages of other methods because the process is simpler, the cost is relatively cheap, environmentally friendly, and the absence of side effects of toxic substances.9-11 The adsorption process is one of the waste treatment techniques that is expected to be used to decrease the concentration of excessive organic compounds. One of the most frequently used adsorbents in the adsorption process is activated carbon. The activated carbon is selected because it has a large surface, large adsorption capability, easy to apply, and the cost is relatively cheap.12,13 The use of the activated carbon as adsorbent is done by considering the policy of applying zero waste concept that is utilizing industrial agro waste to reduce other industrial waste such as toxic chemicals.14-16 One source of agro-industrial waste that can be processed into the activated carbon is waste from oil palm shells. The palm oil shell is a material that can be raised its value added, that is made with carbon. However, along with the increasing amount and type of waste contained in the environment, it is also necessary to increase the quality of the activated carbon so that it has a more specific character to be more effective as an adsorbent.
The activation process is an important factor that contributes to the production of activated carbon. The activation process is a treatment of carbon which aims to enlarge the surface pores by breaking the hydrocarbon bonds or oxidizing the surface molecules. So the carbon changes in properties, both physics and chemistry, with a large surface area and affect the ability of adsorption.17 One of the ways to activate carbon is chemical activation. The chemical activation is a carbon activation by using chemicals as an activating agent such as ZnCl2, NaOH, and H3PO4 which aim to open a carbon surface covered by a tar deposit to create an expansion of the pores.18-21
In this research, it has been done the utilization of oil palm shells which is one of the agro-industry waste as the basic material of carbon. The activation was carried out chemically and the activated carbon obtained was used as a phenol and MB adsorbent in solution both in the single and paired solution form. The study of adsorption in the form of a paired solution between phenol and MB solution was carried out by considering that liquid industrial waste often contains chemicals that are multi-component mixtures.
Material and Methdods
Material and Equipment
The materials used in this research are carbon from palm shell waste, phenol, methylene blue (MB), H3PO4, distilled water, HCl-KCl buffer, citrate buffer, phosphate buffer, and universal buffer.
Identification of functional groups was performed using IR spectrophotometer (IR Prestige-21 Shimadzu) and investigation of surface morphology was carried out with SEM (Zeiss MA10). Concentration of phenol and MB were analyzed by using Agilent Cary 100 UV-Vis spectrophotometer.
Preparation of Chemical Activated Carbon (CAC)
Carbon from oil palm shells derived from industrial waste of crude palm oil (CPO) was activated by physical-chemical way through the burning process of oil palm shell in furnace at 700°C for 1 hour. Then it was continued by immersing 45 g of activated carbon of physics activation result into 70 mL of 10% H3PO4 solution for 24 hour followed by filtering and washing with distilled water up to neutral pH. Drying was done in an oven at 100°C for 1 hour and the cooling was carried out in the desiccator to room temperature. Activated carbon is crushed to a size of 100 mesh. Carbon from coconut shell before and after chemical activation process was analyzed by IR spectrophotometer (IR Prestige-21 Shimadzu) for functional group identification and SEM (Zeiss MA10) for surface morphology analysis.
Batch adsorption experiments
The adsorption process was carried out to determine the effect of pH interaction, effect of time, and adsorption isotherm. The effect of adsorption pH was studied by interacting 50 mg of active carbon in a series of test tubes and added with 100 mg L-1 of each phenol and MB solution at pH 2-12. The effect of contact time was carried out by reacting 50 mg of adsorbent in a series of test tubes and added with 100 mg L-1 of each phenol and MB solution at optimum pH with interaction time varies from 0 – 120 minutes.
Phenol and MB adsorption isotherms were studied by interacting 50 mg of adsorbent into a series of reaction tubes, then added with each phenol and MB solution with concentrations varying from 0 to 250 mg L-1. The adsorption was carried out in a batch system using magnetic stirrer at optimum of pH and time with temperature 27oC, then the solution was centrifuged, the filtrate was taken for analysis of the remaining phenol concentration in solution with Agilent Cary 100 UV-Vis spectrophotometer at wavelength of 270 nm and for MB at wavelength of 664 nm.
Percentages of phenol and MB adsorbed per unit of adsorbent mass were calculated using Eq. 1 as follows:
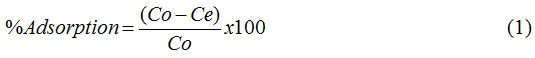
Where Co and Ce (mg L-1) are the concentrations of adsorbate before and after the adsorption process.
Results and Discussion
Synthesis and Characterization
The identification of functional groups on carbon from oil palm shells before and after chemically activated was interpreted using an IR spectrophotometer. Fig. 1 shows the two carbon materials having relatively similar absorption bands in the wavelength region 3397.93 (Fig.1a) and 3405.42 cm-1 (Fig.1b) derived from the hydroxyl group (O-H)2. Then there was a shift in absorbing bands at the wave number 1633.33 (Fig.1a) to 1624.33 cm-1 on CAC (Fig.1b) derived from the bending vibration of the alkene (C = C) of the aromatic ring.21,22 The absorption band shift also occurs at wave numbers 1104.21 (Fig.1a) and 1079.22 cm-1 (Fig.1b) from stretch vibration of the C-O-C in the aromatic ring.23 In addition, the absence of absorbing bands in the wavelength region of 1383.28 cm-1 in CAC is due to the reduced C-H group caused by the carbonization process, the activation with high temperature, and the addition of H3PO4.22
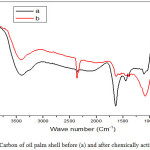 |
Figure 1: Carbon of oil palm shell before (a) and after chemically activated (b). |
The CAC surface morphology was analyzed with SEM and compared with the chemically unactivated carbon (Fig. 2). In Fig. 2 it can be observed that the CAC has more pore amount compared to the unactivated carbon. The carbon obtained is amorphous after it is chemically activated with H3PO4 and produces more pores with a larger carbon surface area of CAC.
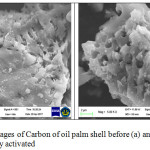 |
Figure 2: SEM images of Carbon of oil palm shell before (a) and after (b) chemically activated. |
Influence of pH
The effect of the pH of the solution is one of the important factors contributing to the amount of phenol and MB adsorbed on the CAC adsorbent. The effect of pH on the percentage of phenol and MB adsorbed on CAC was studied in the pH range of 2-14 (Fig. 3).
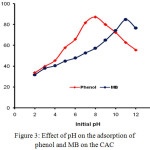 |
Figure 3: Effect of pH on the adsorption of phenol and MB on the CAC. |
In Fig. 3 it can be observed that the phenol adsorption on CAC is optimum at pH 8 while on MB is at pH 11. At low pH, most of the phenol and MB are in a protonated state and the CAC surface tends to be partially positive charge.24 This fact results in the occurrence of electrostatic repulsion so that the adsorption is weak. An increase in pH value causes an increase in the amount of phenol and MB adsorbed. An increase in pH of up to 8 causes the form of a phenol molecule into an anion phenolate thus causing an increase in phenol adsorption by the CAC which is still a positive partially charged. Then at a higher pH increase (pH > 8), there is a contribution of excessive OH– freeions which compete with the phenolic anion to interact with the surface of the activated carbon causing a decrease in phenol adsorption.25 Further on the MB, the increase in pH of the solution to 11 increases the amount of MB adsorbed, since in this condition the adsorbent surface has been negatively charged causing the electrostatic interaction between the organic cationic MB and the adsorbent CAC.26
Influence of contact time
The adsorption of phenol and MB on the CAC was studied at the contact time range of 0-120 min (Fig.4). In Fig. 4, it can be observed that the amount of phenol and MB adsorbed by CAC showed an increase in adsorption at a fairly rapid time from the first 15 min until it reached an optimum time of 90 min for phenol and 120 min for MB. A relatively short contact time can cause the adsorption process to be not optimal, this is because the adsorption rate is determined by the diffusion rate of the adsorbate species on the adsorbent solid. The longer the adsorption contact time then the collision frequency between the adsorbate and absorbent particles is greater27 so that it can cause the larger amount of phenol and MB adsorbed on the CAC.
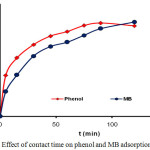 |
Figure 4: Effect of contact time on phenol and MB adsorption by CAC. |
Data on Fig. 4 were analyzed using the pseudo first order (Eq. 2) and pseudo- second-order kinetics models (Eq.3).28
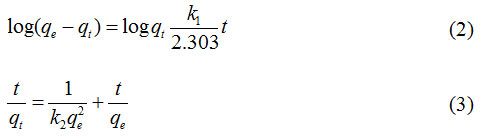
where qt and qe (mmol g-1) are phenol or MB adsorbed at time t, k1 and k2 are respectively a reaction rate constant of the pseudo-first-order and second-order at equilibrium. From the data analysis using the two kinetic models shows that the phenol and MB kinetic adsorption models in CAC tend to follow the pseudo- second-order kinetics model with R2 values of 0.998 and 0.965, respectively (Table 1).
Table 1: Pseudo-first-order and pseudo-second-order rate constant for the adsorption of phenol and MB on CAC at temperature 27oC.
| Adsorbate | qe exp (mmol g-1) | Pseudo-first-order | Pseudo-second-order | ||
| k1 (min-1) | R2 | k2 (g mmol-1 min-1) | R2 | ||
| Phenol | 0.342 | 0.044 | 0.510 | 0.399 | 0.998 |
| MB | 0.105 | 0.086 | 0.728 | 0.769 | 0.965 |
Influence of Initial Concentration
The effect of initial concentration of phenol and MB interacted with CAC adsorbent in either single or paired solutions form is shown in Fig. 5. From Fig. 5 it can be observed that in general the amount of phenol adsorbed is greater than that of MB in a single solution or in a paired solution with MB. An increase in the initial concentration of phenol and MB solution increased the amount of adsorbed adsorbate on CAC.
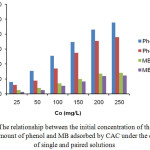 |
Figure 5: The relationship between the initial concentration of the solution with the amount of phenol and MB adsorbed by CAC under the conditions of single and paired solutions. |
To investigate the relationship between the initial concentration of the solution with the amount of phenol and MB adsorbed by CAC under the conditions of single and paired solutions, the adsorption data contained in Fig.5 was analyzed by Langmuir adsorption isotherm equation (Eq. 4) and Freundlich adsorption isotherm (Eq.5).29
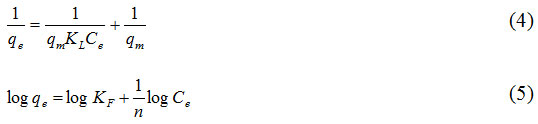
For the Langmuir adsorption isotherm equation, it is known that Ce (mg L-1) is the equilibrium concentration of the metal ion solution, qe (mg g-1) is the metal ion adsorption capacity at equilibrium, qm the adsorbent monolayer adsorption capacity and KL is the adsorption energy constant. Next, plot log qe-1 versus Cewill produce a straight line with (qmKL)-1 as slop and (qm)-1 as intercept. Furthermore, in Freundlich adsorption isotherm equation, plot log qe versus log Ce will produce KF and exponent n, where KF is the adsorption capacity factor and n is the intensity factor, with the values n ranging from 1-10.30 The linear regression equations of the Langmuir and Freundlich isotherms model of the phenol and MB solution adsorbed by CAC under the conditions of single and paired solutions are shown in Fig. 6. Phenol and MB adsorption data on CAC adsorbent obtained from the analysis using Langmuir and Freundlich equations are shown in Table 2.
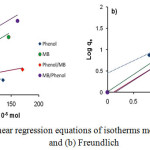 |
Figure 6: The linear regression equations of isotherms models of (a) Langmuir and (b) Freundlich. |
Table 2: Langmuir and Freundlich parameters for the adsorption of phenol and MB on CAC at temperature 27 °C and contact time 120 min.
| Adsorbate | qm Exp (mmol g-1) | Langmuir | Freundlich | |||||
| qm (mmol g-1) | KL (L g-1) x 10-2 | R2 | KF | n | R2 | |||
| Phenol | 0.478 | 0.625 | 26.534 | 0.864 | 2.825 | 1.739 | 0.997 | |
| MB | 0.141 | 0.169 | 28.612 | 0.849 | 1.230 | 1.341 | 0.990 | |
| Phenol/MB | 0.380 | 0.552 | 11.118 | 0.594 | 1.202 | 1.334 | 0.962 | |
| MB/Phenol | 0.123 | 0.167 | 16.949 | 0.519 | 1.288 | 1.293 | 0.961 | |
From the data contained in Fig. 6 and Table 2, it can be observed that phenol and MB adsorption isotherm models on CAC adsorbents in both single and paired solution show that the adsorption process of these two adsorbates tends to follow Freundlich adsorption isotherm pattern. In the Freundlich adsorption isotherm model, the value of R2 is closer to 1 compared with Langmuir adsorption isotherm model.
The Freundlich isotherm model assumes that the adsorption is heterogeneous and the active sites on the surface of the adsorbent has a different adsorption ability to adsorbate.31 This shows that the layer of adsorbate formed on the surface of the adsorbent is multilayer26,32 contrary to result of adsorption Immobilization of Chaetoceros sp microalgae with silica as supporting matrix33. In Table 2 it can be observed that phenol and MB adsorption on CAC have an adsorption intensity values of more than one (n > 1) indicating that the adsorption process increases with an increase in adsorbate concentration.28,31 The adsorption of phenol and MB on CAC occurs through the pore cavities of carbon from the oil palm shell formed through the physics process and the H3PO4 activator. Increased concentration of adsorbate increases interface between the adsorbate in aqueous phase and adsorbent and also offers the required driving force to overcome the resistance to the mass transfer of phenol and MB between the solid phase and the aqueous phase.2
From Table 2, it can be observed that CAC shows higher heterogeneity for phenol than that for MB. The value of KF shows that the more uptake capacity of phenol than that MB on CAC, either in single or in pairs. The adsorption competition between phenol and MB shows that phenol in pairs in solution with MB is more adsorbed by the amount of adsorbed phenol (qm Exp) of 0.380 mmol g-1 compared to MB (qm Exp) of 0.123 mmol g-1. This happens because phenol has a molecular size and the molecular mass is relatively smaller than that of MB, so phenol has faster mobility to occupy active sites on the CAC compared to MB in pairs. Thus it can be stated that the size and mass of the relative molecule have an effect on the adsorption process if the adsorbate is competed in pairs.27
Conculsions
Activated carbon derived from chemically activated palm coconut shell using H3PO4 activator can be used as an effective adsorbent to remove phenol and MB, either in the form of single solution or in pairs. Phenol adsorption on CAC is optimum at pH 8 while MB adsorption on CAC is optimum at pH 11 with optimum contact time of 90 min for phenol and 120 min for MB respectively. The phenol and MB adsorption process were performed in single and binary systems using the batch method. The phenol and MB adsorption data on the CAC in a single system follow the pseudo-second-order kinetic model. The adsorption of phenol and MB on the CAC tends to follow Freundlich adsorption isotherm pattern which is dominated by physical interactions through porous cavities of the activated carbon.
Acknowledgement
The authors say thank you to the Directorate of Research and Community Service, Directorate General for Research and Development, Ministry of Research, Technology and Higher Education of the Republic of Indonesia who have promoted this project with Contract number: 062/SP2H/LT/DPRM/2018. The authors also thank you for the facilities provided by The Technical Service Unit of the Integrated Laboratory and the Technology Innovation Center–University of Lampung (UPT Laboratorium Terpadu dan Sentra Inovasi Teknologi-Universitas Lampung).
References
- Suharso; Buhani. Asian. J. Chem. 2011, 23(3), 1112-1116.
- Singh, N.; Balomajumder, C. J. Water Process Eng. 2016, 9, 233-245.
CrossRef - Shao, Y.; Zhou, L.; Bao, C.; Ma J.; Liu, M.; Wang, F. Chem. Eng. J. 2016, 283, 1127–1136.
CrossRef - Vaiano, V.; Sacco, O.; Sannino, D.; Ciambelli, P. Appl. Catal. B-Environ. 2015, 170, 153–161.
CrossRef - Saitoh, T.; Saitoh, M; Hattori, C.; Hiraide, M. J. Environ. Chem. Eng. 2014, 2(1), 752–758.
CrossRef - Weber, C. T.; Collazzo, G.C.; Mazutti, M.A.; Foletto, E.L.; Dotto, G.L. Water. Sci. Technol. 2014, 70(1), 102–107.
CrossRef - Buhani; Suharso; Satria, H. Eur. J. Sci. Res. 2011, 51(4), 467-476.
- Wu, J. S.; Liu, C.H.; Chu, K.H.; Suen, S.Y. J. Membrane Sci. 2008, 309 (1-2), 239–245.
CrossRef - Buhani; Suharso; Fitriyani, A.Y. Asian J. Chem. 2013, 25(5), 2875-2880.
- Buhani; Suharso; Aprilia, L. Indo. J. Chem. 2012, 12(1), 94-99.
- Patel, R; Suresh, S. Bioresour. Technol. 2008, 99 (1), 51-58.
CrossRef - Li, Q.; Qi, Y.; Gao, C. J. Clean. Prod. 2015, 86, 424-431.
CrossRef - Gong, Z.; Li, S.; Ma, J.; Zhang, X. Sep. Purif. Technol., 2016, 157, 131-140.
CrossRef - Kang, Y.L.; Khoon, S.T.; Monash, P.; Ibrahim, S.; Saravanan, P. Asia-Pacific J. Chem. Eng. 2013, 8, 811-818.
CrossRef - Ozbay, N.; Yargic, A.S. J. Clean. Prod. 2015, 100, 333–343.
CrossRef - Sayğılı, H.; Güzel, F.; Önal, Y. J. Clean. Prod., 2015, 93, 84–93.
CrossRef - Ajayi, O.A.; Olawale, A.S. Journal of Appl. sci. Res. New York. 2009, 5(12), 2148-2152.
- Hidayu, A.R; Muda, N. Procedia Engineering. 2016, 148, 106 – 113.
CrossRef - Khanday, W.A; Asif, M.; Hameed, B.H. Int. J. Biol. Macromol.2017, 95, 895-902.
CrossRef - G. A.; Chowdhury, Z. Z.; Alaba, P. A. J. Clean. Prod. 2017, 148, 958-96.
- Tan, I.A.W.; Chan, J.C.; Hameed, B.H.; Li, L.L.P. J. Water Process Eng. 2016, 14, 60-70.
CrossRef - Latinwo, G.K; Agarry, S.E. Chem. Mater. Res. 2015, 7(5), 123-137.
- Hamad; Bakhtiar, K.; Noor, M.D.; Rahim, A.A. J. Phys. Sci. 2011, 22(1), 39-55.
- Jamwal, H.S; Kumari, S.; Chauhan, G.S.; Reddy, N.S.; Ahn, J.H. J. Environt. Chem. Eng. 2017, 5(1), 103-113.
- Vinod, V.P.; Anirudhan, T.S. J. Sci. Ind. Res. 2002, 61, 128-138.
- Zhang, Q.; Lu, T.; Bai, D.M.; Lin, D.Q.; Yao, S.J. Chem. Eng. J. 2016, 284, 972-978.
CrossRef - Buhani; Musrifatun; Pratama, D.S.; Suharso; Rinawati. Asian. J. Chem. 2017, 29(12), 2734-2739.
- Buhani; Narsito; Nuryono; Kunarti, E.S; Suharso. Desalin. Water Treat. 2015, 55, 1240-1252.
- Buhani; Herasari, D.; Suharso; Yuwono, S.D.; Orient. J. Chem., 2017, 33(1), 418-42.
- Ho, Y.S.; Porter, J.F.; McKay, G. Water Air Soil Pollut. 2002, 141, 1-33.
CrossRef - Buhani; Rinawati; Suharso; Yuliasari, D.P.; Yuwono, S.D; Desalin. Water Treat. 2017, 80, 203–213.
CrossRef - Guler, U.A.; Ersan, M.; Tuncel, E.; Dügenci, F.; Process Saf. Environ. Prot. 2016, 99, 194–206.
CrossRef - Buhani; Suharso; Sembiring, Z. Orient. J. Chem., 2012, 28(1), 271-278.

This work is licensed under a Creative Commons Attribution 4.0 International License.
![]()
A New Edition of Web of Science
Journal Impact Factor
2022: 0.5
Five Year: 0.8
Journal is Indexed in

Cabells Whitelist
![]()


