Theoretical Approach of the Adsorption of Herbicide Amitrole on the Soil using DFT Method
Rabia Tazi, Hamza El Hadki, Mohammed Salah, Abdallah Zrineh, Mohammed El Azzouzi and Najia Komiha
Laboratory of Spectroscopy, Molecular Modeling, Materials, Nanomaterials, Water and Environment (LS3MN2E)-Faculty of Sciences-University Mohammed V-Rabat-Morocco.
Corresponding Author E-mail: rabeatazi@hotmail.com
DOI : http://dx.doi.org/10.13005/ojc/340306
Article Received on : May 02, 2018
Article Accepted on : June 10, 2018
Article Published : 22 Jun 2018
Quantum chemical calculations were performed on amitrole used as herbicide in agriculture to investigate its interaction with humic substances which are the main components of soil organic matter. They contain carboxylic, phenolic, amine and quinonic groups as well as specific structural configurations. Global and local reactivity have been studied to predict reactive centers and to determine the favorable site for interaction with surface. The results suggest us that hydrogen bonds are formed between this compound and the amino acids of soil organic matter. The effect of water as solvent is considered since adsorption of pesticide commonly occurs in aqueous environment.
KEYWORDS:Amitrole; DFT; Herbicide; Quantum Chemical Calculations; Reactivity Indices
Download this article as:| Copy the following to cite this article: Tazi R, El-Hadki H, Salah M, Zrineh A, El-Azzouzi M, Komiha N. Theoretical Approach of the Adsorption of Herbicide Amitrole on the Soil using DFT Method. Orient J Chem 2018;34(3). |
| Copy the following to cite this URL: Tazi R, El-Hadki H, Salah M, Zrineh A, El-Azzouzi M, Komiha N. Theoretical Approach of the Adsorption of Herbicide Amitrole on the Soil using DFT Method. Orient J Chem 2018;34(3). Available from: http://www.orientjchem.org/?p=46781 |
Introduction
Amino-1, 2, 4-triazole (ATA) is an active substance of pesticides. Potentially dangerous when applied to plants, this compound must be controlled to provide quality in food and in ecosystem. Indeed, it diminishes its capacity to capture the light and thus slows its growth.1-4 Previous experimental results suggested the formation of hydrogen bonds between the herbicide and humic acid.5-6 It appears that these bonds are responsible of adsorption of soluble humic substances and thus transport of amitrole in underground layers.
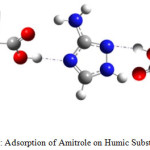 |
Figure 1: Adsorption of Amitrole on Humic Substances |
The main objective of this paper is the study of electronic structures, properties and reactivity of this herbicide with humic substances (Figure 1) that have heterogeneous structure with hydrophilic and hydrophobes areas.7-9 Frontier molecular orbital and chemical characteristics in aqueous solutionhave been used to explain the adsorption of herbicide in soil. The reactivity is related to global and local reactivity indices.10 The chemical characteristics in aqueous solution have been determined by Fukui indices approach. The results obtained predict that the studied compounds have pseudo-aromatic structure explaining interaction between bonds, large dipole moment and significant ability to produce a hydrogen bond.
Materials and Methods
Theoretical calculations are based on the Density Functional Theory11 using the hybrid functional B3LYPwith 6-311G++(d,p) basis set through Gaussian09 software.12 Graphical interface Gauss View package13 is used for building and viewing the results. The electronic structures of the stationary points were determined using Becke’s three-parameter hybrid exchange functional associated with the gradient-corrected correlation functional of Lee, Yang, and Parr B3LYP methods14 and have been analyzed by the natural bond orbital method (NBO).15-17 Following energy minimization, frequency calculations were made in order to verify that all harmonic vibration frequencies have real values indicating that the structure represents a local minimum of energy. To take account of solvation effects, polarisable continuum model (PCM) was used.18
Results and Discussion
Structural and Energy Study
The results obtained for the optimized structures of 3-aminotriazole 3(ATA) and 5-aminotriazole 5(ATA) are reported in Figure 2, Table 1 where values in parentheses are determined for aqueous solution.
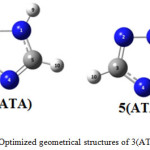 |
Figure 2: Optimized geometrical structures of 3(ATA) and 5(ATA). |
Table 1: Calculated structural parameters of 3(ATA): bond distances in Å and angles in°
| B3LYP | 3(ATA) | ||
| 6- 311G++(d,p) | |||
| N1-N2 | 1.368 (1.369) | N2N1 H9 | 119.92 (120.59) |
| N2-C3 | 1.326 (1.328) | C5N1H9 | 129.83 (129.07) |
| C3-N4 | 1.368 (1.367) | N2C3N6 | 123.09 (123.16) |
| N4-C5 | 1.319 (1.326) | N1C5H10 | 123.63 (123.45) |
| C5-N1 | 1.344 (1.337) | N4C5H10 | 126.20(126.42) |
| C3-N6 | 1.379 (1.381) | C3N6H7 | 114.12 (113.76) |
| C1-H9 | 1.007 (1.009) | C3N6H8 | 114.96 (114.48) |
| C5-H10 | 1.079 (1.079) | H7N6H8 | 114.16 (112.32) |
| N6-H7 | 1.009 (1.011) | N1N2C3N4 | 0.34 (0.18) |
| N6-H8 | 1.009 (1.011) | N2C3N4C5 | -0.29 (-0.07) |
| N1N2C3 | 101.67 (101.89) | C3N4C5N1 | 0.10 (-0.09) |
| N2C3 N4 | 115.04 (114.69) | N1N2C3N6 | -176.99 (-176.64) |
| C3N4C5 | 102.86 (102.96) | C5N4C3N6 | 177.08 (176.79) |
| N4C5N1 | 110.18 (110.13) | H9N1C5N4 | -179.83 (179.73) |
| C5N1N2 | 110.25 (110.33) | H9N1N2C3 | 179.70 (-179.80) |
| N4C3N6 | 121.82 (122.08) | N2N1C5N4 | 0.11 (0.21) |
Table 2: Calculated structural parameters of 5(ATA): bond distances in Å and angles in°
| B3LYP | 5(ATA) | ||
| 6- 311G++(d,p) | |||
| N1-N2 | 1.372 (1.372) | N1C5N6 | 124.10 (124.10) |
| N2-C3 | 1.315 (1.315) | C5N6H7 | 112.18 (112.18) |
| C3-N4 | 1.367 (1.367) | C5N6H8 | 116.22 (116.22) |
| N4-C5 | 1.321 (1.320) | H7N6H8 | 112.52 (112.52) |
| C5-N1 | 1.354 (1.354) | N1N2C3N4 | 0.31 (0.31) |
| C5-N6 | 1.380 (1.380) | N2C3N4C5 | -0.44 (-0.44) |
| C1-H9 | 1.007 (1.007) | C3N4C5N1 | 0.37 (0.37) |
| N6-H7 | 1.011 (1.010) | N2N1C5N6 | 176.70 (176.70) |
| N6-H8 | 1.010 (1.010) | C3N4C5N6 | -176.47 (176.47) |
| C3-H10 | 1.079 (1.079) | N4C5N6H7 | -11.92 (-11.92) |
| N1N2C3 | 101.71 (101.71) | N4C5N6H8 | -143.36 (-143.36) |
| N2C3 N4 | 115.67 (115.67) | N1N2C3H10 | 179.79 (179.79) |
| C3N4C5 | 102.86 (102.85) | H10C3N4C5 | -179.92 (-179.92) |
| N4C5N1 | 109.82 (109.82) | H9N1C5N4 | -175.18 (-175.18) |
| C5N1N2 | 109.94 (109.94) | H9N1N2C3 | 175.49 (175.49) |
| N4C5N6 | 126.00 (126.00) | N2N1C5N4 | -0.21 (-0.21) |
| N2N1H9 | 120.00 (120.00) | H9N1C5N6 | 1.73 (1.73) |
| C5N1H9 | 129.89 (129.89) | C5N1N2C3 | -0.06 (-0.06) |
| N2C3H10 | 121.57 (121.57) | N1C5N6H7 | 171.68 (171.67) |
| N4C3H10 | 122.77 (122.77) | N1C5N6H8 | 40.23 (40.23) |
The values obtained are in good agreement with the previous datareported in the literature.16,17 We can note that the molecular structures have a planar conformation with a partial electron delocalization between amino and triazolic groups.
Table 3: Energy and dipole moment
|
DFT/B3LYP 6-311G++(d,p) |
3(ATA) |
5(ATA) |
||
|
gas phase |
aqueous phase |
gas phase |
aqueous phase |
|
|
ET (u.a) |
-297.70327 |
-297.71719 |
-297.70196 |
-297.71712 |
|
μ(Debye) |
2.058 |
2.852 |
3.743 |
4.784 |
The analysis of Table 3 shows that 3(ATA) is energetically more stable than its isomer and solvated forms are slightly stabilized (respectively 0.38 and 0.41 eV). The values of the dipole moment μ vary in the same sense predicting a most important polarity for 5(ATA) and a strong electronic distribution.
Mulliken Charges
The calculation of charges on each atom allows us to determine the soil adsorption sites. The values obtained are reported in Table 4.
Table 4: Values of Mulliken atomic charges determined by DFT calculations
| 3(ATA) | 5(ATA) | |||
| Atom | Gas | Solution | Gas | Solution |
| N1 | -0.213 | -0.199 | -0.183 | -0.147 |
| N2 | -0.171 | -0.242 | -0.199 | -0.285 |
| C3 | -0.049 | -0.006 | -0.067 | -0.04 |
| N4 | -0.258 | -0.34 | -0.252 | -0.334 |
| C5 | 0.019 | 0.031 | 0.05 | 0.064 |
| N6 | -0.324 | -0.38 | -0.345 | -0.385 |
| H7 | 0.254 | 0.277 | 0.277 | 0.293 |
| H8 | 0.252 | 0.278 | 0.236 | 0.279 |
| H9 | 0.322 | 0.365 | 0.311 | 0.357 |
| H10 | 0.17 | 0.216 | 0.171 | 0.197 |
It may be noted that the greatest values of the negative charges are carried by the atoms N1, N2, N4 and N6. Indeed, N2 and N4 have a pair of free electrons that would facilitate the adsorption on the ground surface. According to the results, the most appropriate site to create a binding is N4.The results obtained are in good agreement with those determined previously.20
Molecular Electrostatic Potential Analysis
The molecular electrostatic potential is widely used as reactivity map providing very useful information for explaining structure-activity relationship, electronegativity, atomic net charges and chemical reactivity. Electronic isosurfaces obtained for the studied compounds, in gas phase and in solution, are reported in Figure 3.
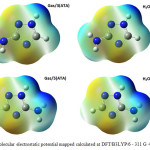 |
Figure 3: Molecular electrostatic potential mapped calculated at DFT/B3LYP/6 – 311 G ++(d,p) level Click here to View figure |
Regions where electrostatic potential is negative correspond to areas of high electronic density and, therefore, to a strong attraction between protons of the functional groups (carboxylic and phenolic) and humic substances. On these molecular surfaces, the involved regions are on N2 and N4 with respectively an isovalue of -0,053 and -0,071. The regions where values are positive (dark blue) have maximum repulsion and low electron density. More positive electrostatic potential regions are on triazole rings with a value of 0,106.
Frontier Orbitals Analysis
A characterization of electronic molecular orbital plays an important role in the chemical stability because they reflect the activity.21,22 Electronic distributions frontiers molecular orbital (OMF’s) and their energetic difference ΔE are reported in Table 5.
Table 5: Energy of OMF’s in gaseous and solvated phases
|
DFT/6311G++(d,p) |
3(ATA) |
5(ATA) |
||
|
Gas |
Solution |
Gas |
Solution |
|
|
HOMO |
-0.2301 |
-0.2382 |
-0.2432 |
-0.2461 |
|
LUMO |
-0.0139 |
-0.0088 |
-0.0277 |
-0.0085 |
|
ΔE LUMO – HOMO |
0.2162 |
0.2294 |
0.2155 |
0.2376 |
The frontiers molecular orbital, determined in gaseous and aqueous phases, are plotted in Figure 4.
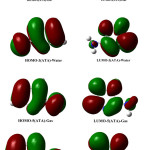 |
Figure 4: Schematic representation of the frontier orbitals for 3(ATA) and 5(ATA) in gaseous and water phases Click here to View figure |
It can be seen that the HOMO is delocalized over the amino group and on the double bonds of the triazole ring while LUMO is over C5-N4 bond and on each heteroatom. The analysis shows that solvation stabilizes slightly molecular orbital and leads to similar results. We can conclude that the compounds are less reactive in solvated phase.
Global and Local Reactivity Descriptors
The general behaviour of amitrole may be analysed using the global reactivity parameters derived from DFT. The results obtained previously served for determination of electronegativity (χ), electronic chemical potential (μ), hardness (η), softness (S), global electrophilicity index (ω) defined through the following equations where I and A represent respectively ionization potential and vertical electronic affinity.
χ = (I + A)/2 (1)
μ = − χ (2)
η= (I – A) (3)
S = 1/2η (4)
ω = μ2/2η (5)
The results obtained (values in solution are in parentheses), allowing global reactivity affinities description, are grouped in Table 6.
Table 6: Global Reactivity Descriptor
|
Compound |
χ (kJ/mol) |
µ (kJ/mol) |
η (kJ/mol) |
S (kJ/mol) |
ω (kJ/mol) |
|
3(ATA) |
320.311 (324.157) |
-320.311 (-324.157) |
567.791 (602.263) |
0.00089 (0.00083) |
90.3494 (87.2659) |
|
5(ATA) |
355.611 (334.161) |
-355.611 (-334.161) |
565.979 (623.793) |
0.00088 (0.00080) |
111.7171 (89.5035) |
The values of hardness for both compounds are higher in solution leading to greater stability. With respect to ω electrophilic character index, the value obtained for the 5(ATA) isomer indicates a better reactivity.
In addition to the global reactivity parameters, it is essential to define local reactivity descriptors23 as the Fukui Function which can be expressed as:
where ρ(r) is the electronic density.
However, due to the discontinuity of the electron density with respect to the number of electrons (N), this approximation leads to Fukui functions respectively named fk+, fk– for electrophilic and nucleophilic attacks24 evaluated through the following equations:
where qk is the atomic charge evaluated from Mulliken population at the kth atomic site in the neutral (N), cationic (N+1) or anionic (N-1) chemical species.
The use of local indices of Parr (ωk and Nk) allows us to predict the most favorable chemical bond formation.They are given respectively by the expressions:
The results obtained for the different parameters are grouped in Tables 7 and 8.
Table 7: Local reactivity descriptors of 3(ATA).
| 3(ATA) – Gas |
qk (N) |
qk (N +1) |
qk (N-1) |
fk+ |
fk– |
ωk |
Nk |
|
N1 |
-0.36475 |
-0.39667 |
-0.28576 |
0.03192 |
0.07899 |
0.02989 |
0.24590 |
|
N2 |
-0.38191 |
-0.3983 |
-0.15725 |
0.01639 |
0.22466 |
0.01535 |
0.69938 |
|
C3 |
0.50427 |
0.49351 |
0.53019 |
0.01076 |
0.02592 |
0.01007 |
0.08069 |
|
N4 |
-0.54675 |
-0.57762 |
-0.45809 |
0.03087 |
0.08866 |
0.02890 |
0.27600 |
|
C5 |
0.21572 |
0.19372 |
0.30435 |
0.022 |
0.08863 |
0.02060 |
0.27591 |
|
N6 |
-0.80286 |
-0.835 |
-0.49753 |
0.03214 |
0.30533 |
0.03009 |
0.95051 |
|
H7 |
0.38631 |
0.28991 |
0.43228 |
0.0964 |
0.04597 |
0.09026 |
0.14311 |
|
H8 |
0.38491 |
0.26716 |
0.4266 |
0.11775 |
0.04169 |
0.11025 |
0.12978 |
|
H9 |
0.4069 |
0.04049 |
0.45361 |
0.36641 |
0.04671 |
0.34307 |
0.14541 |
|
H10 |
0.19816 |
-0.07719 |
0.25162 |
0.27535 |
0.05346 |
0.25781 |
0.16642 |
|
3(ATA)-water |
qk (N) |
qk (N +1) |
qk (N -1) |
fk+ |
fk– |
ωk |
Nk |
|
N1 |
-0.3528 |
-0.41372 |
-0.27291 |
0.06092 |
0.07989 |
0.05508 |
0.23118 |
|
N2 |
-0.41225 |
-0.43499 |
-0.17626 |
0.02274 |
0.23599 |
0.02056 |
0.68289 |
|
C3 |
0.5063 |
0.46662 |
0.53986 |
0.03968 |
0.03356 |
0.03588 |
0.09711 |
|
N4 |
-0.59079 |
-0.60479 |
-0.49886 |
0.014 |
0.09193 |
0.01266 |
0.26602 |
|
C5 |
0.22912 |
0.21083 |
0.31496 |
0.01829 |
0.08584 |
0.01654 |
0.24840 |
|
N6 |
-0.81809 |
-0.87377 |
-0.4954 |
0.05568 |
0.32269 |
0.05034 |
0.93377 |
|
H7 |
0.39557 |
0.25579 |
0.43647 |
0.13978 |
0.0409 |
0.12638 |
0.11835 |
|
H8 |
0.39558 |
0.15256 |
0.4338 |
0.24302 |
0.03822 |
0.21972 |
0.11060 |
|
H9 |
0.43012 |
0.07021 |
0.46489 |
0.35991 |
0.03477 |
0.32541 |
0.10061 |
|
H10 |
0.21724 |
0.17127 |
0.25346 |
0.04597 |
0.03622 |
0.04156 |
0.10481 |
Table 8: Local reactivity descriptors of 5(ATA).
|
5(ATA) – Gas |
qk (N) |
qk (N +1) |
qk (N -1) |
fk+ |
fk– |
ωk |
Nk |
|
N1 |
-0.40231 |
-0.43416 |
-0.35524 |
0.03185 |
0.04707 |
0.03688 |
0.12971 |
|
N2 |
-0.32539 |
-0.3548 |
-0.07446 |
0.02941 |
0.25093 |
0.03405 |
0.69150 |
|
C3 |
0.18362 |
0.17032 |
0.26671 |
0.0133 |
0.08309 |
0.015400 |
0.22898 |
|
N4 |
-0.56611 |
-0.59146 |
-0.4235 |
0.02535 |
0.14261 |
0.02935 |
0.39300 |
|
C5 |
0.54416 |
0.54136 |
0.59443 |
0.0028 |
0.05027 |
0.00324 |
0.13853 |
|
N6 |
-0.80339 |
-0.86809 |
-0.56337 |
0.0647 |
0.24002 |
0.07491 |
0.66144 |
|
H7 |
0.39632 |
0.26088 |
0.4358 |
0.13544 |
0.03948 |
0.15682 |
0.10880 |
|
H8 |
0.37822 |
-0.09937 |
0.42393 |
0.47759 |
0.04571 |
0.55299 |
0.12597 |
|
H9 |
0.40299 |
0.20531 |
0.44873 |
0.19768 |
0.04574 |
0.22889 |
0.12605 |
|
H10 |
0.19189 |
0.17002 |
0.24697 |
0.02187 |
0.05508 |
0.02532 |
0.15179 |
|
5(ATA) – water |
qk (N) |
qk (N +1) |
qk (N -1) |
fk+ |
fk– |
ωk |
Nk |
|
N1 |
-0.39481 |
-0.42127 |
-0.32348 |
0.02646 |
0.07133 |
0.02454 |
0.19106 |
|
N2 |
-0.35957 |
-0.37533 |
-0.12699 |
0.01576 |
0.23258 |
0.01462 |
0.62296 |
|
C3 |
0.178 |
0.17768 |
0.26252 |
0.00032 |
0.08452 |
0.00030 |
0.22639 |
|
N4 |
-0.60515 |
-0.61266 |
-0.46112 |
0.00751 |
0.14403 |
0.00697 |
0.38578 |
|
C5 |
0.55794 |
0.55296 |
0.59654 |
0.00498 |
0.0386 |
0.00462 |
0.10339 |
|
N6 |
-0.80787 |
-0.93647 |
-0.52706 |
0.1286 |
0.28081 |
0.11929 |
0.75214 |
|
H7 |
0.4028 |
0.33657 |
0.43716 |
0.06623 |
0.03436 |
0.06144 |
0.09203 |
|
H8 |
0.40269 |
-0.264 |
0.4412 |
0.66669 |
0.03851 |
0.61845 |
0.10315 |
|
H9 |
0.42781 |
0.34746 |
0.46316 |
0.08035 |
0.03535 |
0.07454 |
0.09468 |
|
H10 |
0.19813 |
0.19507 |
0.23806 |
0.00306 |
0.03993 |
0.00284 |
0.10695 |
It may be noted that the distributions of the most reactive sites of this herbicide are located on N2 and N4 confirming the values obtained with the Fukui indices (Figure 5).
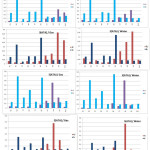 |
Figure 5: Values of the Fukui function for 3(ATA) and 5(ATA) in gaseous and water phases Click here to View figure |
From all the results detailed above, it can be concluded that an electrophilic attack will preferably occur at the level of the triazole ring, more particularly on the N2 atom for the 5(ATA) in the two phases. Protonation of 3(ATA) will take place certainly at the level of N4 since this herbicide is stable in solution. These results suggest that 5(ATA) is always the most reactive and 3(ATA) is the most stable in solution.
Conclusion
In the present work, the geometries of studied compounds were optimized with DFT/B3LYP methods using 6-311G++(d,p) basis set in gas and in aqueous phase. The molecular structural parameters were obtained and the Mulliken charges calculated were presented. Information on charge density distribution and structure-activity relationship were obtained by mapping electron density isosurfaces with electrostatic potential. Molecular Orbital’s study reveals the intramolecular charge transfer through the conjugated system. Determination of chemical reactivity of 3(ATA) and 5(ATA) in both phases employing global and local reactivity parameters indicates that 5(ATA) is the most reactive while 3(ATA) is the most stable in ground soil. The Fukui function values suggest that electrophilic attacks on herbicides would be on N4 in aqueous conditions. The present quantum chemical study indicated that hydrogen bonds could have occurred between the soil and the organic molecules and determined the available active groups.
Acknowledgements
The authors thank AMCT for Gaussian program.
References
- Sellamuthu, R. 2014. Amitrole, Author Vitae Encyclopedia of Toxicology (Third edition), 203-205.
CrossRef - Pozdnyakov, I.P.; Sherin, P.S.; Salomatova, V.A.; Parkhats, M.V.; Grivin, V.P.; Dzhagarov B.M.; Bazhin N.M.; Plyusnin V.F. Environ Sci.Pollut.Res.Int.2017. doi:10.1007/s11356-017-8580-x.
CrossRef - Chicharro, M.; Bermejo, E.; Moreno, M.; Sanchez, A.; Zapardiel, A.; Rivas, G. Electroanalysis. 2005, 17, 476-482.
CrossRef - Baglieri,A.;Vindrola,D. http://www.chembioagro.com/content/1/1/9/-ins2; Gennari,M. http://www.chembioagro.com/content/1/1/9/- ins1; Negre, M. Chemical and Biological Technologies in Agriculture. 2014. 1-9.
- Tazi, R.; El Hasiní, S.; EL YacoubiKhouja, H.; Zaydoun, S.; Zrineh, A.; El Azzouzi, M. Research Journal of Pharmaceutical, Biological and Chemical Sciences RJPBCS. 2015, 6, 227-234.
- El Fadil, I.; Tazi, R.; Ouezzani, I.; Altarawneh, R.; Batarsehand, M.; El Azzouzi, M. Research Journal of Pharmaceutical, Biological and Chemical Sciences RJPBCS. 2015, 6, 1463-1472.
- McCarthy, J.F. ; Jimenez, B.D. Environ. Sci. Technol. 1985, 19, 1072-1076.
CrossRef - Gauthier, T. D.; Shane, E. C. ; Guerin, W. F. ; Seitz, W. R. ; Grant C. L. Environ. Sci. Technol. 1986, 20, 1162-1166.
CrossRef - Mill, Th. Chemosphere. 1999, 38, 1379-1390.
CrossRef - (a) Bradley, J.D.; Gerrans, G.C. J. Chem. Educ. 1973, 50, 463 (b) Olbrich, C.; Strümpfer, J.; Schulten, K.; Kleinekathöfer, U. J. Phys. Chem. Lett. 2011, 2, 1771-1776 (c) Fukui,K. ; Yonezawa,T. ; Shingu,H. J. Chem. Phys.1952, 20, 722-725.
CrossRef - (a) Becke,A.D. J. Chem. Phys. 1993, 98, 5648–5652. (b) Becke,A.D. Phys. ReV A. 1988, 38, 3098-3100 (c) L e e, C.; Y a n g, W. ; P a r r , R .G. ; Phys. ReV. B. 1988, 3, 785-789.
CrossRef - Frisch, M.J.; Trucks, G.W.; Schlegel, H.B.; Scuseria, G.E.; Robb, M.A.; Cheeseman, J.R.; Montgomery Jr, J.A.; Vreven, T. ; Kudin, K.N.; Burant, J.C.; Millam, J.M.; Iyengar, S.S.; Tomasi, J.; Barone, V.; Mennucci, B.; Cossi, M.; Scalmani, G.; Rega, N.; Petersson, G.A.; Nakatsuji, H.; Hada, M.; Ehara, M.; Toyota, K.; Fukuda, R.; Hasegawa, J.; Ishida, M.; Nakajima, T.; Honda, Y.; Kitao, O.; Nakai, H.; Klene, M.; Li, X. ; Knox, J.E.; Hratchian, H.P.; Cross, J.B.; Bakken, V.; Adamo, C.; Jaramillo, J; Gomperts, R.; Stratmann, R.E.; Yazyev, O.; Austin, A.J. ; Cammi, R.; Pomelli, C.; Ochterski, J.W.; Ayala, P.Y.; Morokuma, K.; Voth, G.A.; Salvador, P.; Dannenberg, J.J.; Zakrzewski, V.G.; Dapprich, S.; Daniels, A.D.; Strain, M.C.; Farkas, O.; Malick, D.K.; Rabuck, A.D.; Raghavachari, K.; Foresman, J.B.; Ortiz, J.V. ; Cui, Q.; Baboul, A.G.; Clifford, S.; Cioslowski, J.; Stefanov, B.B.; Liu, G.; Liashenko, A.; Piskorz, P.; Komaromi, I.; Martin, R.L.; Fox, D.J. ; Keith, T.; Al-Laham, M.A.; Peng, C.Y.; Nanayakkara, A.; Challacombe, M.; Gill, P.M.W. ; Johnson, B.; Chen, W.; Wong, M.W.; Gonzalez, C.; Pople, J.A.; Gaussian 03, Revision D, Gaussian,Inc., Wallingford, CT, 2004.
- Dennington II, R.; Keith, T.; Millam, J.; Eppinnett, K.; Hovell, W.L.; Gilliland, R.; GaussView, Version 3.0.9, Semichem Inc., Shawnee Mission, KS, 2003.
- Becke,A.D. Journal of Chemical Physics.1993, 98, 5648‑5652.
CrossRef - Keresztury,G.; Holly,S.; Besenyei,G.; Varga,J. ; Wang,A.; Durig, J. R. SpectrochimicaActa Part A: Molecular Spectroscopy. 1993, 49, 2007‑2026.
CrossRef - Reed,A. E.; Curtiss,L. A.; Weinhold,F.Chem. Rev. 1988, 88, 899-926.
CrossRef - Reed,A. E.; Weinstock,R. B.; Weinhold,F. Journal of Chemical Physics. 1985,83, 735‑746.
CrossRef - Barone, V.; Cossi, M.; Tomasi, J. J. Chem. Phys. 1997, 107, 3210-3221.
CrossRef - (a) GilchristT.I.; Gymer.G.E. Advances in Heterocyclic Chemistry.1974, 16, 33-85 (b) Pagacz-Kostrzewa, M.; Bronisz, R.; Wierzejewska, M. Chemical Physics Letters. 2009, 473, 238-246 (c) Shojaie,F.Jordan Journal of Chemistry. 2015, 10, 161-178 (d) Yankova,R.; Radev,L. Journal of Materials and Chemistry, 2015, 5, 25-30 (e) Yankova,R.; Avramov,S. Journal of Multidisciplinary Engineering Science Studies. 2016, 2, 569-573.
CrossRef - Dżygiel,A.; Masiukiewicz,E.; Rzeszotarska,B. J. Agric. Food Chem. 2002, 50, 1383-1388.
- Marakchi,K.; Ghailane,R.; Kabbaj,O.K.; Komiha,N. J. Chem. Sci.2014, 126, 283-292.
CrossRef - Salah,M.; Komiha,N.; Kabbaj,O.K; Ghailane,R.; Marakchi,K.; Journal of Molecular Graphics and Modelling. 2017, 73, 143-151.
CrossRef - Parr,R.G. J. Am. Chem. Soc. 1984, 106, 4049-4050.
CrossRef - Borgoo,A.; Tozer,D.J.; Geerlings,P. J. Chem. Phys. 2009, 11, 2862-2868.
CrossRef

This work is licensed under a Creative Commons Attribution 4.0 International License.
![]()
A New Edition of Web of Science
Journal Impact Factor
2022: 0.5
Five Year: 0.8
Journal is Indexed in

Cabells Whitelist
![]()


