The use of Copper Oxides Supported Onto Biogenic Silica from the Leaves of Dendrocalamus Asper for Degradation of Congo Red
Anti Kolonial Prodjosantoso , Dinar Indah Lufita, Hafis Prasiwi, Kun Sri Budiasih and Maximus Pranjoto Utomo
Department of Chemistry, Yogyakarta State University, Yogyakarta, 55281, Indonesia.
Corresponding Author E-mail: prodjosantoso@uny.ac.id
DOI : http://dx.doi.org/10.13005/ojc/340314
Article Received on : March 31, 2018
Article Accepted on : May 07, 2018
Article Published : 14 May 2018
Silica, which may be isolated from leaves, is one of the better known catalyst supports having a large surface area and high stability. Photocatalysts of the type CuOx@SiO2 were prepared using biogenic silica isolated from Dendrocalamus asper leaf, and evaluated for Congo red degradation. The photocatalysts of CuOx@SiO2 (CuOx=0.00%, 0.25%, and 0.50%) was obtained by impregnating the silica in the Cu(NO3)·3H2O solution. A combination XRD and SEM-EDX techniques confirmed the formation of CuOx as the active phase of the CuOx@SiO2. The UV-Vis spectroscopy method was used to determine the maximum absorbance and bandgap of the catalysts. Photodegradation assays showed that copper oxides supported onto biogenic silica isolated from Dendrocalamus asper leaf was efficient for Congo red degradation, and that the material worked well in the presence of both UV and visible light.
KEYWORDS:Copper; Dendrocalamus Asper; Biogenic Silica; Photocatalysts; Congo Red
Download this article as:| Copy the following to cite this article: Prodjosantoso A. K, Lufita D. I, Prasiwi H, Budiasih K. S, Utomo M. P. The use of Copper Oxides Supported Onto Biogenic Silica from the Leaves of Dendrocalamus Asper for Degradation of Congo Red. Orient J Chem 2018;34(3). |
| Copy the following to cite this URL: Prodjosantoso A. K, Lufita D. I, Prasiwi H, Budiasih K. S, Utomo M. P. The use of Copper Oxides Supported Onto Biogenic Silica from the Leaves of Dendrocalamus Asper for Degradation of Congo Red. Orient J Chem 2018;34(3). Available from: http://www.orientjchem.org/?p=45730 |
Introduction
The textile industry in Indonesia has expanded considerably over the last two decades,1–4 resulting in the discharge of a large volume of wastewater, containing organic contaminants, to the environment. A significant proportion of the organic compounds discharged can be classified dyes due to their strong absorption of visible light. This absorption of visible light effectively decreases the amount of light available for photosynthesis and can have a significant adverse impact on biological cycles. Moreover, some of these compounds have been identified as potential carcinogens.4–8
Many wastewater treatment techniques have been developed over the centuries. Among these, the oxidative decomposition of the organic waste by hydroxyl radicals (OH·) has emerged as one of the most promising methods for wastewater treatment.9–11 The OH· radical may be produced by UV or visible lights on semiconductors. The semiconductors generate electron-hole pairs, which may react with the surface hydroxyl groups, and oxygen molecules absorbed on the surface of the catalyst, thus yielding hydroxyl radical and the superoxide radical ion, respectively. Another possible mechanism involves the direct reaction between the photo-generated holes and the organic pollutant. In this case, the radical derived from the pollutant molecule reacts with both the OH-radicals and dissolved oxygen.12–14
Copper oxides are being studied as potential catalysts for the treatment of organic pollutants in wastewaters. Copper oxides have a favourable band gap, that allows the absorption of visible light, have low toxicity, and compared to platinum group metals low cost and high availability.18–20 In general it is necessary to disperse the coper oxide onto a high surface area support, which both reduces the amount of copper required and can enhance the catalytic properties of the copperoxide through strong metal-support interactions.15–17 In the current work we have explored the use of a biogenic silica support that is isolated from the Dendrocalamus asper leaf. This is readily available in Indonesia. Here we describe the preparation of a copper oxide photocatalyst prepared using a biogenic silica support CuOx@SiO2 and describe its performance using Congo red as a model for organic pollutants.
Materials and Methods
Biogenic silica was isolated by calcining 100 gram of dry Dendrocalamus asper leaf at 650°C for 4 hours, following by air cooling, and washing with 0.1 M HCl solution. The photocatalyst was prepared by mixing 1.9848 g of biogenic silica and 0.0152 g of copper nitrate [Cu(NO3)·3H2O (Merck)] (0.25 mol% copper in silica) in 5 mL of distilled water.
The mixture was then stirred for 2 h at which time 5 mL absolute ethanol was added and the solid isolated by filtration and air dried. The dry sample was then calcined at 800°C for 4 hours, resulting in biogenic silica supported copper oxide (CuOx@SiO2). The catalysts with 0.5 mol% of copper were prepared by the same procedure except using 0.0304 g of copper nitrate.
The CuOx@SiO2 photocatalysts were characterized by X-ray diffraction (XRD Lab-X Type 6000 Shimadzu, Japan) using Cu Kα radiation (λ = 1.5418 Å) over the angular range 15o ≤ 2q ≤ 60o at a scan speed of 0.02 deg.s-1. Scanning electron micrographs were measured using a Jeol JED-2300 instrument, and UV-Vis spectra were collected between 200-800 nm on a Pharmaspec UV-2450PC Spectrophotometer.
The adsorption behaviour of the catalysts was determined as follows. A 10 mL of Congo red solutions with initial concentrations between 23 and 24 ppm were added to 0.02 g of catalysts powders and the mixture shaken for 24 hours at which time the solid was removed from the solution by centrifuge at a rate of 1500 rpm for 10 minutes. The amount of Congo red adsorbed by the catalyst was estimated by the change in the absorption at 498.2 nm.
The band gap of the samples was estimated using UV-Visspectroscopy. For these measurements the CuOx@SiO2 samples were thoroughly mixed with triton-x and acetylacetonateto form a paste, which was then layered onto a glass slides. The slides were heated at 450°C for 2 hours to remove the organic material.
The photocatalytic activity of the catalysts was determined by measuring the concentration of the un-reacted Congo red estimated from the intensity at 498.2nm.
Results and Discussion
The crystalline materials CuOx@SiO2 (CuOx=0.00%, 0.25%, and 0.50%) were successfully prepared using an impregnation method. The XRD patterns of the samples are similar to that of cristobalite SiO2 (Figure 1). The positions of the peaks and their relative intensities are in good agreement with those in JCPDS card 76-0936. The extra peaks are not observed except for the trydimite SiO2 (JCPDS card 42-1401). Lines shifting are observed indicating supported copper oxides perturb the SiO2 lattice. This is though to be a consequence of copper oxides doped in the SiO2 lattice.
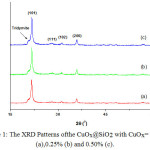 |
Figure 1: The XRD Patterns ofthe CuOx@SiO2 with CuOx= 0.00% (a),0.25% (b) and 0.50% (c). |
The size of the CuOx@SiO2 crystallites was estimated using the Scherrer equation.21 The Scherrer equation is a formula that relates the size of sub-micrometer, or crystallites, in a solid to the broadening of a peak in a diffraction pattern.
The Scherrer equation can be written as:
Where τ is the mean size of the crystallite, which may be smaller or equal to the grain size; K is dimensionless shape factor, which has a typical value of about 0.9, but varies with the actual shape of the crystallite; λ is the X-ray wavelength; β is the line broadening at half the maximum intensity (FWHM), after subtracting the instrumental line broadening, in radians; and θ is the Bragg angle (in degrees). The crystallite size of the CuOx@SiO2 crystallites is about 71nm (Table 1.), consequently these can be classified as nanoparticles.22
Table 1: The Crytallites, Absorbances, and Adsorption Capacity of CuOx@SiO2 of Catalysts
|
CuOx@SiO2, CuOx = |
Size (nm) |
λ (nm) |
Adsorption Capacity (mole/gram) |
|
|
Visible |
UV |
|||
|
0.00% |
68.85 |
288 |
28.5714 |
|
|
0.25% |
70.63 |
453 |
324 |
35.7143 |
|
0.50% |
73.67 |
401 |
346 |
37.1747 |
A combination of SEM and EDX methods were used to establish the distribution of Cu in the biogenic silica supported samples. The SEM micrographs of CuOx@SiO2 (CuOx= 0.00%, 0.25% and 0.50%) are depicted in Figure 2 and reveal considerable roughness and porosity. Both of these effects will increase the effective surface area of the sample, a property that is important in catalysis but they may also impact on the mechanical and thermal properties of the material.23 It is not possible to identify any copperoxides, from the SEM images, reflecting the uniform distribution of the Cu on the biogenic silica support and/or its a trial substitution into the silica lattice. EDX analysis confirms the presence of Cu in all the samples and indicates that the CuOx@SiO2 samples have, within acceptable errors, the targeted Cu contents.
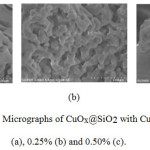 |
Figure 2: SEM Micrographs of CuOx@SiO2 with CuOx= 0.00% (a), 0.25% (b) and 0.50% (c). |
Table 2 summarises the UV-Vis spectroscopy of the sample and for each sample an electronic transition was observed. The Kubelka-Munk equation was used to calculate the band gap energy (Eg) for the CuOx@SiO2 samples as depicted in Figure 3. In general, the addition of CuOx lowers band gap energy which is expected to increase the photocatalytic activity of the materials when irradiated with visible light.
Table 2: The R2 Values of the Line Equation for the Zero-, First-, and Second-Order Degradation Reactions under UV and Visible Light.
|
CuOx@SiO2, CuOx= |
Zero-order |
First-order |
Second-order |
|||
|
UV |
Visible |
UV |
Visible |
UV |
Visible |
|
|
0.00% |
0.5546 |
0.6731 |
0.6176 |
0.9735 |
0.6814 |
0.7401 |
|
0.25% |
0.4511 |
0.9078 |
0.5139 |
0.8235 |
0.5819 |
0.9351 |
|
0.50% |
0.3849 |
0.9013 |
0.4370 |
0.8305 |
0.4959 |
0.9340 |
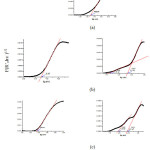 |
Figure 3: The Band Gap Energy of CuOx@SiO2, CuOx=0.00% (a), 0.25% (b) and 0.50% (c). |
The adsorption of the Congo red by the CuOx@SiO2 samples was estimated from the change in the intensity at 498.2 nm for samples after 24 hours in a closed chamber without a light source. These measurements used 0.02 grams of CuOx@SiO2 catalyst and the concentrations of Congo red employed were 2, 4, 6, 8 and 10 (x10-6 mol/L). The catalyst adsorption capacity was calculated using the Langmuir and Freundlich equations. The Langmuir isotherm pattern was determined by correlating the Congo red concentration adsorbed per 1 gram of catalyst (c/m) with Congo red concentration after 24 h (c). The adsorption capacity value (b) on the Langmuir isotherm is given by:
The Freundlich isotherm is obtained by plotting the log value of the amount of Congo red adsorbed per gram of catalyst (log x/m) with the log of Congo red concentration after 24 hours (log c). The adsorption capacity (k) of the Freundlich isotherm was calculated by:
The R2 values of the Langmuir adsorption isotherm pattern are higher than that of the Freundlich isotherm. Thus, we can conclude that adsorption on Congo red degradation by CuOx@SiO2 catalysts follows Langmuir isotherm pattern. The SiO2 has the lowest adsorption capacity (Table 3). This is due to SiO2-supported copper oxide having a larger surface and a greater ability to adsorb CuOx@SiO2 than the pure SiO2.
Table 3: Kinetical Data of Congo Red Photodegradation Reaction Order.
|
CuOx@SiO2,CuOx= |
Reaction Order |
UV light |
Visible light |
||
|
k |
R2 |
k |
R2 |
||
|
0% |
0 |
0.0383 |
0.5546 |
0.0276 |
0.6731 |
|
1 |
0.0031 |
0.6176 |
0.6605 |
0.7401 |
|
|
2 |
0.0003 |
0.5819 |
0.0002 |
0.9735 |
|
|
0.25% |
0 |
0.0349 |
0.4511 |
0.0167 |
0.9078 |
|
1 |
0.003 |
0.5139 |
0.3667 |
0.8235 |
|
|
2 |
0.0003 |
0.5819 |
0.0002 |
0.9351 |
|
|
0.5% |
0 |
0.0326 |
0.3849 |
0.01437 |
0.9031 |
|
1 |
0.0029 |
0.4370 |
0.3287 |
0.8305 |
|
|
2 |
0.0003 |
0.4959 |
0.0002 |
0.9340 |
|
The photodegradation was performed using 0.02 gram CuOx@SiO2 for every 10 ml of 23 to 24 ppm Congo red solutions. The mixtures were placed in a shaker covered by closed box equipped with Evaco 20 Watt fluorescent light. Measurements were undertaken at variations of time ie. 4, 8, 12, 16, 20 and 30 minutes. The absorbance was measured at a wavelength of 498.2 nm using Spectronic 20. The absorbances were then referred to the standard Congo red curve equation to obtain the Congo red concentration (Figure 4).
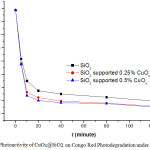 |
Figure 4: Photoactivity of CuOx@SiO2 on Congo Red Photodegradation under UV Light. |
Figure 4 shows the time dependence of the concentration of Congo red upon exposure to UV light. This proves that the degradation of Congo red is effectively performed by the CuOx@SiO2 catalysts, under UV light. Figure 4 also indicates that the CuOx@SiO2 with CuOx 0.25% and 0.50% are more efficient catalysts than SiO2 alone. There is no significant difference between the effectivity of CuOx@SiO2 with CuOx 0.25%, and 0.50%.
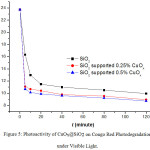 |
Figure 5: Photoactivity of CuOx@SiO2 on Congo Red Photodegradation under Visible Light. |
The photodegradation of Congo red under visible light was undertaken using the same procedure used for Congo red photodegradation under UV light, but the light source used was a Philips ML 100W/220-230E27. Figure 5 illustrates that the concentration of Congo red solution is inversely proportional to the exposure time of visible light. The catalysts show a good performance undervisible light. The performance of CuOx@SiO2 with CuOx=0.50% in degrading Congo red is better than that of SiO2 and CuOx@ SiO2 CuOx= 0.25%.
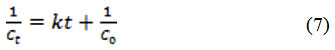
The reaction order was determined for the photo-decomposition of Congo red through consideration of the reaction rate. The largest value of R2 was used to determine the order of reactions. The zero-order reaction was determined by integrating the equation of the reaction rate, as follows:
![]()
where Ct is the concentration of Congo red at time t, k is the rate constant, t is time and C0 is the initial concentration of Congo red. By plotting Ct vs. t, we obtain the equation of the line for the zero-order reaction (Table 4).
Table 4: Congo Red Photodegradation Kinetics with CuOx@SiO2 Catalysts under UV and Visible Light.
|
Light source |
CuOx@SiO2, CuOx= |
kobs(minute-1) |
KL |
k (minute-1) |
|
UV |
0.00% |
0.0031 |
1.2786 |
0.002424527 |
|
0.25% |
0.0003 |
0.0043 |
0.069767442 |
|
|
0.50% |
0.0003 |
0.0042 |
0.071428571 |
|
|
Visible |
0.00% |
0.6605 |
1.2786 |
0.516580635 |
|
0.25% |
0.0002 |
0.0043 |
0.046511628 |
|
|
0.50% |
0.0002 |
0.0042 |
0.047619048 |
The first-order reaction was determined by integrating the rate of reaction to obtain the equation of the reaction, as follows:
In (Ct / Co )= -kt (5)
In Ct = –kt + In Co (6)
By plotting ln Ct vs. t, we obtain the equation of the line for the first-order reaction (Table 5).
Table 5: Reaction Rate of Congo Red Photodegradation using CuOx@SiO2 under UV and Visible Light.
|
CuOx@SiO2, CuOx= |
Reaction rate (ppm.minute-1) |
|
|
UV light |
Visible light |
|
|
0.00 % |
0.0025 x C |
0.5166 x C |
|
0.25% |
0.0698 x C2 |
0.0465 x C2 |
|
0.50% |
0.0714 x C2 |
0.0476 x C2 |
The second-order reaction was determined by integrating the rate of reaction to obtain the equation of the reaction, as follows:
By plotting 1/Ct vs. t, we obtain the equation of the line for the second-order reaction (Table 6).
By comparing the values of R2 of the three reaction order (Table 7), the rate of Congo red photo-degradation reaction using catalysts CuOx@SiO2 (CuOx=0.00%, 0.25%, and 0.50%) under UV light and visible light is determined. As the second-order kinetics curve has the highest R2 value than that of zero- and first-order, so the order of the reaction is second-order.
The decreasing trend of the concentration of Congored in the degradation process using CuOx@SiO2 with CuOx=0.00%,0.25% and 0.50%,under UV light and visible light can be seenin Figure 6.
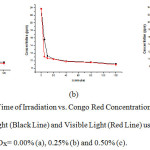 |
Figure 6: The Plot of theTime of Irradiation vs. Congo Red Concentrationafter the Degradationunder UV Light (Black Line) and Visible Light (Red Line) using the Catalysts of CuOx@SiO2 with CuOx= 0.00% (a), 0.25% (b) and 0.50% (c). |
In the UV photodegradation of Congo red undoped SiO2 was more effectively than the other catalysts. But, the CuOx@SiO2 performs conversely, and the CuOx@SiO2 with CuOx=0.50% indicates the most effective catalysis compare to the rest of catalysts. This is a consequence of the undoped SiO2 having a band gap energy that only works under UV light, while CuOx@SiO2 works on both UV and visible light. The CuOx is probably blocked and hence reduces the catalytic ability of the catalysts.
The photocatalytic reaction takes place in a heterogeneous system and the reaction rate is affected by the absorbance of the reactants on the surface of the catalyst. The reaction rate can be formulated as:
![]()
The reaction rate equation can be simplified into second-order kinetics as follows:
![]()
Where kobs is the total reaction rate constant (min-1), K is the adsorption constant of the reactant and C is the concentration of the reactant at any time. The kinetic constant kobs is the rate constant of the reaction which does not take into account the role of adsorption, so that when the adsorption process becomes the part affecting the photo-degradation reaction it is necessary to determine the actual reaction rate constant (k) that has corrected the kobs with the adsorption constant (K) where kobs=kKL.
Kinetics parameters kobs were determined by plotting 1/Ct vs. T followed by the calculation based on the second-order reaction. The reaction rate constant (k) is determined based on the kobs, and the results can be seen in Table 4.
Table 4 shows that for the CuOx@SiO2 with CuOx=0.00% catalyst the magnitude of the reaction rates of Congo red photo-degradation under UV and visible light are relatively similar. However, for the CuOx@SiO2 with CuOx=0.25%, and 0.50% the reaction rates are significantly difference. The photo-degradation rate constant invisible light has a greater value than that of UV light. This is meant that the CuOx@SiO2 effectively working under visible light. The rate of reaction is determined using equation as follows:
![]()
Where r is the photo-degradation reaction rate, k is the photo-degradation rate constant, C is the initial concentration of Congo red, and n is the photo-degradation reaction order. The reaction rate of Congo red photo-degradation is listed in Table 5.
Conclusion
The CuOx@SiO2 photocatalysts have been prepared by an impregnation method. The doped CuOx may be recognized by means of the larger lattice parameters of the CuOx@SiO2 with the increase of doped copper. Optical absorption studies clearly identified the visible light response with the existence of copper. A higher photocatalytic activity for the Cu0x@SiO2 sample compared to pure SiO2.
Acknowledgments
The authors would like to thank the Yogyakarta State University, Indonesia for supporting the research grant, under contract No. SP DIPA-042.01.2.400904/2017.
References
- Saheed, H., Text Outlook Int., 2012, 70–109.
- Henky, S.H., World J. Bus. Manag., 2015, 1, 42.
CrossRef - Chongbo, W., Labour Manag. Dev. J., 2007, 7, 1–14.
- Zille, A.; Oliveira F.R.; Souto, A.P., Plasma Process. Polym., 2015, 12, 98–131.
CrossRef - Raman, C.D.; Kanmani, S., Journal of Environmental Management, 2016, 177, 341–355.
CrossRef - Chan, S.H.S.; Wu, T.Y.; Juan, J.C.; Teh, C.Y., Journal of Chemical Technology and Biotechnology, 2011, 86, 1130–1158.
CrossRef - Saravanan,R.; Karthikeyan, S.; Gupta, V.K.; Sekaran, G.; Narayanan,V.; Stephen, A., Mater. Sci. Eng. C., 2013, 33, 91–98.
CrossRef - Bartl, A., Waste, 2011,167–179.
- Pelizzetti, E.; Minero, C., Electrochim. Acta, 1993, 38, 47–55.
CrossRef - Smidt, E.P.; Lechner, Thermochim. Acta., 2005, 438, 22–28.
CrossRef - Fischer, C.; Karius,V; Thiel,V., J. Sediment. Res., 2007, 77, 355–365.
CrossRef - Li, Q.; Zhang, N.; Yang, Y; Wang,G.; Ng, D.H.L., Langmuir, 2014, 30, 8965–8972.
CrossRef - Wang, C.C.; Li, J.R.; Lv, X.L.; Zhang, Y.Q.; Guo, G., Energy Environ. Sci., 2014, 7, 2831–2867.
CrossRef - Dong, G.; Ai, Z.; Zhang, L., RSC Adv., 2014, 4, 5553.
- Longo, A.; Liotta, L.F.; Carlo, G.D.; Giannici, F.; Venezia, A.M.; Martorana, A., Chem. Mater., 2010, 22, 3952–3960.
CrossRef - Pacchioni, G., Phys. Chem. Chem. Phys., 2013, 15, 1737.
CrossRef - Gomes, J.R.B.; Illas, F.; Silvi, B., Chem. Phys. Lett., 2004, 388, 132–138.
CrossRef - Niu, X.; Zhao, T.; Yuan, F.; Zhu, Y., Sci. Rep., 2015, 5, 9153.
CrossRef - Samad, A.; Furukawa, M.; Katsumata, H.; Suzuki,T.; Kaneco, S., J. Photochem.Photobiol. A Chem., 2016, 325, 97–103.
CrossRef - Batista, A.P.L.; Carvalho, H.W.P.; Luz, H.P.G.; Martins, P.F.Q.; Goncalves, M.; Oliveira, L.C.A., Environ. Chem. Lett., 2010, 8, 63–67.
CrossRef - Monshi, A.; Foroughi, M.R.; Monshi, M.R., World J. NanoSci. Eng., 2012, 2, 154.
- Auffan, M.; Rose, M.; Bottero, J.; Lowry, J.Y.; Jolivet, G.V.; Wiesner, J.P.; Mark, R., Nat. Nanotechnol., 2009, 4, 634–641.
CrossRef - Agrafiotis,C.; Tsetsekou, A., J. Eur.Ceram. Soc., 2002, 22, 423–434.
CrossRef
CrossRef

This work is licensed under a Creative Commons Attribution 4.0 International License.
![]()
A New Edition of Web of Science
Journal Impact Factor
2022: 0.5
Five Year: 0.8
Journal is Indexed in

Cabells Whitelist
![]()


