Temperature Dependent Synthesis of Zinc Sulfide Nanocrystal
 , Satyajit Saha and Paresh Chandra Jana
Department of Physics and Technophysics, Vidyasagar University, Paschim Medinipur, 721102, India.
Corresponding Author E-mail: kamal.phy87@gmail.com
DOI : http://dx.doi.org/10.13005/ojc/340363
Download this article as:
![]()
Chemical reduction route is preferred to prepare ZnS semiconductor nanoparticles at three different temperatures without any subsequent heat treatment. The grown nanoparticles are investigated using X-ray diffraction (XRD), Transmission electron microscopy (TEM), Scanning electron microscopy (SEM), Fourier Transform Infrared (FTIR) Spectroscopy, Ultraviolet-visible (UV-VIS) Absorption and Photoluminescence (PL) spectroscopy for structural and optical analysis. From the investigation, it is seen that the crystal size appears to increase with an increase in synthesis temperature. The cubic crystal structure is shown in XRD analysis. The UV-VIS spectrum shows the increase in the band gap, supports quantum confinement effect. The PL spectrum of ZnS nanocrystals displays a visible violet spectrum. The FTIR spectra determine the absorbance and nature of bonds present in samples.
KEYWORDS:Optical Properties; Structural Properties; Temperature Effect; ZnS Nanomaterials
Introduction
In the modern age of science, semiconductor nanostructure material has gained much popularity due to their novel optical and electrical properties, which is arising from quantum confinement effects.1-3 As one of the most important II-IV semiconductors, ZnS has found in many applications like fluorescence probe,4 phosphors,5-6 pharmaceutics,7-8 Light Emitting Diode (LED),9 electroluminescence,10 and non-linear optical devices.11
Synthesis temperature has an important role in controlling particle shape and size.12 As the growth of particle are affected by the kinetics and thermodynamics of the process. Temperature can influence the particle growth mechanism i.e., Ostwald ripening process through interfacial energy, diffusion and growth rate coefficients, and equilibrium solubility.13
However, its properties are critically dependent on synthesis technique. There are various synthesis method ZnS nanocrystals, such as the single source molecular precursor14, solvothermal synthesis,15-16 sputtering,17 ultrasonic irradiation18 and soon.
Our aim is to explore the possible temperature effect on the morphological, structural and optical characteristic of ZnS nanostructure synthesized by chemical reduction route.19
Materials and Methods
For the synthesis of ZnS nanoparticle analytical grade reagents were used without any further purification. Anhydrous ZnCl2 (1362.8mg), Sulfur powder (320.6 mg) and NaBH4 (378.3mg) were taken to grow different samples. The reaction bath temperatures were kept at 380C, 500C and 600C respectively to grow various sample. The grown sample was named as ZnS 1, ZnS 2, ZnS 3 respectively. NaBH4 worked as a reducing agent. The whole reaction was held on a magnetic stirrer, stirring at a fixed speed for three hours. The as grown sample filtered, washed and dried for microstructural and optical study. The TEM micrographs of as grown nano sample were produced using JEOL-JEM-200 operating at 200kV. Also, SAED pattern were taken. The surface topography and composition was acquired using ZESIS Gemini2 FESEM instrument.
The Rigaku MiniFlex-II X-ray diffractometer was used in XRD measurement. The absorption measurement performed in Shimadzu-Pharmaspec-1700 UV-VIS. The Hitachi-F7000-FL spectrophotometer measures the photoluminescence spectra. With the help of Perkin Elmer Spectrum Two IR Spectrometer FTIR analysis was done.
Results and Discussions
Morphological Observation
The TEM, SAED and SEM images are shown in figures 1-3 of each sample synthesized at 380C, 500C and 600C respectively. Images evidently indicate the nanoparticles formation. It shows as temperature increases crystal size also increase. This is enhanced due to Ostwald ripening process taking place at a higher temperature. As the rate of reduction of sulfur increases with temperature the number of nucleation centers increases at higher temperature.
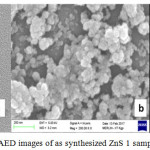 |
Figure 1a: TEM, (b) SEM (c) SAED images of as synthesized ZnS 1 sample |
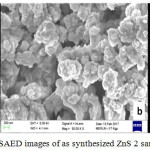 |
Figure 2a: TEM, (b) SEM (c) SAED images of as synthesized ZnS 2 sample |
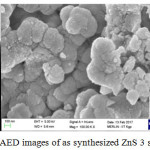 |
Figure 3a: TEM, (b) SEM (c) SAED images of as synthesized ZnS 3 sample Click here to View figure |
From the SAED patterns, it is seen that at 380C growth temperature the sample is likely to be in the single crystalline structure. The polycrystalline structure is evident at higher synthesis temperature.
Figures 1b, 2b, 3b shows the SEM micrographs of synthesized ZnS nanoparticles with spherical shaped. It is evident that crystal size increases with growth temperature. Sample grown at 380C temperature shows small sized crystal. With increase of growth temperature particles get agglomerated and plate-shaped large clusters form.
X- Ray Diffraction Measurements
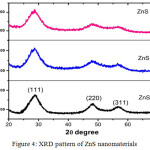 |
Figure 4: XRD pattern of ZnS nanomaterials |
XRD peaks corresponds to (111), (220), (311) plane matched cubic zinc blende structure (JCPDS No. 05-0566), confirme pure ZnS nanocrystal. With the increase of growth temperature, the intensity corresponding to (220) and (311) plane is reduced.
UV-Visible Measurements
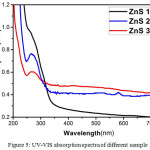 |
Figure 5: UV-VIS absorption spectra of different sample |
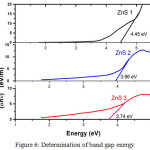 |
Figure 6: Determination of band gap energy Click here to View figure |
Figure 5 shows the UV-VIS absorption plot of as-synthesized samples in the wavelength range 200-700 nm at room temperature. The band gap value was estimated from Tauc plot (figure 6). The values of calculated band gap are about 3.74 eV, 3.96 eV, and 4.45 eV which are comparable to the standard energy band gap of ZnS i.e., 3.68 eV. It is observed that energy band gap decreases with increasing temperature. This supports the increment in crystal size with temperature and also confirms the temperature plays an important in the optical properties of synthesized ZnS nanocrystals.
Fluorescence Measurements
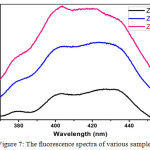 |
Figure 7: The fluorescence spectra of various samples Click here to View figure |
Figure 7 shows the photoluminescence spectrum of as-synthesized ZnS nanoparticles to investigate luminescence properties. The PL intensity increases with increase in growth temperature. This is due to increase in particle size.20 There is also peak broadening for all sample. This is due to non-uniform particle distribution and it increases with growth temperature.
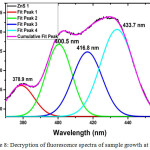 |
Figure 8: Decryption of fluorescence spectra of sample growth at 380C. |
By decryption of fluorescence spectra of sample growth at 380C temperature (figure 8) we get an accurate position of fluorescence peak at 378.9, 400.5, 416.8, 433.7 nm. The peak at 378.9 nm is due to band edge luminescence. Peaks at 400.5, 416.8 and 433.7 nm are due to surface state arising from vacancies and interstitials of sulfur and zinc atom.21
Fourier Transforms Infrared Spectroscopy (FTIR) Measurement
The FTIR spectra are carried out to analyze the composition and quality of the compound in the range 4000 – 500 cm-1, shown in figure 9. The FTIR spectra of three ZnS sample show that the transmission bands are almost similar to each other. Only some extra dips occur in the case of higher temperature.
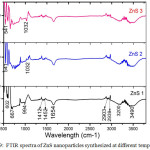 |
Figure 9: FTIR spectra of ZnS nanoparticles synthesized at different temperature. |
The dips observed at 602 and 667 cm-1 are due to characteristic Zn-S vibration.22 Dips at 1412 and 1442 are probably due to the microstructure formation of the samples.23 Dips around 1654 nm are due to the C – O vibrational modes arise from absorbed CO2 on the surface of the nanocrystals.24 Dips at 2903and 2939 are due to CH2 and CH3 vibrational mode.25 The band around 3160-3226, 3420-3550 cm-1 are due to the hydrogen Stretching frequency (OH stretching) of the hydroxyl group.
Table 1: Comparison of different sample
|
Sample Name |
Growth Temperature ( 0 C ) |
Band gap (eV) |
Particle size (TEM) |
Atomic % EDS analysis |
|
ZnS 1 |
38 |
4.45 |
15 nm |
Zn= 33.24 S= 66.76 |
|
ZnS 2 |
50 |
3.96 |
40 nm |
Zn= 45.6 S= 54.4 |
|
ZnS 3 |
60 |
3.74 |
50 nm |
Zn= 57.56 S= 42.44 |
Conclusions
The temperature effects on structural, optical and chemical characteristics of ZnS nanocrystals are investigated and summarized in table 1. The XRD analysis shows cubic phase in all samples. The TEM images suggest that crystal size increases with growth temperature. With increasing growth temperature the formation of nuclei are increased and by Ostwald ripening method the crystal size also increase. The energy gap of band decreases at higher growth temperature. It is observed that from SEM images that the agglomeration is prominent at higher growth temperature. Fluorescence intensity increases for the sample grown at higher temperature. This is probably owing to the excess of a constituent ion such as Zinc with respect to Sulphur.
Acknowledgments
Authors acknowledge UGC and DST for constant support to Physics and Techno-physics department through SAP and FIST program.
References
- Takagahara, T; Takeda, K. Physical Review B. 1992 , 46, 15578.
CrossRef - Alivisatos, A. P. Science. 1996, 271, 933.
CrossRef - Buhro, W.E. ; Colvin, V.L. Nature materials, 2003,2, 138-139.
CrossRef - Li, Y.; Chen, J.; Zhu, C.; Wang, L.; Zhao, D.; Zhuo, S.; Wu, Y, Spectrochimica Acta Part A: Molecular and Biomolecular Spectroscopy, 2004 60, 1719-1724.
CrossRef - Okuda, H.; Takada, J.; Iwasaki, Y.; Hashimoto, N. ; Nagao, C., IEEE Transactions on Consumer Electronics, 1990, 36, 436-443.
CrossRef - Ghrayeb, J.; Jackson, T.W.; Daniels, R.; Hopper, D.G.In AeroSense’97 , 1997 , 237-248. International Society for Optics and Photonics.
- Pathakoti, K.; Hwang, H.M.; Xu, H.; Aguilar, Z.P. ; Wang, A. Journal of Environmental Sciences, 2013, 25, 163-171.
CrossRef - Kim, H.; Han, J.Y.; Kang, D.S.; Kim, S.W.; Jang, D.S.; Suh, M.; Kirakosyan, A.; Jeon, D.Y. Journal of Crystal Growth, 2011, 326, 90-93.
CrossRef - Xuan, R.-W; Xu, J.-P.; Zhang, X.-S.; Li, P.; Luo, C.-Y.; Wu, Y.-Y.; Li, L. Appl. Phys. Lett. 2011, 98, 041907.
CrossRef - Xu, J. ; Ji, W. Journal of materials science letters, 1999, 18, 115-117.
CrossRef - Mott, D.; Galkowski, J.; Wang, L.; Luo, J.; Zhong, C.J. Langmuir, 2007, 23, 5740-5745.
CrossRef - Madras, G.; McCoy, B.J. The Journal of chemical physics, 2003, 119, 1683-1693.
CrossRef - Barrelet, C.J.; Wu, Y.; Bell, D.C. ; Lieber, C.M. Journal of the American Chemical Society, 2003, 125, 11498-11499.
CrossRef - Ashwini, K. ; Pandurangappa, C. Optical Materials, 2014, 37, 537-542.
CrossRef - Dong, L.; Chu, Y.; Zhang, Y. Materials Letters, 2007, 61, 4651-4654.
CrossRef - Hwang, D.H.; Ahn, J.H.; Hui, K.N.; San Hui, K. ; Son, Y.G. Nanoscale research letters, 2012, 7, 26.
CrossRef - Xu, J.F.; Ji, W.; Lin, J.Y.; Tang, S.H. ; Du, Y.W. Applied Physics A: Materials Science & Processing, 1998, 66, 639-641.
CrossRef - Wang, W.; Germanenko, I. ; El-Shall, M.S. Chemistry of Materials, 2002, 14, 3028-3033.
CrossRef - Xiong, G.; Pal, U. ; Serrano, J.G. Journal of applied physics, 2007, 101, 024317.
CrossRef - Denzler, D.; Olschewski, M. ; Sattler, K. Journal of applied physics, 1998, 84, 2841-2845.
CrossRef - Thangam, Y.Y.; Anitha, R. ; Kavitha, B. International Journal of Applied Science and Engineering Research, 2012, 1, 282-286.
- Ummartyotin, S.; Bunnak, N.; Juntaro, J.; Sain, M. ; Manuspiya, H. Solid State Sciences, 2012, 14, 299-304.
CrossRef - Qadri, S.B.; Skelton, E.F.; Hsu, D.; Dinsmore, A.D.; Yang, J.; Gray, H.F. ; Ratna, B.R. Physical Review B, 1999, 60, 9191.
CrossRef - Kumar, P.; Maikap, S.; Singh, K.; Chatterjee, S.; Chen, Y. Y.; Cheng, H. M.; Mahapatra, R. ; Jian-Tai Qiu, J.T.; Yang, J. R. Journal of The Electrochemical Society, 2016, 163, B580-B587.
CrossRef - Gómez-Barojas,E. ; Sánchez-Mora,E.; Castillo-Abriz, C.; Flores-Rodríguez,E. ; Silva-González,R. Journal of superconductivity and novel magnetism, 2013, 26, 2337-2340.
CrossRef
Accepted on: June 01, 2018


![]()


