Synthesis, Spectroscopic, Intramolecular Energy Transfer and Electronic Structure Nonlinear Optical Properties of Novel Tetrahydropyrimidinone
 and Subramaniyan Subashchandrabose3
1Department of Chemistry, Government Arts College, C-Mutlur, Chidambaram 608102, Tamil Nadu, India
2Department of Chemistry, CK College of Engineering and Technology, Cuddalore 600 003, Tamil Nadu, India
3Centre for Functionalized Magnetic Materials (FunMagMa), Immanuel Kant Baltic Federal University 236041, Kaliningrad, Russia.
DOI : http://dx.doi.org/10.13005/ojc/340304
Download this article as:
![]()
New oxygen bridged tricyclic pyrimidinone molecule is synthesized by Biginelli condensation reaction using CeCl3.7H2O as an efficient catalyst. The new molecular structural arrangement of unusual product of Biginelli reaction is analysed using experimental and theoretical techniques. The extent of intermolecular charge transfer and delocalization are estimated and discussed in terms of natural bond orbitals. The optimized geometry reveals the intramolecular hydrogen bonding exists in the studied compound and it is confirmed using NBO analysis. The shifts in vibrational wavenumber due to the hydrogen bondings are curiously analysed with potential energy distributions of vibrations. To scrutinize the nonlinear optical properties of the title molecule first order hyperpolarizability components are calculated and its shows the title molecule is promising candidate for NLO studies. In addition, the active charge sites and energy gap are also identified and discussed.
KEYWORDS:Donor-Acceptor Interactions; Hydrogen-Bonding’s; MEP; NLO; THPC
Introduction Dihydropyrimidinones (DHPM) and their derivatives have gained greater attention in synthetic and material chemistry, because of their wide range of pharmacological and optical activities1,2. Recently, strong photo physical and electrochemical active materials were reported with a series of pyrimidine-carbazole conjugates3. Pyridine-5-carboxylic acid was used as an anchoring group in solar cells with an efficiency of 5.5%4. Interestingly the organic molecules with donor and acceptor groups connected with π-conjugation have shown wide range of field effect transistor, organic light emitting diodes (OLED), dye-sensitized solar cells (DSSCs) and nonlinear optics5-8. In recent years, the direct conversion of solar energy has gained more attention in terms of low cost and higher efficiency in DSSC9. Biginelli compounds contained multiple functional groups where a significant conformational flexibility was found between the aryl and the ester moiety. Dihydropyrimidinones and its corresponding derivatives acted as vital hetero cyclic entities that possess diverse pharmacological and therapeutic properties, such as anti-inflammatory, anti-viral, anti-microbial and anti-tumour activities10. Moreover these compounds had emerged as α-adreno receptor antagonists, calcium channel blockers and anti-hypertensive agents11. Due to our interest in the Biginelli reaction, in the current manuscript, we intend to evaluate the molecular structural arrangement, shifting in wavenumbers, energy transfer occurring intramolecular level and nonlinear optical investigation for the newly synthesized oxygen bridged Biginelli compound with theoretical predictions. We intend this manuscript to be very useful for the optical investigations of unexpected product of the Biginelli condensation. The new structural arrangement of ethyl-2-(chloromethyl)-9-methoxy-4-oxo-3,4,5,6-tetrahydro-2H-2,6-methanobenzo[g][1,3,5]oxadiazocine-11-carboxylate (THPC) has been studied experimentally as well as with theoretical calculations. In addition, the vertical excitations in electronic states and identification of active sites in novel THPC also carried out. Experimental Synthesis of Novel Oxygen Bridged Tetrahydropyrimidinone (THPC) Ethanolic solution of urea (0.9 g) and 4-methoxysalicylaldehyde (0.76 g) is mixed to ethyl-4-chloroacetoacetate (0.82 ml). To this homogenous mixture 0.465 g of Cecl3.7H2O is added gradually and stirred continuously. The reaction mixture is further refluxed in a round bottomed flask at 90°C for the time period of 4Hrs. After the completion of reaction, the crude product is poured onto the beaker containing crushed ice and stirred for 10-15 min to get the solid product. The crude sample is washed well with cold water and recrystallized using absolute ethanol. The reaction scheme of novel THPC is shown in the Scheme-1.
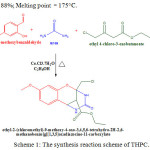 |
Scheme 1: The synthesis reaction scheme of THPC. |
Spectral identification 1H-NMR (300 MHz, DMSOD6): δ = 7.78 (s, 1H, NH), 7.40-7.42 (s, 1H, NH), 6.43-7.13 (m, 3H, ArC-H), 4.45 (s, 1H, CH), 4.32-4.36 (d, 1H, CH) 4.14-4.25 (q, 2H, CH2), 3.93-3.97 (d, 2H, CH2Cl), 3.71 (s, 3H, OCH3), 1.21-1.26 (t, 3H, CH3). 13C NMR (75 MHz, DMSO-D6) δ = 167.8, 160.3, 154.1, 151.1, 129.4, 117.2, 108.0, 101.3, 84.1, 60.9, 55.2, 47.0, 46.2, 41.1, 13.9. FT-IR (KBr pellet) cm−1 = 3205, 3072, 1739, 1687, 1619, 1501, 1204, 1156, 1029, 784. FT-Raman (KBr) cm−1 = 3203, 3084, 3002, 1703, 1672, 1453, 1236, 1015, 773. Characterization techniques The infrared spectrum of THPC in the range of 4000-400 cm-1 was recorded with the device of Shimadzu FT-IR spectrophotometer (resolution of 4 cm-1). The FT-Raman spectrum in the spectral range of 3500-50 cm–1 was recorded using Bruker RFS27 spectrometer operating at 100mW laser. The NMR (1H & 13C) spectra of THPC were recorded using Bruker 300 MHz spectrometer. Quantum calculation details The ground state geometry of THPC has been simulated by using B3LYP hybrid functional level with 6-311++G(d,p) basis set. The entire quantum chemical calculations were performed with Gaussian 03 software12. The initial structural parameters of THPC were minimized in potential surface scan. The harmonic wavenumbers were calculated for the energy minimum structure and the wavenumbers were properly scaled by 0.96. The vibration bands were precisely assigned based on the percentage contributions of potential energy distributions13. The calculated Raman activities were transformed into intensity using Raint Program14,15. Results and Discussion Structural Analysis The preliminary search for the stable conformer of THPC is identified from the scanned points of potential energy surface. The dihedral angles D1(C5–C4–O34–C35), D2(C3–C4–034–C35), D3(C14–C11–C20–O28) and D4(C11–C20–O28–C21) are the internal redundant coordinates used for the free rotation of the molecule. While processing the PES scan, the structural parameters are relaxed such as D1, D2, D3 and D4 torsional angles are raised from 0º to 360º rotations with 10º intervals at each step. The potential energy surface scan curves of four dihedrals of THPC are presented in Fig 1. The various conformers of THPC and its energies are presented in Table 1. The dihedral angles D1and D2 are scanned using the torsional barrier of the methoxy side chain around the bond C4–O34. Dihedral angle D3 and D4 are scanned using the torsional barrier of the exocyclic ester ring around the bonds, C11–C20 and C20–O28, by varying the torsional perturbation. From Fig. 1, it is clearly shown that numerous similar structures have been identified with different geometries and minimum energy conformers of the four scans are handier to one another. From the PES result, four minimum energy conformer have been obtained at 180º with relative energy of -1527.70801 Hartree for C5–C4–O34–C35 and C3–C4–O34–C35, 170º with relative energy of -1527.70953 Hartree for C14–C11–C20–O28, 180º with relative energy of -1527.70951 Hartree for C11–C20–O28–C21. Finally, the minimum energy conformer is identified in the internal rotation of D3(C14–C11–C20–O28) with relative energy of -1527.70953 Hartree, yielded more stable conformer and is used for further investigation. The optimized structure of THPC with intramolecular hydrogen bonding is shown in Fig 2. Table 1: The energies of various possible conformers of THPC.
|
Rotation ( ˚) |
C5-C4-O34-C35 |
C3-C4-O34-C35 |
C14-C11-C20-O28 |
C11-C20-O28-C21 |
|
0 |
-1527.707453 |
-1527.707453 |
-1527.707098 |
-1527.69209 |
|
10 |
-1527.707214 |
-1527.707214 |
-1527.70681 |
-1527.692397 |
|
20 |
-1527.706587 |
-1527.706587 |
-1527.706373 |
-1527.692394 |
|
30 |
-1527.705632 |
-1527.705632 |
-1527.705796 |
-1527.692051 |
|
40 |
-1527.704534 |
-1527.704534 |
-1527.705204 |
-1527.691317 |
|
50 |
-1527.703525 |
-1527.703525 |
-1527.7048 |
-1527.690241 |
|
60 |
-1527.702847 |
-1527.702847 |
-1527.704733 |
-1527.688994 |
|
70 |
-1527.702489 |
-1527.702489 |
-1527.704996 |
-1527.687934 |
|
80 |
-1527.702283 |
-1527.702283 |
-1527.705612 |
-1527.687498 |
|
90 |
-1527.702212 |
-1527.702212 |
-1527.706504 |
-1527.687955 |
|
100 |
-1527.702298 |
-1527.702298 |
-1527.707459 |
-1527.689394 |
|
110 |
-1527.702522 |
-1527.702522 |
-1527.708275 |
-1527.69179 |
|
120 |
-1527.702917 |
-1527.702917 |
-1527.708835 |
-1527.694891 |
|
130 |
-1527.703613 |
-1527.703613 |
-1527.709107 |
-1527.698384 |
|
140 |
-1527.704707 |
-1527.704707 |
-1527.70923 |
-1527.701987 |
|
150 |
-1527.705959 |
-1527.705959 |
-1527.709396 |
-1527.705217 |
|
160 |
-1527.707037 |
-1527.707037 |
-1527.709524 |
-1527.707767 |
|
170 |
-1527.707756 |
-1527.707756 |
-1527.709531 (min) |
-1527.709193 |
|
180 |
-1527.708005 |
-1527.708005 |
-1527.709247 |
-1527.70951 |
|
190 |
-1527.707745 |
-1527.707745 |
-1527.708562 |
-1527.708799 |
|
200 |
-1527.707028 |
-1527.707028 |
-1527.707728 |
-1527.707014 |
|
210 |
-1527.70596 |
-1527.70596 |
-1527.706825 |
-1527.704378 |
|
220 |
-1527.704725 |
-1527.704725 |
-1527.706103 |
-1527.701145 |
|
230 |
-1527.703653 |
-1527.703653 |
-1527.705716 |
-1527.697637 |
|
240 |
-1527.702989 |
-1527.702989 |
-1527.705563 |
-1527.693976 |
|
250 |
-1527.70262 |
-1527.70262 |
-1527.705708 |
-1527.690292 |
|
260 |
-1527.702424 |
-1527.702424 |
-1527.706225 |
-1527.686897 |
|
270 |
-1527.702382 |
-1527.702382 |
-1527.70681 |
-1527.684095 |
|
280 |
-1527.702493 |
-1527.702493 |
-1527.707461 |
-1527.682631 |
|
290 |
-1527.702735 |
-1527.702735 |
-1527.707904 |
-1527.682208 |
|
300 |
-1527.703117 |
-1527.703117 |
-1527.707999 |
-1527.682131 |
|
310 |
-1527.7038 |
-1527.7038 |
-1527.707809 |
-1527.682171 |
|
320 |
-1527.704796 |
-1527.704796 |
-1527.707513 |
-1527.682233 |
|
330 |
-1527.705851 |
-1527.705851 |
-1527.707351 |
-1527.682273 |
|
340 |
-1527.706725 |
-1527.706725 |
-1527.707273 |
-1527.682465 |
|
350 |
-1527.707283 |
-1527.707283 |
-1527.707192 |
-1527.682653 |
|
360 |
-1527.707453 |
-1527.707453 |
-1527.707097 |
-1527.682824 |
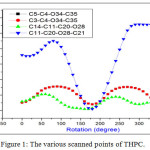 |
Figure 1: The various scanned points of THPC. |
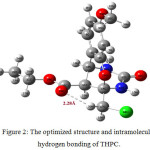 |
Figure 2: The optimized structure and intramolecular hydrogen bonding of THPC. |
Identification of Intramolecular Hydrogen Bond The existence of hydrogen bondings in a molecule have shown pronounced effects on molecular structural properties16. In this investigation, the intramolecular hydrogen bonding is found between the carbonyl oxygen of the ester group with the chlorine attached methylene group. The shorter distance of 2.28 Å, is calculated for the C=O∙∙∙H−C intramolecular hydrogen bond exist in THPC. The 2.28 Å distance is noticeably lesser than the 2.72 Å Van der Waals radii of the hydrogen and oxygen atoms17. From the structural conformation, it is found that the bond length of C17−H39 (1.083 Å) is shorten then the C17−H18 (1.9 Å) bond length, which is owing to moderate hydrogen bonding C−H∙∙∙O and re-hybridization occurs it. For the strengthening of C−H in hydrogen bonding, the stretching wavenumber get increases and bending wavenumber decreases. Normally, the C−H aliphatic stretching vibrations are absorbed below 3000 cm-1. In this case of hydrogen bonding, the C17−H39 and C17−H18 asymmetric stretching vibration is blue shifted and computed at 3116 cm-1. In addition the strength of the intramolecular hydrogen bond is identified by donor-acceptor interactions. From NBO results, the charge transfer interaction from (LP)O29→σ*(C17−H39) leads the moderate stabilization of 1.56 kcal/mol. The weak hydrogen bonding energy of charge transfer between the elements lies in the range between 0-4 kcal/mol, but can sometimes be rise up to 40 kcal/mol. The ED value of the C17−H39 is found as 0.0184e, which is comparably less than other C−H bonds of the THPC molecular system. These results strongly assure the formation of hydrogen bonding in THPC at intramolecular level with the distance of 2.28 Å. Vibrational Spectral Assignments The THPC has 40 atoms and fits to C1 point group symmetry, which gives rise 114 normal modes of vibration. The scaled wavenumbers have been studied from Potential Energy Distributions (PED). The Fourier Transformed experimental and theoretical (IR & RAMAN) vibrational spectra of THPC are shown in Fig. 3. The NMR (1H & 13C) spectra of THPC are shown in Fig. 4. The experimental and calculated wavenumbers with detailed PED assignments are presented in Table S1. To overcome the discrepancies between experimental and theoretical wavenumber, the proper scale factor has used to scale down the theoretical wavenumbers suggested by Computational Chemistry Comparison in Benchmark Database18. N–H and C–N Vibrations Aromatic N-H stretching wavenumbers normally occur in the 3500-3300 cm–1 spectral region19. The strong vibrational band observed at 3205 cm-1 in FT-IR and a weak band at 3203 cm-1 in FT-Raman is attributed to N−H stretching vibration. The harmonic wavenumber at 3488 and 3482 cm−1 are assigned for N30H13 and N31H15 bonds. Due to the hydrogen bonding interaction the experimental wavenumber is observed in lower wavenumber region in the solid state and is not observed in the isolated molecule. The 97% of the PED contribution of N–H vibration shows, these are pure mode of vibration. The chemical shifts δH at 7.421 and 7.789 ppm in downfield region of the proton NMR have assigned for the deshielded N−H protons of the pyrimidine ring. Silverstein assigned the stretching C−N vibrations in the vibrational region of 1382-1266 cm-1 20. The results are very intricate to identify the C–N vibration, the band observed at 1374 cm-1 in FT-IR and theoretical wavenumber at 1364 cm-1 are assigned to βCNH vibration. The νC-N vibrations are computed at 1409 and 1400 cm–1 from B3LYP method. C=O and C-O vibrations Normally the C=O bonds have an intense peaks in the region 1800-1600 cm-1 21. The νC=O vibrations are mainly based on the bond strength, which depends on the conjugative, steric effect and lone pair electron present in it 22. The peaks obtain which are at 1739 cm-1 in IR and 1703 cm-1 in Raman have been recognized vibrations of carbonyl group of the dihydropyrimidine with 100% IR intensity. Similarly the bands appears at 1687 cm-1 in IR and at 1672 cm-1 in Raman corresponds for the ester group carbonyl vibration. Their corresponding harmonic wavenumbers are 1755 and 1742 cm−1. The signals observe at 167.84 and 160.30 ppm in 13C-NMR confirms the carbonyl carbons of THPC. The C–O vibrations are affected by the surrounding molecular interactions and are observed between 1260–1000 cm-1 23. The C−O vibrations observed at 1274, 1236, 1015 cm-1 in FT-Raman and strong peak at 1029 cm-1 in Infrared spectrum. The calculated wavenumbers at 1269, 1244, 1032 and 1019 cm-1 represents the C−O vibrations of methoxy and carboxylate group. In 13C-NMR, the signal appeared at 84.10 ppm is assigned to sp3 C14 atom provides substantial evidence of tricyclic ring formation of THPC from the intramolecular conjugate addition of the phenolic hydroxyl to C2−O16−C14 of the dihydropyrimidine ring. The δH at 4.323-4.362 ppm attributed to the proton bonded with C11 atom which also confirms the oxygen bridged tricyclic ring exist in the title molecule.
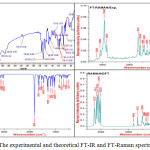 |
Figure 3: The experimental and theoretical FT-IR and FT-Raman spectra of THPC. |
Aromatic ring vibrations The νC–H vibrations in aromatic ring exhibit bands usually in the spectral range of 3100–3000 cm-1 24. In THPC, there are three C−H bonds namely C3−H7, C5−H8 and C6−H9. The νC−H vibrations of THPC observed at 3072 cm−1 in IR and at 3084 cm−1 in Raman as strong bands. These vibrations are theoretically computed at 3117, 3099 and 3055 cm−1 with PED contribution of >97%. The two doublets and one singlet observed at 6.56, 6.54 and 6.44 ppm are the corresponding aromatic proton signals in 1H-NMR spectrum. The in-plane bending vibrations of C−H normally observed between 1300–1000 cm-1 25. The DFT wavenumber at 1109 and 1075 cm−1 are corresponds to in-plane bending vibration of aromatic C−H. Similarly, the out-of-plane bending C−H vibrations occur in the region 1000-750cm−1 as coupled vibrations26. The weak band at 821 cm-1 in Raman spectrum is the corresponding band of out-of-plane C−H bending of THPC. The calculated wavenumber at 915, 820 and 794 cm−1 are also assigned relatively with 80% of PED contribution. The νC=C vibrations of phenyl ring usually observed in the spectral region of 1625-1430 cm−1 27. In this investigation, sharp bands at 1619, 1501 cm-1 in IR and 1600, 1491cm−1 in Raman bands represents νC=C vibrations of phenyl ring. These vibration modes are calculated at 1609, 1569 and 1490 cm−1 from the DFT method. In 13C-NMR spectrum the signals observed at 101.37-129.40 ppm are the responsible carbon signals of phenyl ring. C−H Vibrations The νC−H (as) vibrations of methyl group is appeared in the spectral region 3010-2940 cm−1 and νC−H (s) stretching vibrations in the spectral range of 2970-2840 cm−1 28. In THPC, there are two methyl groups one at methoxy and another one at ethyl group of the acetate chain. The wavenumber observed at 2930 cm-1 in Raman spectrum and at 2924 cm-1 in IR spectrum are allocated to symmetric stretching C–H bands of the methyl groups present in methoxy and ethyl side chains. The asymmetric vibrations of methyl moities are identified at 3014 and 2966 cm−1. The vibrations of symmetric νC−H stretching are identified at 2942 and 2905 cm-1 with ˃90% of PED. In 13C-NMR spectrum, the carbon signals appeared at 55.21 and 13.90 ppm are corresponding to C13 and C22 methyl groups. Whereas, the singlet and triplet observed at 3.714 and 1.215-1.262 ppm confirms the protons of methoxy and methyl group in ester chain of the THPC.
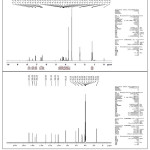 |
Figure 4: The 1H and 13C-NMR spectra of THPC. |
The stretching modes of methylene groups are expected to occur at 2935 and 2865 cm−1, respectively29. The acetate moiety methylene vibrations are calculated at 3000 and 2959 cm-1. The quartet signal observed at 4.143-4.253 ppm is corresponds to the methylene protons. The asymmetric stretching vibrations of chlorine attached CH2 group absorb nearly 3100 cm−1, and symmetric CH2 stretching nearly 2986 cm−1 30. The asymmetric and symmetric wavenumbers of chlorine attached methylene group is calculated at 3116 and 3012 cm−1, respectively. The blue-shifting in the wavenumber indicating the improper intramolecular hydrogen bonding occur in the THPC. The aliphatic C10‒H9 and C11‒H33 vibrations are calculated at 3004 and 2958 cm–1. The sharp band observed at 3002 cm−1 is attributed for the tetrahydropyrimidine aliphatic C‒H vibration of the ring. Vibrations of C−Cl The νC‒X (x=Cl) vibration bands are usually observed in the region of 760-505 cm−1; here the combinations of band are possible due to heavy atom and lowering the molecular symmetry31. The νC−Cl vibration is appeared at 784 cm-1 in FT-IR spectrum and 773 cm-1 in FT-Raman with 83% of PED contribution. The theoretical band at 783 cm−1 well matched with the experimental finding. The chlorine substituted methylene group shown doublet signal at 3.937-3.976 ppm, instead of singlet the splitting is may be due to the improper hydrogen bonding existing in the THPC molecule. The chlorine bonded carbon signal is observed at 47.09 ppm in carbon NMR spectrum. Donor-acceptor interaction analysis The bonding and anti-bonding interactions can be significantly described by natural bond orbitals, which is expressed in terms of the second order perturbation energies (E(2))32-35. These interaction energies represent the estimation of NBO Fock matrix. The E(2) values of donor-acceptor bonds are given in Table 2 and it reveals the various interactions between the donor/acceptor orbitals of THPC. Table 2: The donor-acceptor interactions of THPC.
| Type | Donor | ED/e | Acceptor | ED/e | E(2) | aE(2) | bE(j)−E(i) a.u | cF(i, j) a.u |
| kJ/mol | Kcal/mol | |||||||
| π – π* | C1-C2 | 1.6751 | C1-C2 | 0.4176 | 7.15 | 1.71 | 0.29 | 0.02 |
| π – π* | C1-C2 | C3-C4 | 0.3877 | 60.63 | 14.49 | 0.29 | 0.058 | |
| π – π* | C1-C2 | C5-C6 | 0.3239 | 97.7 | 23.35 | 0.29 | 0.074 | |
| π – σ* | C1-C2 | C10-H19 | 0.0187 | 4.31 | 1.03 | 0.72 | 0.026 | |
| π – σ* | C1-C2 | C10-N30 | 0.0412 | 24.35 | 5.82 | 0.6 | 0.057 | |
| π – π* | C3-C4 | 1.6868 | C1-C2 | 0.4176 | 101.04 | 24.15 | 0.29 | 0.076 |
| C3-C4 | 0.3877 | 4.52 | 1.08 | 0.29 | 0.016 | |||
| C5-C6 | 0.3239 | 62.47 | 14.93 | 0.29 | 0.059 | |||
| π – π* | C5-C6 | 1.7282 | C1-C2 | 0.4176 | 64.48 | 15.41 | 0.28 | 0.061 |
| C3-C4 | 0.3877 | 92.88 | 22.2 | 0.28 | 0.072 | |||
| n – π* | LP(2)O16 | 1.8408 | C1-C2 | 0.4176 | 122.59 | 29.3 | 0.34 | 0.096 |
| C11-C14 | 0.0432 | 13.43 | 3.21 | 0.63 | 0.041 | |||
| C14-N31 | 0.0536 | 42.3 | 10.11 | 0.67 | 0.076 | |||
| n – π* | LP(2)O28 | 1.7846 | C20-O29 | 0.2229 | 212.97 | 50.9 | 0.33 | 0.116 |
| C21-H26 | 0.0188 | 16.78 | 4.01 | 0.78 | 0.053 | |||
| C21-H27 | 0.0191 | 16.57 | 3.96 | 0.78 | 0.052 | |||
| n – σ* | LP(2)O29 | 1.8456 | C11-C20 | 0.0667 | 82.51 | 19.72 | 0.63 | 0.102 |
| C17-H39 | 0.0184 | 6.53 | 1.56 | 0.75 | 0.032 | |||
| C20-O28 | 0.097 | 138.45 | 33.09 | 0.64 | 0.132 | |||
| n – π* | LP(1)N30 | 1.7846 | C1-C2 | 0.4176 | 5.15 | 1.23 | 0.31 | 0.018 |
| C1-C10 | 0.0406 | 34.56 | 8.26 | 0.68 | 0.07 | |||
| C12-O32 | 0.1544 | 45.1 | 10.78 | 0.65 | 0.076 | |||
| C12-O32 | 0.215 | 59.16 | 14.14 | 0.54 | 0.078 | |||
| n – σ* | LP(1)N31 | 1.7526 | C12-O32 | 0.1544 | 40.75 | 9.74 | 0.64 | 0.072 |
| C12-O32 | 0.215 | 70.25 | 16.79 | 0.52 | 0.084 | |||
| C14-O16 | 0.0881 | 78.32 | 18.72 | 0.51 | 0.091 | |||
| C14-C17 | 0.0402 | 9.04 | 2.16 | 0.59 | 0.034 | |||
| n – σ* | LP(2)O32 | 1.8452 | C12-N30 | 0.0774 | 106.61 | 25.48 | 0.67 | 0.119 |
| C12-N31 | 0.0821 | 112.05 | 26.78 | 0.67 | 0.122 | |||
| n – π* | LP(2)O34 | 1.8353 | C3-C4 | 0.3877 | 135.23 | 32.32 | 0.34 | 0.099 |
| C35-H36 | 0.0192 | 22.55 | 5.39 | 0.74 | 0.059 | |||
| C35-H38 | 0.0191 | 22.34 | 5.34 | 0.74 | 0.058 | |||
| n – σ* | LP(2)Cl40 | 1.9826 | C17-H18 | 0.0142 | 11.84 | 2.83 | 0.76 | 0.041 |
| C17-H39 | 0.0184 | 7.99 | 1.91 | 0.79 | 0.035 | |||
| n – σ* | LP(3)Cl40 | 1.9675 | C14-C17 | 0.0402 | 17.32 | 4.14 | 0.65 | 0.046 |
| H15-N31 | 0.0209 | 6.99 | 1.67 | 0.78 | 0.032 | |||
| C17-H39 | 0.0184 | 4.77 | 1.14 | 0.79 | 0.027 |
a E(2) – Stabilization energy b Donor-acceptor energy difference c F (i,j) is the fock matrix elements. The lone pair of O28 and the C20 ̶ O29 of the ester group has shown stabilization energy of about 212.97 KJ/mol. This large stabilization energy indicates delocalization of electron density in the carboxylate group. Thus it confirms the strong bonding between the oxygen and carbonyl group of the exocyclic ester side chain. In the title molecule, the strong hyperconjugative interaction has observed between lone pair electron of oxygen atom with σ and π anti-bonding electrons of C ̶ O, C ̶ N and C ̶ C. Enormous stabilization energies were found for lone pair electrons of oxygen atoms showLP(O29)→σ*(C20−O28), LP(O34)→π*(C3−C4), LP(O16)→π*(C1−C2), LP(O32)→π*(C12−N30), (C12 ̶ N31) interaction gives the stabilization energies of 138.45, 135.23, 122.59, 106.61 and 112.05 KJ/mol. The lone pair electrons of nitrogen atom have shown moderate stabilization energies of 59.16 and 70.25 KJ/mol are derived from the interactions of LP(N30) C12−O32, LP(N31) C12−O32. The stability confirmation between pyran and tetrahydropyrimidine ring has established by the lone pair electron of N31→σ*(C14 ̶ O16) leads to the stabilization of 78.32 KJ/mol. From the NBO analysis, the aromatic C-C π (~1.67-1.72e) and acceptor π*(~0.32-0.41) leads to the molecular stabilization of 60.63-101.04 KJ/mol. The electron density movement from donor → acceptor (C−C) interaction increases ED/e in anti-bonding orbital that weakens the respective bonds. This makes the high polarization and causes intra molecular charge transfer in the THPC compound. Nonlinear optical analysis The first hyperpolarizabilities (β0, α0 and Δα) of THPC is calculated using DFT level of theory. The first hyperpolarizability tensors can be described by Kleinman symmetry36. The calculated dipole moment (α), polarizability (μ) and first hyperpolarizability (β0) of THPC is, Calculated dipole moment = 2.0990 Debye Calculated polarizability = 3.7840 x10⁻³⁰esu First hyperpolarizability = 2.7495 x10⁻³⁰esu The first hyperpolarizability βtot of THPC calculated as 2.75×10⁻³⁰ esu. The dominated longitudinal compounds βXXX, βYYY, βXXZ and βYZZ shows large value of specific components indicates the significant charge delocalization in this direction. The calculated polarizability ‘α’ has non-zero value and dominated by the diagonal components. The first hyperpolarizability components of THPC are presented in Table 3. The first hyperpolarizability of THPC has seven times higher than reference Urea. Hence THPC has good nonlinear response and it is a good candidate in optical studies. Table 3: The first hyperpolarizability tensors of THPC.
|
Parameters |
B3LYP/6-31G(d,p) |
|
Dipole moment (μ) Debye |
|
|
μx |
-0.0758 |
|
μy |
2.0972 |
|
μz |
0.0467 |
|
μ |
2.0990 Debye |
|
Polarizability (α) x10-30esu |
|
|
αxx |
203.15 |
|
αxy |
11.28 |
|
αyy |
171.38 |
|
αxz |
-4.01 |
|
αyz |
11.24 |
|
αzz |
190.40 |
|
α |
3.7840 x10⁻³⁰esu |
|
First hyperpolarizability (β0) x10-30esu |
|
|
βxxx |
297.94 |
|
βxxy |
127.38 |
|
βxyy |
-42.47 |
|
βyyy |
-4.09 |
|
βxxz |
104.78 |
|
βxyz |
-42.27 |
|
βyyz |
-95.84 |
|
βxzz |
-21.21 |
|
βyzz |
91.83 |
|
βzzz |
2.63 |
|
β0 |
2.7495 x10⁻³⁰esu |
*Reference Urea β0=0.3728×10⁻³⁰esu. Energy gap Analysis The energy gap of THPC explains the charge transfer interaction, which influences the biological activity of the molecule. The negative and positive phases are represented in blue and red colour, respectively. The energy from the HOMO represents the ionization potential and LOMO represents the electron affinity. The energy gap of an organic molecule is an important stability factor for chemical structures37. The three dimensional images of HOMO and LUMO orbitals are shown in Fig. 5. The frontier molecular orbitals of THPC are presented in Table 4. Table 4: The Frontier molecular orbital energies of THPC.
| Orbitals | a.u | eV | K.E |
| 85O | -0.2705 | -7.36068 | 1.934732 |
| 86O | -0.26085 | -7.09791 | 2.133515 |
| 87O | -0.25211 | -6.86025 | 2.172732 |
| 88O | -0.24007 | -6.53249 | 1.567225 |
| 89O | -0.21716 | -5.90911 | 1.678119 |
| 90V | -0.01644 | -0.44735 | 1.851026 |
| 91V | 0.000347 | 0.009442 | 1.775268 |
| 92V | 0.001709 | 0.046504 | 1.758376 |
| 93V | 0.014842 | 0.403866 | 2.170792 |
| 94V | 0.053069 | 1.444061 | 2.097917 |
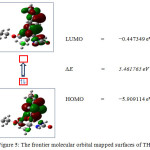 |
Figure 5: The frontier molecular orbital mapped surfaces of THPC. |
The energies of HOMO = -5.9099 eV, LUMO = -0.4473 eV and the energy gap is calculated as 5.4617 eV. The electron density at HOMO level in localized over the tetrahydropyrimidone and methoxy phenyl ring. The electron density at LUMO level is localized over the phenyl ring and carboxyl group of the exocyclic ester chain. The electron transition from HOMO→LUMO implies the transfer of electron density from tetrahydropyrimidinone ring to aromatic ring of the title molecule. Molecular Electrostatic Potential mapped surface The MEP mapped surface and the contours of the THPC are shown in Fig 6. The red region in MEP refers the area that would favour lone pair interaction region predicting a site of hydrogen bonding donor. The blue region in MEP refers the area that would favour acceptor nature. In the title molecule, the red regions are observed at the oxygen atom of tetrahydropyromidinone carbonyl group and ester carbonyl group. The blue regions are observed over the two N−H of the tetrahydropyrimidinone ring. The green regions represent the zero potential of the total molecule. The contour map of title molecule, represent the two dimension image of the electron density in the title molecule. In closer curved line represent the fractional region of the molecule, which represents the electrostatic potentially active area. These regions are responsible for the biologically active molecular interaction.
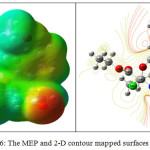 |
Figure 6: The MEP and 2-D contour mapped surfaces of THPC. |
Conclusion Novel organic oxygen bridged tricyclic pyrimidinones molecule is synthesized using Biginelli condensation reaction. The structural features of title molecule are studied using experimentally and theoretically. The relative energy of the stable conformer is identified as -1527.70 Hartree. The conformer exist an intramolecular hydrogen bonding between ester C=O∙∙∙H−C chlorine attached methylene with a bond distance of 2.28 Å. The stabilization energy of 1.56 Kcal/mol reveals the existing hydrogen bond is weak and its blue shift the C−H wavenumber to ~16 Cm-1. The predicted non-linear optical property (2.7495 x10⁻³⁰esu) of the title compound is much higher than urea. The THPC is a good candidate for second-order NLO material. The active charge sites give information about where the THPC can have intermolecular interactions and metallic bonding. References
- Mayer, T. U.; Small Molecule Inhibitor of Mitotic Spindle Bipolarity Identified in a Phenotype-Based Screen, Science, 1999, 286, 971–974.
CrossRef - Achelle, S.; Rodríguez-López, J.; Cabon, N.; and Guen, F. R. Protonable pyrimidine derivative for white light emission. RSC Adv. 2015, 5, 107396-107399.
CrossRef - Akdas-Kilig, H.; Godfroy, M.; Fillaut, J. L.; Donnio, B.; Heinrich, B.; Kedziora, P.; Malval, J.P.; Spangenberg, A.; Van Cleuvenbergen, S.; Clays, K.; Camerel, F. Mesogenic, Luminescence, and Nonlinear Optical Properties of New Bipyrimidine-Based Multifunctional Octupoles. J. Phys. Chem. C. 2015, 119, 3697–3710.
CrossRef - Kato, S.; Yamada, Y.; Hiyoshi, H.; Umezu, K.; Nakamura, Y. Series of Carbazole–Pyrimidine Conjugates: Syntheses and Electronic, Photophysical, and Electrochemical Properties. J. Org. Chem. 2015, 80, 9076–9090.
CrossRef - Wang, C.; Dong, H.; Hu, W.; Liu, Y.; Zhu, D. Semiconducting π-Conjugated Systems in Field-Effect Transistors: A Material Odyssey of Organic Electronics. Chem. Rev. 2012, 112, 2208-2267.
CrossRef - Baldenebro-Lopez, J.; Castorena-Gonzalez, J.; Flores-Holguín, N.; Almaral Sanchez, J.; Glossman-Mitnik, D.; Density Functional Theory (DFT) Study of Triphenylamine-Based Dyes for Their Use as Sensitizers in Molecular Photovoltaics. Int. J. Mol. Sci. 2012, 13, 4418-4432.
CrossRef - Mortimer, R.J.; Electrochromic materials. Chem. Soc. Rev. 1997, 26, 47-156.
CrossRef - Kwak, J.; Lyu, Y.Y.; Lee, H.; Choi, B.; Char, K.; Lee, C. New carbazole-based host material for low-voltage and highly efficient red phosphorescent organic light-emitting diodes. J. Mater. Chem. 2012, 22, 6351-6355.
CrossRef - Gratzel, M.; Photoelectrochemical cells. Nature 2001, 414, 338-344.
CrossRef - Kappe, C. O.; 100 years of the Biginelli dihydropyrimidine synthesis. Tetrahedron, 1993, 43, 6937-6963.
CrossRef - Suman, L. J.; Sweety, S.; Bir. S.; PEG-assisted solvent and catalyst free synthesis of 3,4-dihydropyrimidinones under mild reaction conditions. Green Chem., 2007, 9, 740-741.
CrossRef - Gaussian 03, Revision C.02, Gaussian Inc., Wallingford, CT, 2004.
- Jamroz, M. H.; Vibrational Energy Distribution Analysis: VEDA4 program, Warsaw, Poland, 2004.
- Michalska, D.; Raint Program, Wroclaw University of Technology, 2003.
- Michalska, D.; Wysokinski, R.; The prediction of Raman spectra of platinum (II) anticancer drugs by density functional theory. Chem. Phys. Lett., 2005, 403, 211-217.
CrossRef - Kuhn, B.; Mohr, P.; Stahl, M.; J. Med. Chem., 2010, 53, 2601-2611.
CrossRef - Klein, R. A.; Intramolecular Hydrogen Bonding in Medicinal Chemistry. Chem. Phys. Lett., 2006, 425, 128-133. CrossRef
- Russell D. Johnson III (Ed.), NIST Computational Chemistry Comparison and Benchmark Database, NIST Standard Reference Database Number 101, Release 17b, September, 2015.
- Dhandapani, A.; Manivarman, S.; Subashchandrabose, S.; Saleem, H. Molecular structure and vibrational analysis on (E)-1-(3-methyl-2,6-diphenylpiperidin-4-ylidene) semicarbazide. J. Mol. Struct., 2014, 1058, 41–50.
CrossRef - Silverstein, M.; Webster, F. X. “Spectrometric identification of organic compounds”, sixth edition, John wiley & sons, Inc, New York, 2001.
- Socrates, G.; “Infrared and Raman characteristic group wavenumbers table and charts”, Third edition, John wiley & sons, New York, 2001.
- Cinnar, M.; Karaback, M. Determination of conformational and spectroscopic features of ethyl trans-alfa-cyano-3-indole-acrylate compound: An experimental and quantum chemical study. Spectrochim Acta A, 2013, 104, 428-436. CrossRef
- Snehalatha, M.; Ravikumar, C.; Hubert joe, I.; Jayakumar, V.S. Vibrational spectra and scaled quantum chemical studies of the structure of Martius yellow sodium salt monohydrate. J. Raman spectrosc., 2009, 40, 1121-1126. CrossRef
- Varsanyi, G.; Assignments for Vibrational Spectra of Seven Hundred Benzene Derivatives, Vol. 1 and 2, Academic Kiado: Budapest, 1973.
- Medhi, K. C.; Barman, R.; Sarma, M. K. Vibrational spectra, thermodynamic functions and barrier to internal rotation of 2-chloro-5-nitropyridine. Indian J. Phys. 1994, 68(2), 189-194.
- Jamróz, M. H.; Dobrowolski, J. C.; Brzozowski, R.; J. Mol. Struct. 2006, 787, 172–183.
CrossRef - Mohan, J.; “Organic Spectroscopy: Principles and Applications”, second ed., Narosa Publishing House, New Delhi, 2001.
- Roeges, N. P. G.; “A Guide to the Complete Interpretation of Infrared Spectra of Organic Structures”, Wiley: New York, 1994.
- Smith, B. C.; “Infrared spectral interpretation: A systematic approach”, CRC Press, New York, 1999.
- Dhandapani, A.; Manivarman, S.; Subashchandrabose, S. Synthesis, single crystal structure, Hirshfeld surface and theoretical investigations on pyrimidine derivative. Chem. Phys. Lett. 2016, 655-656, 17–29.
CrossRef - Chithambarathanu, T.; Umayorubagan, V.; Krishnakumar, V.; Vibrational assignments of 2,6-di(p-methoxy phenyl)-3-methyl piperidone, 2,6-di(p-methyl phenyl)-3-methylpiperidone, 2,6-di(o-hydroxy phenyl)-3-methylpiperidone and 1-methyl-2,6(p-methoxy phenyl) piperidone. Ind. J. Pure Appl. Phys. 2002, 40, 72–74.
- Reed, A. E.; Weinhold, F.; Natural localized molecular orbitals. J. Chem. Phys. 1985, 83, 1736-1740.
CrossRef - Reed, A. E.; Weinstock, R. B.; Weinhold, F.; Natural population analysis. J. Chem. Phys. 1985, 83, 735.
CrossRef - Reed, A. E.; Weinhold, F.; Natural bond orbital analysis of near‐Hartree–Fock water dimer. J. Chem. Phys. 1983, 78, 4066-4073.
CrossRef - Foster, J. P.; Wienhold, F.; Natural hybrid orbitals. J. Am. Chem. Soc. 1980, 102, 7211–7218.
CrossRef - Kleinman, D. A.; Nonlinear dielectric polarization in optical media. Phys. Rev. 1962, 126, 1977-1979.
CrossRef - Dhandapani, A.; Manivarman, S.; Subashchandrabose, S.; Synthesis, crystal growth, structural evaluation and nonlinear optical analysis of ethyl-4-(3,4-dimethoxyphenyl)-6-methyl-2-sulfanylidene-3,4-dihydro-1H-pyrimidine-5-carboxylate J. Mol. Struct. 2017, 1127, 212-225.
CrossRef
Accepted on: May 17, 2018


![]()


