Synthesis, Characterization, and Catalytic Performance of La1-xCexNi1-yZryO3 Perovskite Nanocatalysts in Dry Reforming of Methane
Parastoo Dezvareh1, Hamidreza Aghabozorg2, Moayad Hossaini Sadr3 and Karim Zare2
1,3Department of Chemistry, Science and Research branch, Islamic Azad University, Tehran, Iran.
2Research Institute of Petroleum Industry, Tehran, Iran.
Corresponding Author E-mail: dezvarehparastoo38@gmail.com
DOI : http://dx.doi.org/10.13005/ojc/340337
Article Received on : August 03, 2017
Article Accepted on : January 17, 2018
Article Published : 16 May 2018
La1-xCexNi1-yZryO3 perovskite nanocatalysts were prepared by a method called citrate sol-gel. The samples were studied by the methods as X-ray diffraction (XRD), temperature programmed reduction (TPR), and inductively coupled plasma (ICP) technique.The BET method was used to determine the specific surface area. In addition, scanning and transmission electron microscopy techniques were employed to study the morphology of the prepared samples31. The XRD patterns confirmed the formation of perovskite with well-crystallized structure in doping level up to x= 0.1 and y= 0.2. The results of morphology studies revealed that homogenous particles in nanometer range were achieved. Based on the TPR analysis, reduction process occurred at higher temperatures and became difficult as the doping level of Zr increases. The catalytic performance was studied in dry reforming of methane (DRM) with CO2. The catalyst La0.9Ce0.1Ni0.8Zr0.2O3 perovskite provides the highest catalytic performance. CH4 conversion was more than 60%, CO2 conversion was more than70% and the H2/CO molar ratio was ~1, respectively. Catalytic activity of La1-xCexNi1-yZryO3 nanocatalysts was enhanced when the doping level of Zr (y) increased up to 0.2, and the following result was obtained for H2/CO ratio: LaNiO3 > La0.9Ce0.1Ni0.8Zr0.2O3 > La0.9Ce0.1Ni0.9Zr0.1O3 > La0.9Ce0.1NiO3
KEYWORDS:Nanocatalyst; Catalytic Performance; Perovskite; Dry Reforming of Methane (Drm)
Download this article as:| Copy the following to cite this article: Dezvareh P, Aghabozorg H, Sadr M. H, Zare K. Synthesis, Characterization, and Catalytic Performance of La1-xCexNi1-yZryO3 Perovskite Nanocatalysts in Dry Reforming of Methane. Orient J Chem 2018;34(3). |
| Copy the following to cite this URL: Dezvareh P, Aghabozorg H, Sadr M. H, Zare K. Synthesis, Characterization, and Catalytic Performance of La1-xCexNi1-yZryO3 Perovskite Nanocatalysts in Dry Reforming of Methane. Orient J Chem 2018;34(3). Available from: http://www.orientjchem.org/?p=45942 |
Introduction
Greenhouse gases such as (CO2) and (CH4) cause global warming that is one of the greatest problems worldwide. There are many researches based on CO2 consuming and H2 production in order to solve the global warming such as dry reforming of methane (DRM)1-3. Methane dry reforming applies greenhouse gases including CH4 and CO2 to produce syn-gas (H2+CO)30.Syn-gas is used in Fischer–Tropsch synthesis method to generate different chemicals4-8. Many of perovskite oxides behave as catalysts in the production of syn-gas regarding their stability9-12. ABO3 formula of perovskites contains lanthanides, alkali metals, and alkali earth metals as A-site and transition metals are inserted in the B-site15. The active site in the perovskite oxide is the B-site, while the stability of the perovskite is affected by the A-site metal. The proper interaction of A and B-site metals increases the catalytic performance13,14,16. The dry reforming of methane employs carbon dioxide (as an oxidant) and methane on the surface of Ni-based perovskites which are resistant to coking15. The reactions that can occur in the dry reforming of methane are endothermic as below33:
CH4+ CO2 ↔ 2CO + 2H2 ΔH298k = 247 kJ/mol (1)
CO2 + H2 ↔ H2O + CO ΔH298k = 41 kJ/mol (2)
Partially substituting at A and B sites, affects the stability, structural defect formation, oxygen mobility in crystal lattice34, oxygen storage, coke resistance, and catalytic activity35,38,42. Some examples of La substitution in La1-xMxNiO3 that promotes catalytic performance are M= Ce15-17 and Sr18. Resulting compounds are resistant to deposition of carbon because of numerous oxygen vacancies and presence of Ni crystallite size. Catalysts that are Ce- substituted improve catalytic behavior because they have sufficient capacity of oxygen storage and high mobility of lattice oxygen16. Based on Sutthiumporn et al.18 researches, B-site substitution leads to better catalytic performance and structural stability. Gallego et al. studied La1–xAxNiO3-d perovskite, in which lanthanum was substituted by cerium and praseodymium, and investigated its catalytic performance and coke resistance in DRM2. Jahangiri et al.19-20 investigated the performance of perovskite-type oxides La1–xSmxNiO3 and LaNi1–xFexO3 in combined reforming of methane (CRM) by changing the substitution degrees (x). Goldwasser et al.21 studied the partial substitution influence of Ru by Ni and La by Ca in LaRuO3 and LaRu0.8Ni0.2O3, respectively in CRM and DRM processes. Structural defects of the perovskite oxides can be formed by doping different metallic elements at A or B sites to increase its catalytic activity. The reduction of the metal on B site leads to the activation of these oxide systems. The reducing process should take place on the catalyst bed15. Variable chemical methods such as sol-gel, co-precipitation, hydrothermal, and aerosol are applied to produce nano-sized perovskites.
In the present research, La1-xCexNi1-yZryO3 perovskites with various doping level up to x= 0.1 and y= 0.3 were obtained. The catalytic behavior was evaluated in DRM30.
Experimental
Preparation of Catalysts
La1-xCexNi1-yZryO3 samples have been synthesized by a method called citrate sol-gel. Stoichiometric amounts of the cations at A and B sites were applied. La(NO3)3.6H2O(Merck, >99/9%), Ce(NO3)3.6H2O (Merck, >99%), Ni(NO3)2.6H2O (Merck, >99%),32 ZrO(NO3)2.6H2O, (Aldrich, 99/99%)43, ethylene glycol (99%), and citric acid (Merck, 99/5%)were used30,41. A solution (1M) consisting of proper stoichiometric amounts of lanthanum, cerium, nickel nitrates, and zirconium oxynitrate were prepared and stirred for 40 minutes at 60˚C30. The ethylene glycol and citric acid (1M) were added. The sol forming started and the extra water evaporated during 8 h at 80˚C30. The sol transformed to an amorphous spongy gel. The gel was dried for 24 h at 110˚C and calcined within 2 h at 800˚C. The rate of heating was 1˚C/min as it reached 350˚C and 3˚C/min until it reached 800˚C.
Characterization Techniques
In order to determine the crystallite structure, purity of phase and the size of the particle, X-ray patterns were studied. A 3003 PTS diffractometer, prepared the X-ray diffraction patterns of the synthesized samples37. The copper anode was applied in this equipment20. The observed X-ray patterns of the catalyst were compared with the JCPDS database that leads to identification of the phases40. Scanning electron microscopy (SEM) was used to study the morphology of the catalysts by employing a Philips XL30 microscope and transmission electron microscopy (TEM) applying Philips CM200 FEG microscope30. Temperature-programmed reduction (TPR) is a technique for determination of reduction properties of the samples. In this technique semi-automatic micrometrics TPD/TPR 29000 apparatus was applied30. Based on the BET method, a Tristar 3000 Micrometrics was employed to measure the specific surface areas of the samples. In this method, N2 at 200°C was used. Inductively coupled plasma (ICP) emission spectroscopy, measured the quantitative analysis of metals30.
Measuring Catalytic Activity
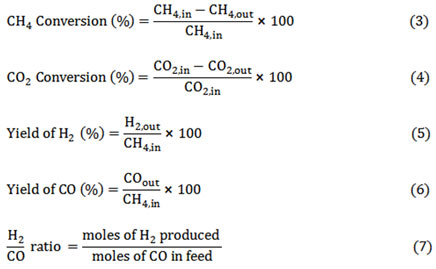
The experimental studies and evaluation tests of the catalytic activity were carried out in a micro-reactor applying highly pured feed gases (CH4, CO2, N2 and H2)20. Controllers of the mass flow were Brooks Instrument, Model 5850. Two thermocouples and PID thermo-controllers measured and controlled the temperature of micro-reactor. 0.4 g of the catalyst was loaded in the reactor for all case studies. The flow rate of feed gases was 100 mL/min (WHSV = 15 L/(h.g), CH4/CO2 = 1/1) under atmospheric pressure30. The temperature was between 600°C and 800°C36. A gas chromatograph analyzed the products and reactants with FID and TCD detectors. Before measuring the activity of catalysts, the precursors should be reduced to produce the metal phase in a mixture of 20% H2/N2 for 2 h at 700°C. The rate of flow should be 50 mL/min30. In all tests, the performance of the catalysts were evaluated by conversions. Conversions of CH4 and CO2, yields of H2 and CO, and H2/CO ratios based on the endothermic reactions attributed to this process were defined as follow10,39:
Results and Discussions
Characterization of the La1-xCexNi1-yZryO3 Samples
Crystalline Structure
The XRD patterns of the La1-xCexNiO3 samples for x up to 0.2 and y= 0.0 are shown in Fig. 1. In the case of the Ce&Zr-free sample (x= 0.0 and y= 0.0), diffraction lines belong to the LaNiO3 perovskite phase based on (JCPDS No.: 88-633)15,30. For doping level of x= 0.1 and y= 0.0, detailed examination of this pattern also revealed the perovskite phase of La0.9Ce0.1NiO3. For substitution degree of x= 0.2, the diffraction lines of XRD pattern are characteristic of the perovskite, and also NiO and CeO2 oxides15. The XRD patterns of the synthesized La0.9Ce0.1Ni1-yZryO3 are seen in Fig. 2. The XRD patterns of these samples confirm that Zr doping level (y) up to 0.2 have led to the formation of mono phase and well-crystallized perovskite structure. Beyond y= 0.2, additional peaks are appeared which belong to CeO2, NiO, and La2Zr2O7 oxides.
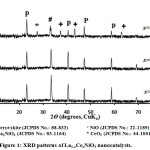 |
Figure 1: XRD patterns of La1-xCexNiO3 nanocatalysts.
|
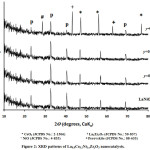 |
Figure 2: XRD patterns of La0.9Ce0.1Ni1-yZryO3 nanocatalysts.
|
Chemical Analysis and Surface Area Measurement
Table 1 shows the surface area and chemical composition (wt.%) for synthesized samples. The experimental data and the nominal value are close to each other for La, Ce, Ni, Zr (wt.%) based on ICP technique30. The reported values in parenthesis are nominal values. The results determine that a proper method was applied in this research. Surface areas of the catalysts based on BET method are in the range of 3-6 m2g-1. Low surface area solids are the result of high temperatures exposure for long time. Scherrer equation was applied by employing the intense peak to determine the crystallite size of the obtained samples. The samples contain particles of the size in nanometers as the results confirmed
Table 1: Crystallite size, surface areas, and elemental analysis of some La1-xCexNi1-yZryO3 perovskites (calculated by Scherrer equation).
| La1-xCexNi1-yZryO3 | |||||||
| X | y | La (wt.%)* | Ce (wt.%) | Ni (wt.%) | Zr (wt.%) | SA (m2/g) | D (nm) |
| 0 | 0 | 69.8 (70.2) |
0.0 (0.0) |
30.2 (29.8) |
0.0 (0.0) |
6 | 51 |
| 0.1 | 0.1 | 62.2 (62.5) |
7.0 (6.8) |
26.3 (26.5) |
4.5 (4.2) |
3 | 45 |
| 0.1 | 0.2 | 61.2 (61.4) |
6.9 (6.8) |
23.0 (23.1) |
8.9 (8.7) |
5 | 43 |
* Nominal values in parenthesis
Morphology
Morphology studies of the perovskites were accomplished by SEM and TEM techniques. Figs. 3 and 4 (SEM and TEM images), reveal a uniform texture of spherical particles. The particle sizes are in nanoscale which is in consistent with crystallite sizes that calculated by Scherrer equation (see Table 2).
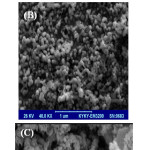 |
Figure 3: SEM images of La0.9Ce0.1Ni1-yZryO3 ((y = 0.1) (A), (y = 0.2) (B), (y = 0.3) (C)).
|
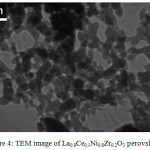 |
Figure 4: TEM image of La0.9Ce0.1Ni0.8Zr0.2O3 perovskite. |
Reducibility study of La1-xCexNi1-yZryO3
Since active sites for the reforming reaction in La1-xCexNi1-yZryO3 samples are nickel and zirconium, the samples have to be reduced in order to be activated prior to the reaction. After the reduction process, Ni and Zr highly scattered on a matrix of La–Ce–O and the metal catalyst was produced. Therefore, temperature-programmed reduction is applied to study the reducibility of La1-xCexNi1-yZryO3, (Fig. 5). The reduction of LaNiO3 perovskite occurs in two steps. The maximum points of the peaks were apparent at 408 and 505˚C22-23. The first peak can be assigned to reducing of Ni3+ to Ni2+ that corresponds to La2Ni2O5 forming15. The second peak can be attributed to reduction of Ni2+ to Ni0. Cerium doped perovskites (La1-xCexNiO3), show slight shift to lower temperatures in TPR profile2. It has been reported24 that, the reduction becomes easier while the energy of metal-oxygen bond 2,15,24 decreases. In this case study, for La0.9Ce0.1NiO3 sample, by decreasing the ionic radius in A-site from 103.2 pm (La3+) to 101 pm (Ce3+), metal–oxygen bond energy has been decreased2. Thus, the ease of reduction is achieved. With doping Zr into the perovskite samples (La0.9Ce0.1Ni1-yZryO3), the reduction is occurred in four steps. The peaks at lower and higher temperatures can be attributed to reducing of Ni3+ to Ni2+ and Zr2+ to Zr0, respectively20. The broad peak at intermediate can be allocated to reducing of Ni2+ to Ni0 and Zr4+ to Zr2+ in the perovskite structure25-26. In other words, the partial replacement of nickel by zirconium in the perovskite structure made the metal reduction more difficult and the maximum of the peaks shifted to higher temperatures. Since Zr ion is more resistant to reduction than Ni ion in the ABO3 perovskite, the Zr ions would be reduced at higher temperatures18.
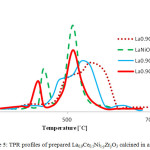 |
Figure 5: TPR profiles of prepared La0.9Ce0.1Ni1-yZryO3 calcined in air at 800˚C. Click here to View figure |
Catalytic Aactivity
Catalytic behavior of the obtained compounds has been considered for DRM process. The temperature was between 600 to 800˚C38. The CH4 & CO2 conversions and H2 & COyields in various temperatures, in the presence of La0.9Ce0.1Ni1-yZryO3 are prepared in Fig. 6. CH4 and CO2 conversions grow by rising the temperature. The conversions of CO2 are higher than that of CH4. It can be the result of CO2 consuming in reaction equations 1 and 2. Consequently, by rising reaction temperature, both H2 and CO yields increase and the CO yields are higher than that of H2. This feature is more notable at higher temperatures. In reactions with La0.9Ce0.1Ni1-yZryO3 catalyst that the partial doping level is y= 0.3, there is not notable product yields at any temperature. H2/CO ratio is ~1, in the reactions containing La0.9Ce0.1Ni1-yZryO3 with doping level of y= 0.1 and y= 0.2. It can be concluded that the reaction equation 1 may be the main reaction30. Based on these results, mono phase perovskites are proper to produce more H2. H2/CO ratio is less than 1 where Zr doping level of the applied catalyst is y>0.2 and has more than one phase. In samples without Zr (La0.9Ce0.1NiO3) this ratio is also less than 1. In fig. 7 the CH4 & CO2 conversions, and H2 & CO yields versus time for La0.9Ce0.1Ni1-yZryO3 samples are presented. These diagrams reveal that in reactions containing the pure perovskite, CH4 & CO2 conversions and H2 & CO yields are higher in comparison with reactions containing more than one phase. In reactions containing La0.9Ce0.1Ni0.8Zr0.2O3 catalyst the H2/CO ratio is ~1 with the best catalytic performance (Fig. 8). In reactions containing La1-xCexNi1-yZryO3 samples, the content of Ce and Zr control the CH4 and CO2 conversions in DRM process. Redox chemistry, heat stability, ionic conductivity and the oxygen transporting capability of Zr is notable in proper catalytic behavior of these nanocatalysts27-29. High redoxability of cerium upgrades the catalytic characteristic of Ni-based catalysts2 in DRM30.
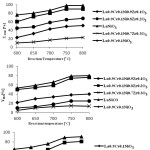 |
Figure 6: Conversions of CH4 and CO2, and H2 and CO yields versus temperature for La0.9Ce0.1Ni1-yZryO3 samples in DRM process (CH4/CO2= 1/1 and WHSV=15L/(h.g)). |
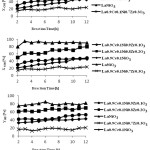 |
Figure 7: Conversions of CH4 and CO2, H2 and CO yields versus time for La0.9Ce0.1Ni1-yZryO3 samples at 750°C in DRM process (CH4/CO2= 1/1 WHSV=15L/(h.g)). Click here to View figure |
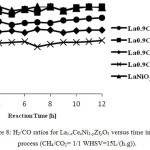 |
Figure 8: H2/CO ratios for La1-xCexNi1–yZryO3 versus time in DRM process (CH4/CO2= 1/1 WHSV=15L/(h.g)). |
Conclusions
The perovskite La1-xCexNi1-yZryO3 ( x=0.1, y=0.1, 0.2) nanocatalysts were prepared by a method called citrate sol-gel. Spherical particles on a nanometer scale were produced.
Based on TPR analysis, partial substitution of Ni by Zr in La0.9Ce0.1Ni1-yZryO3 perovskite led to a difficult reducibility of nickel, and consequently, the metal reduction shift to higher temperatures.
By rising the temperature, CH4 & CO2 conversions and the yields of H2 & CO increased, while the pure perovskite was present in the reaction.
Partially substituted perovskite La0.9Ce0.1Ni0.8Zr0.2O3 performed the best catalytic activity.
References
- Valderramaa, G.; Kiennemannb, A.; Goldwasser, M. R. Power Sources. 2010, 195, 1765-1771.
CrossRef - Gallego German, S.; Marin Jaime, G.; Batiot-Dupeyrat, C.; Barrault, J.; Mondragon, F.; Appl. Catal. A: Gen. 2009, 369, 97-103.
CrossRef - Steinhauer, B.; Kasireddy, M.R.; Radnik, J.; Martin, A. Appl. Catal. A: Gen. 2009, 366, 333-341.
CrossRef - Bedel, L.; Roger, A. C.; Estournes, C.; Kiennemann, A.; Catal. Today, 2003, 85, 207-218.
CrossRef - Zhang, W. D.; Liu, B. S.; Zhu, C.; Tian, Y. L.; Appl. Catal. A: Gen.. 2005, 292, 138-143.
CrossRef - Ruckenstein, E.; Wang, H. Y. Catal, Lett. 2001, 73, 99-105.
CrossRef - Eltejaei, H.; Bozorgzadeh, H. R.; Towfighi, J.; Omidkhah, M. R.; Rzari, M.; R. Zanganeh, R. Int. J. Hydrogen Energy. 2012, 37, 4107-4118.
CrossRef - García-Diéguez, M.; Pieta, I. S.; Herrera, M. C.; Larrubia, M. A.; Alemany, L. J. J. Catal. 2010, 270, 136–145.
CrossRef - Urasaki, K.; Tokunaga, K.; Sekine, Y.; Matsukata, M.; Kikuchi, E. Catal. Commun. 2008, 9, 600-601.
CrossRef - Dejaidja, A.; Libs, S.; Kiennemann, A.; Barama, A.; Catal. Today. 2006, 113, 194-200.
CrossRef - Gallego, G. S.; Mondragon, F.; Barrault, J.; Tatibouet, J. M.; Dupeyrat, C. B. Appl. Catal A: Gen. 2006, 311, 164-71.
CrossRef - Mawdsley, J. R.; Krause, T. R. Appl. Catal. 2008, 334, 311-312.
CrossRef - Chendong, Z.; Doris, S.; Balachandran, U.; Meilin, L. Chem. Mater. 2006, 18, 4647-4650.
CrossRef - Pereniguez, R.; Gonzalez-DelaCruz, V. M.; Holgado, J. P.; A. Caballero, Appl. Catal. 2010, 93, 346-353.
CrossRef - Lima, S. M.; Assaf, J. M.; Pena, M. A.; Fierro, J. L. G. Appl. Catal. 2006, 311, 94-104.
CrossRef - Choi, S.; Moon, S. H. Catal. Today, 2009, 146, 148-153.
CrossRef - Lima, S. M.; Silva, A. M.; Costa, L. O. O.; Assaf, J. M.; Mattos, L. V.; Sarkari, R. Appl. Catal. B. 2012, 121, 9.
CrossRef - Sutthiumporn, K.; Maneerung, T.; Kathiraser, Y.; Kawi, S. Int. J. Hydrogen Energy. 2012, 37, 11195-11207.
CrossRef - Jahangiri, A.; Aghabozorg, H. R.; Pahlavanzadeh, H. Int. J. Hydrogen Energy. 2013, 38, 10407-10416.
CrossRef - Jahangiri, A.; Pahlavanzadeh, H.; Aghabozorg, H. R. Int. J. Hydrogen Energy. 2012, 37, 9977-9984.
CrossRef - Goldwasser, M. R.; Rivas, M. E.; Pietri, E.; Perez-Zurita, M. S.; Cubeiro, M. L.; Gingembre, L.; Leclercq, L.; Leclercq, G. Appl. Catal. 2003, 225, 45-47.
CrossRef - Jahangiri, A.; Aghabozorg, H. R.; Pahlavanzadeh, H.;J, Towfighi, J. Int. J. Chem. React. Eng. 2014, 12, 1–10.
- Valderrama, G.; Kiennemann, A.; Goldwasser, M. R. Catal. Today. 2008, 133, 142–148.
CrossRef - Catherine, B. D.; Gallego, G. A. S.; Mondragon, F.; Barrault, J.; Tatibouet, J. M. Catal. Today. 2005, 107, 474-480.
- Zhongshan, Y.; Changjun, N.; Chunxi, Z.; Diannan, G.; Shudong, W.; Yuming, X.; Akira, O. Catal. Today. 2009, 146, 124–131.
CrossRef - Jun, K.W.; Roh, H.S.; Chary, K.V. Catal. Surv. Asia. 2007, 11, 97–113.
CrossRef - Valderrmaa, G.; Goldwasser, M. R.; Navarro, C. U.; Tatibouët, J. M.; Barrault,J.; Dupeyrat, C. B.; Martinez, F. Catal. Today. 2005, 107, 785–791.
CrossRef - Supaporn, T.; Apichai, T.; Chairut, S.; Sarayut, Y. Int. J. Hydrogen Energy. 2008, 33, 991-999.
CrossRef - Choque, V.; Ramírez, P.; Molyneux, D.; Homs, N. Catal. Today. 2010, 149, 248–253.
CrossRef - Talaie, N.; Hossaini Sadr, M.; Aghabozorg, H.R.; Zare, K. Orient. J. Chem., 2016, 32 (5).
- Pakhare, D.; Schwartz, V.; Abdelsayed, V.; Haynes, D.; Shekhawat, D.; Poston, J.; Spivey, J. J.Catal.2014, 316,78-92.
CrossRef - Soongprasit, K.; Aht-Ong, D.; Sricharoenchaikul, V.; Atong, D. Current Applied Physics. 2012, 12 (2), 80-88.
CrossRef - Lim, H. S.; Kang, D.; Lee, J. W. Appl. Catal. B: Invironmental. 2017, 202, 175-183.
CrossRef - Pakhare, D.; Spivey, J., Chem. Soc. Rev., 2014, 43, 7813-7837.
CrossRef - Bushra, I.; Syed Tajammul, H.; Sohaib, A. Chem. Ing. J. 2013, 219, 395-402.
- Lucrédio, A. F.; Assaf, J.M.; Assaf, E. M. Appl. Catal. A: Gen. 2011, 400, 156-165.
CrossRef - Barros, B.S.; Libs, S.; Melo, D. M. A.; Kiennemann, A. Appl. Catal. A: Gen. 2010, 378 (1), 69-75.
CrossRef - Li, J.; Li, J. G.; Zhang, Z.; Wu, X.; Liu, S.; Li, X.; Sun, X.; Sakka, Y. Sci. Technol. Adv. Mater., 2012, 13 (3).
CrossRef - Liu, B.S.; Zgao, L.; Au, C.T. Appl. Catal. A: Gen. 2002, 235, 193-206.
CrossRef - Kwak, J. H.; Lee, S. G.; Lee, S. H.; Park,Y. K.; Sohn, J. M. Catal. Today, 2014, 232, 11-15.
CrossRef - Logvinovich, D.; Sheptyakov, D.; Bocher, L.; weidenkaff, A. Solid State Sciences, 2009, 11 (8), 1513-1519.
CrossRef - De Caprariis, B.; De Filippis, P.; Palma, V.; Petrullo, A.; Ricca, A.; Ruocco, C.; Scarsella, M. Appl. Catal. A: Gen. 2016, 517, 47-55.
CrossRef - Mohebbi, H.; Ebadzadeh, T.; Hesari, F.A. Powder Technology, 2009, 188, 183-186.
CrossRef

This work is licensed under a Creative Commons Attribution 4.0 International License.
![]()
A New Edition of Web of Science
Journal Impact Factor
2022: 0.5
Five Year: 0.8
Journal is Indexed in

Cabells Whitelist
![]()


