Synthesis, Characterization and Antimicrobial Evaluation of Novel 1-[(1-Phenyl-1h-Tetrazol-5-Ylimino)-Methyl]- Naphthalen-2-Ol and its Cu(II), Co(II) Complexes
 and Siska Oktapianti2
1Department of Chemistry, College of Science, Institut Teknologi Sumatera Jl. Terusan Ryacudu, Lampung Selatan 35365, Indonesia.
2Department of Chemistry, College of Science, Osmania University Main Road, Amberpet, Hyderabad, Telangana 500007, India.
Corresponding Author E-mail: mariyam@ki.itera.ac.id
DOI : http://dx.doi.org/10.13005/ojc/340346
Download this article as:
![]()
Novel 1-[(1-Phenyl-1H-tetrazol-5-ylimino)-methyl]-naphthalen-2-ol (PTMN) ligand, [Cu(PTMN)ClH2O] and [Co(PTMN)ClH2O] complexes have been synthesized. Characterization of the obtained compounds were performed by 1H-NMR, FT-IR, UV-Vis, Mass spectrometry and thermo-analytical study. The morphology of compounds were determined by SEM, while EDX study was employed to identify elements in ligand and the metal complexes. Metal-ligand compositions were analyzed spectrophotometrically using Job’s continuous-variation method. pH-metric technique was carried out to give the quantity of dissociable protons and protonation sites in the obtained compound. The ligand [Cu(PTMN)ClH2O] and [Co(PTMN)ClH2O] complexes were tested for in vitro antimicrobial properties against YEPDA, Gram-positive and negative bacteria. It was observed that metal complexes showed enhanced antimicrobial potential as compared to the free ligand. In addition, [Cu(PTMN)ClH2O] complex indicated greater antimicrobial activity against most of microbial strains as compared to the ligand and [Co(PTMN)ClH2O] complex.
KEYWORDS:Antimicrobial Activity; Co(II) Complexes; Cu(II); Electronic Spectra; Synthesis; Tetrazole
Introduction
Heterocyclic compounds play important role in organic chemistry because of their flexibility and ability to respond many demands of biochemical systems. Heterocyclic is the majority of pharmaceuticals and biologically active compound.1 Among heterocyclic compounds, tetrazole has received significant interest in the development of the synthesis of pharmacologically active drugs. Tetrazole and its derivatives have taken much more of interest in the past years due to their specific structure and their functions as antihypertensive, anticonvulsant, antifungal, antibacterial and anticancer agents.2-6
In the field of antibiotic studies, tetrazole has been used as promising material for the treatment of bacterial infection. Advancement of tetrazole in chemistry has been widely correlated with large-scale application of those compounds in pharmacy, agriculture and industry etc.2-13 However, efforts to further studies must be done to improve the functionality of tetrazole derivatives. In the previous work, we have synthesized and characterized metal complexes of tetrazole imine base 4-Chloro-2-[(1-phenyl-1H-tetrazol-5-ylimino)-methyl] phenol (Cl-PTMP) and revealed its antimicrobial activity.14 In the present work, synthesis, characterization and antimicrobial evaluation of novel 1-[(1-Phenyl-1H-tetrazol-5-ylimino)-methyl]-naphthalen-2-ol (PTMN) has investigated. It is confirmed that novel1-[(1-Phenyl-1H-tetrazol-5-ylimino)-methyl]-naphthalen-2-ol (PTMN) showed more antimicrobial activity than previous compound.
Materials and Methods
Materials
All chemicals used are analytical grade. 1-phenyl-1H-tetrazol-5-amine, 2-hydroxy-1-naphthaldehyde, methanol, CuCl2.2H2O, CoCl2.6H2O, 1,4-dioxane, NH4OH, nutrient agar (Merck), non-resistant strains of microba (Bacillus subtilis, Escherichia coli, Pseudomonas aeruginosa, Klebsiella pneumoniae, Staphylococcus aureus, and Saccharomyces cerevisiae) was obtained from microbiology laboratory, Department of Microbiology, Osmania University, India.
Instrumentation
The particle size and morphology of title compounds were recorded by using ZEISS-GEMINI SEM. The elemental composition was analyzed by INCA EDX instrument . Thermal analysis were recorded by TGA and DTA instrument (Polmon model No. MP-90). Mass spectra was recorded on VG AUTOSPEC. Electronic spectra was investigated using Shimadzu UV-1800 Ultraviolet-Visible spectrophotometer. 1H-NMR and Infrared spectra were recorded using Varian Gemini unity spectrometer and Perkin-Elmer 337 spectrometer respectively. pH metry measurement was set using a digital Elico LI 120 pH meter in conjuction with combined glass and Calomel electrode.
Procedure
Preparation of Ligand PTMN (1-[(1-Phenyl-1H-tetrazol-5-ylimino)-methyl]-naphthalen-2-ol)
Equimolar ratio of 1-phenyl-1H-tetrazol-5-amine (0.75 g, 0.00465 mol) and 2-hydroxy-1-naphthaldehyde (0.8010 g, 0.00465 mol) were dissolved in methanol. The solution was refluxed for 3-4 hours at constant temperature about 60 – 70°C. The reaction progress was monitored by thin layer chromatography. Methanol was added to the resulting compound for recrystallization to yield pure compound.
Yellow solid. Yield= 58%. m.p=220˚C. UV-Vis (200-700 nm); (λ:nm): (339 nm) (395 nm) (486 nm). FT-IR (KBr, cm-1); 3058 (νC ̶ H) : 1607 (νC=N). MS (M+H)+ m/z: 316. 1H-NMR (CDCl3), ppm: δ=13.8 (OH), δ=7.2-8.4 (aromatic proton), δ=10 (N=CH).
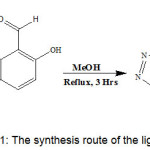 |
Scheme 1: The synthesis route of the ligand (PTMN)
|
Preparation of Metal Complexes
1 mol for each metal chloride (CuCl2.2H2O and CoCl2.6H2O) were dissolved in methanol and added to a solution of PTMN ligand in dioxan. Methanolic ammonia was added to maintain pH of the solution. The solution was refluxed for 10-12 hours at 50-60°C. Further washed with dioxan and methanol.
![Scheme 2: The synthesis route of the [Cu(PTMN)ClH2O] and [Co(PTMN)ClH2O] complexes](https://www.orientjchem.org/wp-content/uploads/2018/06/Vol34No3_Syn_Par_sch2-150x150.jpg) |
Scheme 2: The synthesis route of the [Cu(PTMN)ClH2O] and [Co(PTMN)ClH2O] complexes |
Antimicrobial Evaluation
The in vitro antimicrobial testing of ligand and [Cu(PTMN)ClH2O] and [Co(PTMN)ClH2O] complexes were assayed against non-resistant strain of Gram positive (Bacillus subtilis and Staphylococcus aureus), Gram negative (Klebsiella pneumoniae, Pseudomonas aeruginosa and Escherichia coli) bacteria and yepda (Saccharomyces cerevisiae). The microba were spreaded on nutrient agar and yeast extract peptone dextrose agar medium respectively. 20 µl of each compound by the concentration of 1mg/1ml were inoculated into the wells and incubated process at 37°C/24 hours. This study was carried out using Kirby Bauer Disc diffusion method.15 The inhibitory activity was indicated by the diameter size of the clear zone.
Result and Discussion
Characterization of Ligand (PTMN)
UV-Vis Spectrum
The UV-Vis spectral data of PTMN showed intense peaks at 342, 398 and 491 nm. These are due to n – π* and π – π* transitions of conjugated π-bonding systems in ligand (fig.4).
FTIR Spectral Data
The FTIR spectrum of PTMN (fig. 5) showed stretching band at 3058 cm-1 which was assigned to the absorption of C-H groups for aromatic ring. The second peak at 1602 cm-1 was observed as C=N stretching frequencies in the azomethine group which indicated NH group from tetrazole moeity was associated with C atom of naphthaldehyde gave Schiff base formation.
Mass Spectral Data
The mass spectrum of PTMN exhibited a high intense base peak observed at m/z = 316 which indicated M+1 peak. It is expected that the spectra shows the existence of quasi molecular ion (M+H)+.
1H-NMR Spectral Data
The 1H-NMR spectrum of PTMN was measured in CDCl3 solvent. The spectrum showed signal at δ 13.8 ppm corresponded to the proton of ̶ OH group bound to naphthaldehyde moeity . Many signal in the region δ=7.2-8.4 ppm could be attributed to 5 protons of aromatic ring tetrazole moiety and 6 protons of naphthaldehyde rings. The signal at δ 10.4 was assigned to azomethine proton (N=CH).
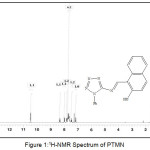 |
Figure 1: 1H-NMR Spectrum of PTMN |
Equilibrium Studies
The measurement of pH value of PTMN ligand was performed in 70% dioxane-water medium at 33°C and 0.1 M (KNO3) ionic strength. The average number of protons associated per ligand (A) were calculated by Irving-Rossetti method.16 From the titration data, the proton-ligand dissociation constant has been determined by the linear plot of log (1- A )/A vs pH (Fig. 2). The curves showed the presence of one dissociable proton corresponds to ̶ OH group of PTMN. The figure shows that the calculated pKa value is 9.16, which means that the ligand has a greater tendency to dissociate a proton. The pH metric titrations were also performed with metal ion solutions of (Cu)(II) and Co(II)) in 70% dioxane-water medium at 33°C and 0.1 M (KNO3) ionic strength. The formation of complexes while the titration proceeds is identified by the shape of the titration curve. The curve clearly states that stability of the compound increases by the released of dissociable proton.
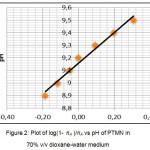 |
Figure 2: Plot of log(1- ??A )/??A vs pH of PTMN in 70% v/v dioxane-water medium |
Spectrophotometry Studies
Metal ligand composition of Cu(II) and Co(II) complex was determined spectrophotometrically by applying Job’s continuous-variation method.17,18 The total volume of ligand and metal was kept constant by varying metal and ligand volume ratio. By measuring the absorbance for series of solutions, the exact composition of metal complex can be obtained. A graph is plotted between mole fraction of ligand on x axis and absorbance on y axis. The potentiometric titration shows the released of 1 protons by phenolic hydroxyl group (─OH) donor site. The interpolation plot of Job’s method showed 0.5 mole fraction signified the formation of (M:L) 1:1 ratio between metal and PTMN ligand (fig.3). It assumes that 1 metal binds with 1 PTMN ligands with its oxygen and nitrogen donor sites. Generally, metal complexes with the formation constants greater than 106 are stable over a long range of pH including high pH values.19 Therefore, the complexes in this study have stability constants over 106 were assumed that the complexes are suitable for the use in chelation therapy in that do not dissociate in the gastrointestinal tract or inside any organs and can be excreted from the body as metal complexes.
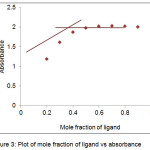 |
Figure 3: Plot of mole fraction of ligand vs absorbance |
Characterization of [Cu(PTMN)ClH2O] and [Co(PTMN)ClH2O]
UV-Vis Spectrum
The UV-Visible spectrum of ligand showed absorption of 342, 398 and 491 nm, and the spectra were shifted to a longer absorbance (Hyperchromic shift). The shifted of the spectrum occurred because of LMCT transition upon coordination.20 [Cu(PTMN)ClH2O] complex displayed absorption peak at 318, 368 and 414 nm. These are assigned to n – π*, π – π* and d-d transition respectively. The spin allowed (d-d) transition band is proposed to 2B1g→2A1g transition.21 [Co(PTMN)ClH2O] complex exhibited absorption peak at 272, 401 and 419 nm. These can be identified as n – π*, π – π* and 4A2→4T1 transition respectively.
![Figure 4: UV-Vis spectrum of PTMN, [Cu(PTMN)ClH2O] and [Co(PTMN)ClH2O]](https://www.orientjchem.org/wp-content/uploads/2018/06/Vol34No3_Syn_Par_fig4-150x150.jpg) |
Figure 4: UV-Vis spectrum of PTMN, [Cu(PTMN)ClH2O] and [Co(PTMN)ClH2O] |
Mass Spectral Data
The mass spectrum of [Cu(PTMN)ClH2O] exhibited a dominant peak at m/z 434 which depicted evidence of [M+2] ionization value. The [Co(PTMN)ClH2O] mass spectrum showed a dominant peak at m/z 429 which indicated [M+2] peak.
FTIR Spectral Data
The FTIR stretching frequencies of ligand (PTMN), [Cu(PTMN)ClH2O] and [Co(PTMN)ClH2O] complexes are compared in the table below.
Table 1: IR stretching frequencies of PTMN, [Cu(PTMN)ClH2O] and [Co(PTMN)ClH2O] complexes
| Compound | Stretching frequencies | ||||
| VCH=N | VM-N | VM-O | VOH/H2O | ||
| PTMN | 1602 cm-1 | – | – | – | |
| [Cu(PTMN)ClH2O] | 1635 cm-1 | 478 cm-1 | 690 cm-1 | 3284 cm-1 | |
| [Co(PTMN)ClH2O] | 1620cm-1 | 428 cm-1 | 536 cm-1 | 3132 cm-1 |
FTIR spectrum exhibited new bands at 690 cm-1 and 536 cm-1 which were assigned to VM-O for Cu(II) and Co(II) complexes respectively. These indicate that the oxygen were involved in coordination with metal ions. The azomethine group (-N=CH-) stretching frequency for [Cu(PTMN)ClH2O] and [Co(PTMN)ClH2O] complexes shifted slightly to a higher values into 1635 cm-1 and 1620 cm-1 respectively. These suggest that PTMN ligand is coordinated through ̶ N=C ̶ to the metals and also confirm that all metals coordinated directly to N atom of tetrazole moeity. Peak at 3200 – 3400 cm-1 indicated the presence of H2O molecule.
![Figure 5: IR spectrum of PTMN, [Cu(PTMN)ClH2O] and [Co(PTMN)ClH2O]](https://www.orientjchem.org/wp-content/uploads/2018/06/Vol34No3_Syn_Par_fig5-150x150.jpg) |
Figure 5: IR spectrum of PTMN, [Cu(PTMN)ClH2O] and [Co(PTMN)ClH2O] |
Thermal Analysis (TGA/DTA)
Thermogravimetric analysis (TGA) curve of [Cu(PTMN)ClH2O] showed percentage of weight loss. The beginning process of decomposition (first stage) was started at 187°C. It is exhibited the decomposition of coordinated water, chloride and partial decomposition of ligand at 225°C. The second stage showed the 50.4% weight loss which is due to the total loss of ligand at 300-480°C. DTA data presented that the first stage was an exothermic reaction at tmin=187°C which is related to the explosive matter or pyrolytic nature of tetrazole imine base moiety. The remaining residue was 28.8% corresponding to the metal oxide formation.
![Figure 6: TGA and DTA curve of [Cu(PTMN)ClH2O]](https://www.orientjchem.org/wp-content/uploads/2018/06/Vol34No3_Syn_Par_fig6-150x150.jpg) |
Figure 6: TGA and DTA curve of [Cu(PTMN)ClH2O] |
Thermo-gravimetric analysis (TGA) data for [Co(PTMN)ClH2O] showed percentage of decomposition. In the beginning process started from 200°C. It was observed as weight loss of water, chloride and partial decomposition of ligand. This loss was analyzed as an endothermic reaction through DTA data at tmin = 227oC. The second stage exhibited total exothermic decomproperties of tetrazole metal oxide re osition of ligand around 330oC-500oC. This peak can be assumed as pyrolytic p imine base moiety. The percentage of the last residue is 18.9% corresponds to sidue.
![Figure 7: TGA and DTA curve of [Co(PTMN)ClH2O]](https://www.orientjchem.org/wp-content/uploads/2018/06/Vol34No3_Syn_Par_fig61-150x150.jpg) |
Figure 7: TGA and DTA curve of [Co(PTMN)ClH2O]
|
SEM and EDX Studies
Scanning Electron Microscope (SEM) was performed to exhibit the surface morphology of PTMN ligand and its complexes. The morphology of PTMN ligand is viewed as coral form with the resolution of 1mm. There is a noticeable change in the morphology of the PTMN ligand due to the coordinated metal ions. The surface morphology of [Cu(PTMN)ClH2O] appeared more roughness than [Co(PTMN)ClH2O] by the image of 100µm and 1 µm respectively. The biological activity results ntimicrobial potential compared size.
![Figure 8: SEM Image of (a) PTMN ligand (b) [Cu(PTMN) ClH2O] (c) [Co(PTMN)ClH2O]](https://www.orientjchem.org/wp-content/uploads/2018/06/Vol34No3_Syn_Par_fig8-150x150.jpg) |
Figure 8: SEM Image of (a) PTMN ligand (b) [Cu(PTMN) ClH2O] (c) [Co(PTMN)ClH2O] |
On the other hand, Energy Dispersive X-Ray (EDX) analysis was carried out to identify elements in ligand and its metal complexes. EDX analysis results showed the existence of metalioes. Iti’s confirmed that the formation between liganda.
![Figure 9: EDX spectrum of (a) PTMN ligand (b) [Cu(PTMN) ClH2O] (c) [Co(PTMN)ClH2O]](https://www.orientjchem.org/wp-content/uploads/2018/06/Vol34No3_Syn_Par_fig9-150x150.jpg) |
Figure 9: EDX spectrum of (a) PTMN ligand (b) [Cu(PTMN) ClH2O] (c) [Co(PTMN)ClH2O] |
The chemical composition obtained by Energy Dispersive X-Ray (EDX) analysis on PTMN ligand indicated mainly C, N, and O (fig. 9.a). When the ligand coordinated with metals to form complexes, EDX analysis showed the appearance of Cu(II) and Co(II) spectrum. The analysis exhibited the spectrum of Cl element on each complex, signified that the metal ions have four binding sites.
Table 2: Chemical composition based on EDX analysis.
| Name of Compound | Element | Weight% | Atomic% | |
| C K | 45.8 | 50.21 | ||
| N K | 44.18 | 41.54 | ||
| Ligand | O K | 10.02 | 8.25 | |
| Totals | 100.00 | |||
| [Cu(PTMN)ClH2O] | ||||
| C K | 21.92 | 41.84 | ||
| O K | 22.31 | 31.96 | ||
| Cl K | 21.3 | 13.77 | ||
| Cu L | 34.47 | 12.43 | ||
| Totals | 100.00 | |||
| C K | 87.55 | 127.39 | ||
| N K | -49.55 | -61.83 | ||
| [Co(PTMN)ClH2O] | O K | 14.99 | 16.37 | |
| Cl K | 20.99 | 10.35 | ||
| Co L | 26.02 | 7.72 | ||
| Totals | 100 |
Antimicrobial Activity Test
Antimicrobial activity test was determined by using disc diffusion method. The size of inhibition zone depends on how effective the compound by stopping the growth of the microba. The effectiveness of free ligand and metal complexes ac antimicrobial agent were tested against non-resistant strain of Gram positive (Bacillus subtilis and Staphylococcus aureus), Gram negative (Klebsiella pneumoniae, Pseudomonas aeruginosa and Escherichia coli) bacteria and yepda (Saccharomyces cerevisiae) on nutrient agar medium. The incubation was performed at 370C/24 hours.
Table 3: Inhibition zone diameter of PTMN [Cu(PTMN)ClH2O] and [Co(PTMN)ClH2O]
| Name of organisms | Inhibition Zone (mm) | ||
| PTMN (Ligand) | Cu(II) complex | Co(II) complex | |
| Bacillus subtilis |
3 |
6 |
4 |
| S. aureus |
4 |
12 |
8 |
| E. coli |
2 |
9 |
3 |
| K. pneumoniae |
2 |
8 |
4 |
| P. aeruginosa |
2 |
6 |
3 |
| Yepda | 2 | 6 | 4 |
The activity of [Cu(PTMN)ClH2O] and [Co(PTMN)ClH2O] complexes is relatively higher than free PTMN ligand revealed that the proper result may be due to the presence of Schiff base formation in the complexes. The following activity is arranged as: [Cu(PTMN)ClH2O] >[Co(PTMN)ClH2O] > PTMN. The results informed that the complexes possesses more ability to inhibit the growth of the microba which leads to the death of the microba. It is found that [Cu(PTMN)ClH2O] with more roughness surface showed more potential activity to inhibit the growth of microba compared to [Co(PTMN)ClH2O].
Conclusion
PTMN, [Cu(PTMN)ClH2O] and [Co(PTMN)ClH2O] complexes have been synthesized and characterized by various spectroanalytical method. Spectroanalytical studies revealed that the molecular mass of the ligand is 315 which is shown as m/z=316 (M+1) peak. It is an agreement with the addition of molecular mass of 1-phenyl-1H-tetrazol-5-amine,2-hydroxy-1-naphthaldehyde substracting with water molecule. Furthermore, UV-Vis, IR and 1H-NMR spectral data showed particular bonding which correspond to─N=CH─ , CH, OH and the presence of aromatic moiety in the PTMN ligand. Mass spectral data of [Cu(PTMN)ClH2O] and [Co(PTMN)ClH2O] exhibited the dominant peaks at 434 and 429 respectively. IR and UV-Vis bands of metal complexes revealed the occurance of metal-ligand interaction. By using all the data, it is suggested that Cu(II) and Co(II) form complexes with N─ and O─ binding sites of the PTMN ligand. Antimicrobial activity studies revealed that the presence of metal enhanced the activity than the free ligand due to the Schiff base formation of the complexes. The antimicrobial activity of [Cu(PTMN)ClH2O] is more potential than [Co(PTMN)ClH2O] complex.
Acknowledgements
The authors gratefully thank Institut Teknologi Sumatera, Department of Chemistry, Department of Microbiology and Department of Central Facilities for Research & Development (CFRD) Osmania University for providing facilities and financial support.
References
- Ma̧ kosza M. and Wojciechowski K. Heterocycles. 2014, 88, 75–101.
- Zhai C.; Zhao L.; Hao X.Y.; Shi Y.J; Xu D.; Yang Z.Y; Wang Z.K; Chen D.Y; Li Q.Y and Yang G.W. Inorg Chem Commun. 2017, 84, 150–2.
CrossRef - Němeček J.; Sychra P.; Macháček M.; Benková M.; Karabanovich G.; Konečná K.; Kavková V; Stolaříková J; Hrabálek A; Vávrová K; Soukup O; Roh J and Klimešová V.. Eur J Med Chem. 2017, 130, 419–32.
CrossRef - Łukowska-Chojnacka E.; Mierzejewska J.; Milner-Krawczyk M.; Bondaryk M. and Staniszewska M. Bioorganic Med Chem. 2016, 24, 6058–65.
CrossRef - Surendra Babu M.S.; Rao B.U.; Krishna V.; Mustafa S. and Rao G.N.; J Saudi Chem Soc. 2017, 21, 291–9.
CrossRef - Pandey S.; Agarwal P.; Srivastava K.; RajaKumar S.; Puri S.K.; Verma P.; J.K. Saxena; Sharma A; Lal J and Chauhan P.M.S. Eur J Med Chem. 2013, 66, 69–81.
CrossRef - Chermahini Z.J.; Chermahini A.N.; Dabbagh H.A. and Teimouri A. J Energy Chem. 2015, 24, 770–8.
CrossRef - Ponnuvel K.; Padmini V. and Sribalan R.A. Sensors Actuators, B Chem. 2016, 222, 605–11.
CrossRef - Frija L.M.T.; Alegria E.C.B.A.; Sutradhar M.; Cristiano M.L.S.; Ismael A.; Kopylovich M.N and Pombeiro A.J.L. J Mol Catal A Chem. 2016, 425, 283–90.
CrossRef - Faria J.V.; Dos Santos M.S.; Bernardino A.M.R.; Becker K.M.; Machado G.M.C.; Rodrigues R.F.; Cavalheiro M.M.C and Leon L.L. Bioorganic Med Chem Lett. 2013, 23, 6310–2.
CrossRef - Al-Majidi S.M.H. J Saudi Chem Soc. 2014, 18, 893–901.
CrossRef - Harit T.; Bellaouchi R.; Mokhtari C.; El Bali B.; Asehraou A. and Malek F. Tetrahedron. 2017, 73, 5138–43.
CrossRef - Pan J.; Jiang F.L.; Wu M.Y.; Chen L.; Wan X.Y.; Yang Y.; Xue H; Yu M.X and Honget M.C. Inorg Chem Commun. 2015, 56, 129–32.
CrossRef - Palreddy R; Mohmed J; Narsimha N; Aparna B and Mariyam. Journal of Materials Science and Chemical Engineering. 2015, 135, 45–59.
CrossRef - Bauer, A.W.; Kirby, W.M.M.; Sherris, J.C. and Turck, M. Amer. J. Clin. Pathol. 1966, 45, 493– 496.
CrossRef - H.M Irving and H.S Rossotti. J Chem Soc. 1952, 2904, 2904–10.
- Job, P. Ann. Chim.,1928, 9, 113-203.
- Joseph S. R.; Laura L. T.; Evan H. T. and David B. C. Angew Chem Int Ed Engl. 2013, 52, 11998–12013.
CrossRef - Furia, T.E. CRC Press, Boca Raton, Florida, USA. 1972.
- Jamil W.; Solangi S.; Ali M.; Khan K.M.; Taha M. and Khuhawar M.Y. Arab. J. Chem. 2015, 10, 1-8.
- Sivasankaran N.; Dasan A. and Joseyphus, R. S. J Saudi Chem Soc. 2012, 16, 83–88.
CrossRef
Accepted on: June 06, 2018


ISSN Online: 2231-5039

![]()


