Preparation and Characterization of Sulfated Zirconia from a Commercial Zirconia Nanopowder
 and Ria Armunanto
Department of Chemistry, Faculty of Mathematics and Natural Sciences, Universitas Gadjah Mada, Sekip Utara Bulaksumur, Yogyakarta, 55281, Indonesia.
Corresponding Author E-mail: karnawijaya@ugm.ac.id
DOI : http://dx.doi.org/10.13005/ojc/340348
Download this article as:
![]()
Sulfated zirconia (SZ) catalysts were prepared by impregnation from commercial zirconia nanopowder with different concentrations of sulfuric acid (0.2, 0.5, and 0.8 M) and calcination temperatures (600, 700, 800, and 900ºC). SZ catalysts were characterized by Fourier transform infrared spectroscopy (FTIR), X-ray diffraction (XRD), Transmission electron microscopy (TEM), Surface area analyzer (SAA), and acidity test by ammonia adsorption. FTIR showed that the modification of zirconia with sulfuric acid enhanced the catalysts acid sites which confirmed by acidity test and it also showed the 0.8 M SZ at 600 ºC was the optimal condition with the highest acidity value of 3.81 mmol/g. XRD showed that SZ crystalline structure was in a monoclinic phase and the intensity decreased with increasing concentration and decreasing calcination temperature.
KEYWORDS:Catalyst; Sulfated Zirconia; Solid Acid Catalyst; Zirconia
Introduction
The recent widely developed heterogeneous catalyst is catalysts which had a group of metal oxides such as zirconia (ZrO2). It has corrosion-resistant properties, strong chemical resistance, low thermal conductivity, not conduct electricity, and better thermal power than alumina.1 This material also has so potential in many applications such as hydrolysis, biodiesel production, pillared material, and often used for hydrocracking process.2-4 It was developed and used as a catalyst because it had double characteristics as a weak acid and base catalyst depend on the treatment process, so that is possible to be used in many catalytic reaction.4
ZrO2 catalyst could be used as an acid catalyst by modification process using acidic compounds such as sulfuric acid.5 The sulfated zirconia (SZ) material which obtained by modification process would produce a high acidic catalyst because of the formation many active sites of Brønsted and Lewis acid sites in the structure.6 Among many super acid solids, SZ is the most studied material because of its ability to catalyze with its higher acidity than other inorganic acids.
The catalytic properties of SZ catalyst depend on treatment methods, ZrO2 precursor, calcination temperature, sulfating agent, etc.7 Preparation of SZ catalyst could be done by various methods such as hydrothermal8 and sol gel methods.9 However, it has advantages and disadvantages to produce a good catalyst. In this study, ZrO2was chosen as catalyst because of its good material properties and characteristics. Preparation of SZ catalyst was done by wet impregnation method from commercial ZrO2 nanopowder and using sulfuric acid as sulfating agent. The different concentrations and calcination temperatures were investigated in this study in order to know the effect of its on SZ catalyst.
Experimental
Materials
The materials used in this study were commercial zirconia nanopowder (ZrO2 60-70 nm) from China (purity 99%), sulfuric acid (98%) from Merck, and ammonia (25%) from Merck.
Sample Preparation
Sulfated Zirconia (SZ) catalysts were prepared from 10 g of ZrO2 nanopowder added into 150 mL H2SO4 with different concentrations (0.2, 0.5, and 0.8 M) respectively, then stirred for 24 h. The different concentrations were performed to determine the effect of sulfuric acid concentration on zirconia. SZ catalysts were then dried in an oven at 100ºC for overnight, calcined with different temperatures (600, 700, 800, and 900ºC) for 4 h. After that SZ catalysts were crushed and sieved in a 250 mesh sieve. The different temperatures were conducted to learn the effect on SZ catalyst.
The acidity test of SZ was determined with ammonia adsorption by gravimetric method. The acidity value of ZrO2 nanopowder and sulfated ziconia were calculated by using the equation:

Sample Characterization
The SZ catalysts were characterized by Fourier transform infrared spectroscopy (FTIR, Shimadzu Prestige-21) in range 4000-500 cm-1 with a KBr disc technique. The presence of sulfate groups on ZrO2 was confirmed by FTIR. X-ray diffraction (XRD, Shimadzu XRD 6000) with Cu K radiation at 40 kV and 40 mA under space conditions. Crystallite size was determined using Scherrer formula with a shape factor (K) of 0.89: D = (0.9λ)/b cos θ, where D is the crystallite size (nm), λ is the radiation wavelength (0.154056 nm), θ is the diffraction peak angle and b is the corrected half-width at halfmaximum intensity (FWHM). Transmission electron microscopy (TEM, Hitachi H8100A) at 100 kV for confirming catalyst morphology. Surface area analyzer (SAA, Quantachrome NovaWin Series version 11.0). Sample was thoroughly outgassed for 4 h at 200°C, bath temp of 77.3 K, and equil time of 60/60 sec (ads/des) then the weight of the outgassed sample was that used in calculations. The specific surface area was calculated by applying the Brunauer–Emmett–Teller (BET) method.
Results and Discussion
FTIR Characterization
FTIR analysis showed the absorption band at 490-745 cm-1 were corresponded by the presence of Zr-O-Zr bond.10 The absorption band at 3400-3800 cm-1 showed the streching vibration of the O-H bond and the absorption band around at 1636 cm-1 corresponded to bending vibration of O-H bond.11 The spesific absorption band of SZ catalyst at 1120-1224 cm-1 characterized to symmetric streching vibration of SO42- bidentat species.12 This observation also indicated the presence of covalent S=O double bonds on surface sulfate groups at SZ which could effect the acidity of catalyst [13]. In Fig.1 showed SZ of 0.2 M and calcined at different temperatures did not clearly show the specific peak of sulfate groups. It was different from SZ of 0.5 M at 600ºC (Fig.2), it had showed the spesific peak of sulfate groups. SZ of 0.8 M at 600ºC (Fig.3) had the stronger sulfate groups specific peak than others. It showed that sulfate groups had impregnated on ZrO2well. However overall in this concentration variations, the peak of SO42- would appear at the higher concentration and disappear at higher calcination temperature. Sulfate groups of SZ had the important role in catalytic activity because it need the high acidity of catalyst reaction.14 The higher acidity would have an effect on the good catalytic reaction.
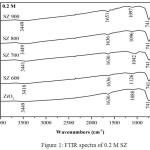 |
Figure 1: FTIR spectra of 0.2 M SZ
|
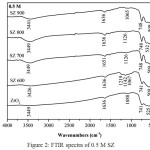 |
Figure 2: FTIR spectra of 0.5 M SZ |
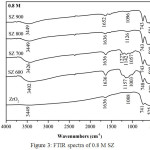 |
Figure 3: FTIR spectra of 0.8 M SZ |
Acidity Test
FTIR analysis of ammonia adsorption on solid surface could distinguish both the Brønsted acid sites and Lewis acid sites. Adsorption band at 1404 cm-1 was associated with NH3 adsorption on the Brønsted acid sites.15,16 Adsorption band around at 1119 cm-1 was associated with NH3 adsorption on the Lewis acid sites.17 In this study, acidity value for ZrO2 of 0.059 mmol/g and SZ of 0.8 M at 600ºC had the highest acidity as shown the acidity value in Table 1 as confirmed in Fig.6 from FTIR observation which had the stronger peak of NH3 adsorption than others (Fig.4 and Fig.5). The catalytic acidity would decrease at the higher calcination temperature and increase at the higher concentration. It was caused by sulfate groups loading on SZ catalysts which lost because of the higher calcination temperature. Modification of ZrO2 with sulfuric acid could enhance the acid strengh because of two factors i.e. the Brønsted acid sites from bridging Zr-OH groups and the Lewis acid sites from low cordinate Zr ions.18 It caused the SZ catalysts had the high acidity.
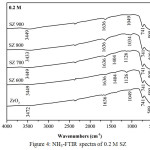 |
Figure 4: NH3-FTIR spectra of 0.2 M SZ |
 |
Figure 5: NH3-FTIR spectra of 0.5 M SZ |
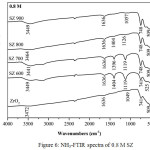 |
Figure 6: NH3-FTIR spectra of 0.8 M SZ |
Table 1: Acidity value of sulfated zirconia (SZ)
|
Sample |
Acidity value (mmol/g) |
|||
| 600ºC | 700ºC | 800ºC | 900ºC | |
| 0.2 M SZ | 0.47 | 0.23 | 0.12 | 0.06 |
| 0.5 M SZ | 0.94 | 0.59 | 0.41 | 0.29 |
| 0.8 M SZ | 3.81 | 1.47 | 0.71 | 0.12 |
XRD Characterization
XRD analysis of ZrO2 nanopowder and SZ catalysts at different calcination temperatures and concentrations were presented in Fig.7, Fig.8, and Fig.9. In this study overall the intensity of SZ catalysts increased with the increasing calcination temperature. It was due to lost sulfate groups loading which impregnated on ZrO2 nanopowder. At the different concentrations, intensity of SZ catallysts decreased with the increasing concentration. It caused the sulfate groups loading on ZrO2 at higher concentration as confirmed by FTIR. XRD analysis also showed the diffraction peak in crystal at 2θ = 24.7º, 27.5º, 31.0º, 49.2º were corresponded to monoclinic phase based on data JCPDS 88-2390. This experiment was conducted in order to know the effect of phase change on calcination temperature. But overall this study of SZ catalysts were in the monoclinic phase. ZrO2 had three phases of crystal structure i.e monoclinic phase under 1140ºC, tetragonal phase at 1140-2370ºC, and cubic phase above 2370ºC.19 Ejtemae et al.20 had reported the synthesis of SZ nanopowders with sol gel method and it found that tetragonal phase at 500ºC and was stabled at the higher temperature. However, all of the SZ synthesis process depend on the ZrO2 precusor to obtain the stable and active catalyst. The crystal sizes of SZ catalysts were calculated by using Scherrer equation and crystal size for ZrO2 and SZ were presented in Table 2. The results showed overall the crystallite size decreased with the addition of sulfate. However, the calculation depend on halfmaximum intensity of crystal peak.
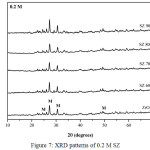 |
Figure 7: XRD patterns of 0.2 M SZ |
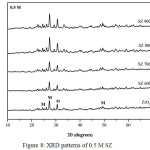 |
Figure 8: XRD patterns of 0.5 M SZ |
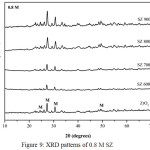 |
Figure 9: XRD patterns of 0.8 M SZ |
Table 2: Data of ZrO2 and SZ
|
Sample |
Crystallite size (nm) |
SBET (m2g-1) |
| ZrO2 | 27.32 | 12,27 |
| 0.2 M SZ 600 | 33.84 | – |
| 0.2 M SZ 700 | 32.74 | – |
| 0.2 M SZ 800 | 23.75 | – |
| 0.2 M SZ 900 | 29.78 | – |
| 0.5 M SZ 600 | 30.87 | – |
| 0.5 M SZ 700 | 22.76 | – |
| 0.5 M SZ 800 | 24.35 | – |
| 0.5 M SZ 900 | 24.76 | – |
| 0.8 M SZ 600 | 24.83 | 7,79 |
| 0.8 M SZ 700 | 19.67 | – |
| 0.8 M SZ 800 | 19.44 | – |
| 0.8 M SZ 900 | 24.69 | – |
The specific surface area of ZrO2 and SZ 0.8 M at 600ºC also were presented in table 2. The result showed the specific area of SZ decreased from ZrO2 nanopowder. It caused the sulfate groups loading entered into the pores of ZrO2 nanopowder at impregnation process. Chen et al.21 had also reported that the presence of sulfate at the higher concentration decreased surface area and phase transformation changed from tetragonal to monoclinic phase at the higher calcination temperature. This study showed that nothing changed phase transformation and it was unique from using commercial ZrO2 nanopowder. However, synthesis process also would effect the specific surface area, pore diameter, and pore volume of SZ catalysts.22
TEM Characterization
TEM analysis of ZrO2 and SZ of 0.8 M at 600ºC was shown in Fig.10. In this study, TEM analysis showed the presence of particles agglomeration on SZ of 0.8 M calcined at 600ºC. It could happen because of the heat treatment.11 The sulfuric acid addition on ZrO2 enhance the dark spots which observed from SZ. It happened because of impregnated sulfate on ZrO2 material which covered and entered to the ZrO2 pores.
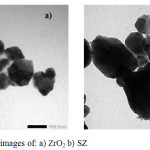 |
Figure 10: TEM images of: a) ZrO2b) SZ |
Conclusion
Preparation of SZ catalyst obtained the optimal condition of 0.8 M at 600ºC with the highest acidity value of 3.81 mmol/g as confirmed by FTIR spectra. The peak of SO42- appear at the higher concentration and disappear at higher calcination temperature. The XRD results showed that the SZ crystalline structure was in a monoclinic phase and overall the crystal size decreased with the addition of sulfate. The SAA showed the specific area of SZ decreased from ZrO2 nanopowder i.e 7.79 m2g-1. TEM analysis showed the particles agglomeration on SZ of 0.8 M calcined at 600ºC.
Acknowledgment
This research was supported by the Indonesia Ministry of Research, Technology, and Higher Education under program of PMDSU Batch II (Contract number: 1979/UN1.P.III/DIT-LIT/LT/2017).
References
- Yadav, G. D.; Nair, J. J. Microporous Mesoporous Mater. 1999, 33, 1–48.
CrossRef - Kristiani, A.; Corneliasari, K.; Aulia, F.; Abimanyu, H. Energy Procedia. 2015, 65, 8-13.
CrossRef - Fatimah, I.; Rubiyanto, D.; Kartika, N. C. Indones. J. Chem. 2016, 16, 8–13.
CrossRef - Omar, W. N. N. W.; Amin, N. A. S. Biomass and Bioenergy. 2011, 35, 1329–1338.
CrossRef - Zhai, Y.; Zhang, H.; Hu, J.; Yi, B. J. Memb. Sci. 2006, 280, 148–155.
CrossRef - Saravanan, K.; Tyagi, B.; Bajaj, H. C. Applied Catal. B, Environ. 2016, 192, 161–170.
CrossRef - Reddy, B. M.; Patil, M. K. Chem. Rev. 2009, 109, 2185-2208.
CrossRef - Yu, S.; Jiang, P.; Dong Y.; Zhang, P.; Zhang, Y.; Zhang, W. Bull. Korean Chem. Soc. 2012, 33, 524–528.
CrossRef - Li, B.; Gonzalez, R. D. Ind. Eng. Chem. Res. 1996, 35, 3141–3148.
CrossRef - Heshmatpour, F.; Aghakhanpour, R. B. Adv. Powder Technol. 2012, 23, 80–87.
CrossRef - Said, A. E. A.; El-wahab, M. M. A.; El-aal, M. A. Journal Mol. Catal. A, Chem. 2014, 394, 40–47.
CrossRef - Babou, F.; Coudurier, G; Vedrine, J. C. J. Catal. 1995, 152, 341–349.
CrossRef - Jin, T.; Yamaguchi, T.; Tanabe, K. J. Phys. Chem. 1986, 90, 4794–4796.
CrossRef - Katada, N.; Endo, J.; Notsu, K.; Yasunobu, N.; Naito, N. J. Phys. Chem. 2000, 104, 10321–10328.
CrossRef - Sohn J. R.; Bae, J. H. Korean J. Chem. Eng. 2000, 17, 86–92.
CrossRef - Jiang, K.; Tong, D.; Tang, J.; Song, R.; Hu, C. Applied Catal. A, Gen. 2010, 389, 46–51.
CrossRef - Utami, M.; Wijaya, K.; Trisunaryanti, W. Key Eng. Mater. 2017, 757, 131–137.
CrossRef - Kustov, L. M.; Kazansky, V. B.; Figueras, F.; Tichit, D. J. Catal. 1994, 150, 143-149.
CrossRef - Subbarao, E. C.; Maiti, H. S.; Srivastava, K. Pyhs. Stat. Sol. 1974, 21, 9-40.
CrossRef - Ejtemaei, M.; Tavakoli, A.; Charchi, N.; Bayati, B.; Babaluo, A. A.; Bayat, Y. Adv. Powder Technol. 2014, 25, 840–846.
CrossRef - Chen, F. R.; Coudurier, G.; Joly, J.; Vedrine, J. C. J. Catal. 1993, 143, 616–626.
CrossRef - Nayebzadeh, H.; Saghatoleslami, N.; Maskooki, A.; Vahid, B. R. Chem. Biochem. Eng. Q. 2014, 28, 259–265.
CrossRef
Accepted on: March 31, 2018


![]()


