Optimization of A Two-Step Method to Synthesize Azelaic Acid from Oleic Acid
Z. Masyithah1 and A. Ginting2
1Department of Chemical Engineering, Faculty of Engineering, Universitas Sumatera Utara, Jalan Almamater, Medan 20155, Indonesia.
2Department of Mechanical Engineering, Faculty of Engineering, Universitas Sumatera Utara, Jalan Almamater, Medan 20155, Indonesia.
Corresponding Author E-mail: zuhrina@yahoo.com
DOI : http://dx.doi.org/10.13005/ojc/340307
Download this article as:
![]()
The present study deals with the oxidative cleavage of oleic acid (OA) using hydrogen peroxide and tungstic acid as a catalyst to produce azelaic acid. A two-step method has been expanded for the optimization of a new route of azelaic acid synthesis with the addition of sodium hypochlorite as the co-oxidation. The Central Composite Design (CCD) and Response Surface Methodology (RSM) were performed to optimize the production of azelaic acid. The interaction effect among catalyst concentration, substrate molar ratio and temperature were done for optimization the conversion of oleic acid. Maximum oleic acid conversion of 99.11% was reached at substrate molar ratio of 4/1 (H2O2/OA), a catalyst concentration of 1.5% (w/wOA) and temperature of 70oC. The GC analysis shows that the yield of azelaic acid is 44.54% and pelargonic acid is 34.12%. These results indicate that the proposed process show a good strategy for the synthesis of azelaic acid from oxidative cleavage of oleic acid.
KEYWORDS:Azelaic Acid; Tungstic Acid; Hydrogen Peroxide; Sodium Hypochlorite; Response Surface Methodology
Introduction
Azelaic acid and pelargonic acid can result from oxidative cleavage a double bond of oleic acid using an oxidizer and catalyst. The azelaic acid has anti-inflammatory and anti-bacterial properties so that azelaic acid has widely used in the pharmaceuticals industry as an anti-acne agent and stimulator of hair growth [1,2]. In commercial usage, the azelaic acid is also widely used in polymers industry as a polyester, polyamides, and polyurethane layers compounds [3,4]. Not only the azelaic acid, pelargonic acid can also be produced in this oxidation-breakdown reaction. No less functional with azelaic acid, pelargonic acid is also in demand in the Bio-Lubricant industry as a plasticizer, perfume, fungicide, and resin [5,6].
Industrially, the azelaic acid is produced by oleic acid oxidizing by an ozonolysis method to break the double bond of the carbon chain and this process needs the high temperature and pressure [4,7,8]. The use of the ozone and oxygen at high temperature and pressure poses a big risk of burning, exploding and uneconomical [6]. Therefore it is important to find a new method, which is safer and more economical than the ozone method.
The oxidative cleavage of the double bond of unsaturated fatty acid requires the oxygen that is added to the substrate. Oxidants such as sodium periodate, peroxomonosulfate, para-acetate acid and tertbutyl hydroperoxide are often used in this reaction because they are strong oxidizing reagents even without the addition of transition metals but produce unsustainable waste [3,9]. Hydrogen peroxide (H2O2) is an attractive alternative oxidant because it does not produce waste at the end of the reaction but almost requires transition metal to be able to oxidize substrates with maximum [10,11].
Hydrogen peroxide is an oxidant with a high amount of active oxygen, which is very safe in storage and usage and also easy to obtain [12,13]. In using it, hydrogen peroxide firstly needs to activation to increase its oxidizing strength [14]. Activation of hydrogen peroxide can be done through the formation of peroxy compounds and the addition of the catalyst. The useable catalysts among others manganese (Mn), tungstic acid (H2WO4) and methyltrioxorhenium (MeReO3) [15]. The tungstic acid is a suitable catalyst for oxidizing agent and more environmentally friendly than tungstate phosphor acid, so the use of tungstic acid as a catalyst needs to be further studied [9, 15].
Synthesis of azelaic acid using hydrogen peroxide and tungstic acid catalyst on 70oC requires a relatively long time, about 8 hours [6]. This method is less effective because it requires a lot of energy so that the process can be quite expensive. There is a more effective way in which it can reduce energy used by providing additional oxidizing. An oxidizing agent that can be used as a hydrogen peroxide oxidizing agent is sodium hypochlorite (NaOCl). Sodium hypochlorite is highly stable and is a strong oxidizing agent. Sodium hypochlorite may oxidize alcohols, aldehydes, alkenes, and amines and also be good as oxidation pairs in the oxidation process [2].
In this paper, the oxidative cleavage of unsaturated oleic acid by the H2O2-H2WO4-NaOCl system is presented. The RSM associated with CCD is utilized to study the effect of adding co-oxidant and other changing variable process of the azelaic acid resulted, and to get a mathematical model that accurately describes the process. RSM is a mathematical technique and empirical statistics which are used to build a significant relationship between a set of experimental factors that are controlled with one or more variables by conducting a number of experiments [16,17]. The RSM has been selected to use in this study due to its capability in considering several factors simultaneously at many different levels and corresponding interaction among these factors using a limited number of experiments [18,19].
Materials and Methods
Materials
Oleic acid (C18H34O2), tungstic acid (H2WO4), ethyl acetate (C4H8O2), hydrogen peroxide (H2O2), and sodium sulfate (Na2SO4) where purchased from E. Merck (Darmstadt, Germany), while sodium hypochlorite (Na2ClO3) from Sigma Aldrich. The resulted product will be titrated by iodometry where the ingredients using chloroform (CHCl3), potassium iodide solution (KI 15%), Wijs reagent, sodium thiosulfate (Na2S2O3) and starch indicator.
Two Stage Oxidative Method
Azelaic acid was prepared by the method [6] as described below. In a conical flask by heating on a hot plate with mineral oil, a suitable amount of tungstic acid (0.65-2.34 w/wOA) was suspended in an aqueous solution of H2O2 (2.3-5.7 mol/mol OA) and the system was shaken at 200 rpm and 70oC. Oleic acid with an amount of 1 mol was added at the time of a complete dissolution of tungstic acid observed and after 2 hours, the blend was cooled to room temperature. The sodium hypochlorite (0.5 mol/mol OA) was added and the system was stirred vigorously for 2 hours at room temperature and then the mixture was extracted with hot ethyl acetate with the volume of 4 x 100 ml. The organic layer of the mixture is dried by adding anhydrous sodium sulfate until saturated and evaporated under vacuum pressure. Iodine number was calculated by AOAC [20] standard method. The products obtained were characterized by recording the FT-IR spectra of the compound on an FT-IR instrument series 1100 from Perkin Elmer and were analyzed with GC from Shimadzu GC-2010.
Optimization Procedure
Central Composite Design (CCD) method of 2k factorial designs with the addition of central run and axial run was utilized [17]. In order to obtain the rotatability CCD design, each experimental factor was represented by five levels with the encoding units -α, -1, 0, 1, α and by ensuring the variations were at equidistant points and yielding the same design estimation response estimation in all directions.
The resulted data was analyzed by RSM using Minitab 17 software to form the relationship between variables that can be determined by regression analysis. The significant variables then were defined using Analysis of Variance (ANOVA). ANOVA implicated Fischer’s test to estimate the overall significance of the model, associated ‘P’ values and determination coefficient R2 was used to determine the regression model’s goodness of fit [18,19].
Result and Discussion
The azelaic acid is produced by oxidative breaking process of oleic acid with a hydrogen peroxide using tungstic acid as a catalyst and added sodium hypochlorite to make the reaction time shorter. The major factors that can affect the oxidative cleavage process are the substrate molar ratio, catalyst concentration, the mass of sodium hypochlorite, temperature, reaction time, and stirring speed [7,9]. Three factors are then selected as the independent variables; they are catalyst concentration (w/wOA), substrate molar ratio (H2O2/OA), and temperature (oC). While as the response variable is oleic acid conversion. Converted oleic acid is obtained from a percentage decrease in iodine number. Where iodine number denotes the number of double bonds contained in the sample.
Model Fitting with RSM
RSM Approach and analysis of variance ANOVA has conducted for second-order response surface model. The factorial design used to investigate the influence of the independent variables and the responses as actual oleic acid conversion are summarized in Table 1. Analysis of variance for the model that represents the relationship between oleic acid conversions with the three variables is given in the previous study [21]. Polynomial fitting regression was performed with oleic acid conversion (Y) as the dependent variable and catalyst concentration (X1), substrate molar ratio (X2), and temperature (X3) as the independent variables. The regression equation was established as follows: Y= – 0.5823 X1 + 6.5737 X2 + 2.1639 X3 – 1.1597 X12 – 7.8297 X22 – 5.1797 X32 – 0.7354 X1X2 – 0.9405 X1X3 + 0.9475 X2X3.
The predicted coefficient and the corresponding P-values indicate that the substrate molar ratio and the temperature had a positive and significant effect on the conversion of oleic acid (P<0.05), while the catalyst concentration did not give a significant effect (P>0.05) on the acquisition of azelaic acid. The negative sign in the equation shows a relationship that is inversely proportional to the response variable (oleic acid conversion), whereas according to Kerenkan et al. [15] the factors affecting the conversion of azelaic acid synthesis are the molar ratio of the substrate and catalyst concentration. In this model, the catalyst concentration does not give a significant effect because the range value entered at the level is higher than the optimal values so that the catalyst concentration has exceeded the optimum limit.
The reliability analysis of the regression equation shows that the experimental data of the model is reliable to explain and to explain the model [16, 22]. The value of R2 of 89.95% indicates that the specified variable in the model does not give the maximum effect because 10.05% is represented by other variables. The variable that is influential but not used to be the independent variable in the model is the addition of sodium hypochlorite. Added sodium hypochlorite affects the reaction time and conversion of the azelaic acid [6]. This is evidenced by a synthesis that can run well with a percent conversion of oleic acid over 90%. So it can be concluded the addition of sodium hypochlorite give some affection value to response variables, and conversion of oleic acid into pelargonic acid and oleic acid was significant within 4 hours.
Normal probability and probability of independence used to verify residual compliance with the required assumptions. Normal probability plot for the conversion of oleic acid is shown in Figure 1. Distribution points around the diagonal line represent that the distribution of data is normal [23]. The probability of independence aims to determine whether between independent variables are correlated. From the plot in Figure 2, it shows that the distribution of residual data versus order observation tends to be random and not patterned, so it can be said that the assumption of independence is fulfilled.
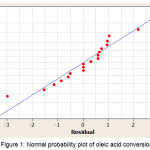 |
Figure 1: Normal probability plot of oleic acid conversion |
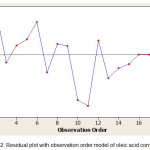 |
Figure 2: Residual plot with observation order model of oleic acid conversion |
Interaction Effect and Optimization Process
The interaction of catalyst concentration and substrate molar ratio is shown in the responses contour plots in Figure 3. At the reaction temperature of 70°C it is seen that if the catalyst is maintained at a certain amount and the substrate molar ratio increased, it will increase the converted oleic acid. If the catalyst increased at the substrate ratio is maintained constant, this treatment is a very small effect on the converted of oleic acid.
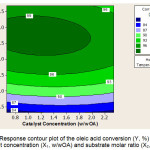 |
Figure 3: Response contour plot of the oleic acid conversion (Y, %) according to catalyst concentration (X1, w/wOA) and substrate molar ratio (X2, H2O2/OA) |
The increases of the catalyst do not seem to provide an advantage over the performance of the catalyst, so the effect is not so much on the conversion of azelaic acid. Observations on the contour plot showed that the variable interaction of catalyst amount and substrate molar ratio at 70oC was optimum at 1% (w/wOA) catalyst concentration and 4.7/1 (H2O2/OA) of substrate molar ratio. As the result reported in [6], it is observed in this study that the increasing the catalyst loading has not impacted the performance of the catalyst. The yield of azelaic acid and pelargonic acid do not present any appreciable changes. It can be concluded that 1% (w/wOA) catalyst is considered as a fair percentage of an acceptable reaction rate and minimization of the catalyst loading. It should be noted that this level of the catalyst concentration is 7 times lower (based on W atoms) than in a recent study based on phosphotungstic acid.
The interaction effect of substrate molar ratio and reaction temperature to oleic acid conversion in Figure 4 shows that the increase of substrate molar ratio more influence to increase the conversion than the reaction temperature, at a fixed catalyst concentration 1.5 (w/wOA). The contour plot also shows that if the reaction temperature is maintained at a certain value and the substrate molar ratio is increased, it will be able to increase the percent conversion of oleic acid. The increase in conversion indicated that the hydrogen peroxide enhances the performance of the system. However, if the reaction temperature is increased while the substrate molar ratio is maintained constant, this treatment gives a smaller effect on the conversion of oleic acid.
This result has been compatible with the theory that increased temperature or pressure will make the oxygen molecules can speed up the oxidative cleavage process but the resulting yield will decrease [13]. The contour plot in Fig. 4 shows that the yield of azelaic acid increase with the amount of hydrogen peroxide but at the temperature more than 80oC, this condition could degrade the azelaic acid conversion at a fixed substrate molar ratio. The interaction of substrate molar ratio and reaction temperature gives the best result at a 4.5/1 (H2O2/OA) of substrate molar substrate ratio and 72oC of reaction temperature.
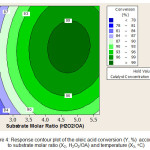 |
Figure 4: Response contour plot of the oleic acid conversion (Y, %) according to substrate molar ratio (X2, H2O2/OA) and temperature (X3, oC) Click here to View figure |
The interaction effect of catalyst concentration and reaction temperature to oleic acid conversion is shown in the contour plot in Figure 5. It appears that at a fix 4/1 (H2O2/OA) substrate molar ratio, the reaction temperature shows a more significant change comparing to the catalyst concentration. The contour plot shows that if the reaction temperature is maintained at a point and the catalyst concentration is increased this treatment has a smaller effect on the conversion of oleic acid. Conversely, if the catalyst concentration maintained constant and the reaction temperature is increased, there will be an increase in the conversion of oleic acid. It can be concluded that the reaction temperature is more influential than the catalyst concentration.
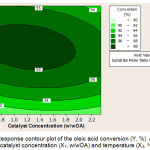 |
Figure 5: Response contour plot of the oleic acid conversion (Y, %) according to catalyst concentration (X1, w/wOA) and temperature (X3, oC) Click here to View figure |
Oxidation of hydrogen peroxide in a two-step method, using a catalyst and under atmospheric pressure, will be optimal at a temperature range of 60°C to 80°C [15]. The temperature of 70oC is an effective temperature, not only to get a good reaction rate but also to make the oil turn out to be more dilute so it is easier to experience the reaction [8]. In addition to avoiding substrate losses and catalysts required a temperature that is not too high [3]. The interaction of catalyst concentration and reaction temperature will obtain the higher oleic acid conversion at 1.45% (w/wOA) catalyst concentration and 70oC of reaction temperature.
In order to verify the model, the conversion of oleic acid predicted then is compared to the conversions obtained in the actual experiment as shown in Figure 6. As it can be seen from the figure, the predicted conversion are in good agreement with the experimental results, hence the model was further used for performing the set of experiments [22]. It also is shown that the actual conversion is slightly higher than predicted conversion. The difference is due to the insignificant variable using the experiment so that the oleic acid conversion in the model gets smaller than actual oleic acid conversion.
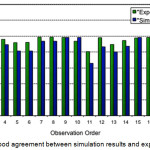 |
Figure 6: Good agreement between simulation results and experimental results |
Qualitative and Quantitative Analysis
Identification with FT-IR
The spectroscopy identification is used for identifying the molecular structure of a compound. The azelaic acid has the absorption peak at 3365.23 cm-1 for OH bond, 2830 cm-1 spectrum for CH bond, 1634.71 cm-1 spectra for C = O bond and on spectrum 1430 cm-1 of CO bond. It is clear that there is no double bond on the C atom because the titration of iodine in this run also shows that the converted oleic acid is 99.11%. The peak of the dicarboxylic acid in oleic acid present in the spectra 1707.88 cm-1 undergoes a shift or decrease of the stretching force on the azelaic acid where the spectrum in azelaic acid becomes 1634.71 cm-1 [7]. The absence of double bonds in azelaic acid proves that there has been an oxidative breaking process in which double bonds in oleic acid have been disconnected.
GC Analysis
Samples were analyzed with chromatography gas instrument to determine the quantitative and qualitative of azelaic acid by the addition of the sodium hypochlorite oxidizing agent. The yield of azelaic acid yield is 44.53% then there is also oleic acid compound, pelargonic acid and also some ester compound. The spectrum also shows that there is a small amount of methyl ester and methyl oleate, in which there are various products in small quantities besides azelaic acid and pelargonic acid. The methyl ester compound is an intermediate product which is thought to be formed due to a nucleophilic H2O2 attack and cannot be investigated because the hydroxy peroxy stearic acid methyl ester compound has an unstable reaction [8].
Conclusion
From the study of the new route of azelaic acid synthesis from oleic acid with the addition of sodium hypochlorite, it can be concluded that the actual model produced by RSM representing the catalyst concentration (X1), the substrate molar ratio (X2) and the reaction temperature (X3) and its interaction to conversion of oleic acid is acceptable with determination coefficient value (R2) of 89.95%. The catalyst concentration and the substrate molar ratio had a significant effect on the conversion produced. Synthesis of azelaic acid with the addition of sodium hypochlorite can be said to be more effective because it produces high yields and shorter reaction times. To summarize, the results prove the capability of the proposed method as an alternative procedure to oxidative cleavage of oleic acid to azelaic acid using sodium hypochlorite as a co-oxidation.
Acknowledgment
The financial support from Universitas Sumatera Utara through grant no. 5338/UN5.1.R/PPM/2017 is acknowledged. Thank is addressed to Ms. M.P. Sihombing and Ms. L.V. Tohang for the laboratory works.
References
- Mazurek, K.; Pierzchala, E.J. Cosmet. Dermatol. 2016, 15, 269-282
CrossRef - Burchacka, E.; Potaczek, P.; Paduszynsi, P.; Karlowiz-Bodalska, K.; Han, T.; Han, S. Biomed. Pharmacother. 2016, 83, 771-775
CrossRef - Godard, A.; Caro, P.D.; Thiebaud-Roux, S.; Vedrenne, E.; Mouloungui, Z. J. Am. Oil Chem. Soc. 2013, 90, 133-140
CrossRef - Angela, K.; Martin, A. Eur. J. Lipid Sci. Technol. 2011, 113, 83-91
CrossRef - Rani, M.Z.A.; Asim, N.; Lazim, N.A.; Badiei, M.; Yarmo, M.A. Eur. J. Appl. Eng. Sci. Res. 2008, 24, 428-432
- Benessere, V.; Cucciolito, M.E.; Santis, A.D.; Serio, M.D.; Esposito, R.; Ruffo, F.; Turco, R. J. Am. Chem. Soc. 2015, 92, 1701-1707
- Kadhum, A.A.H.; Wasmi, B.A.; Mohamad, A.B.; Al-Amiery, A.A.; Takriff, M.S. Res. Chem. Intermed. 2012, 38, 659-668
CrossRef - Tavassoli-Kafrani, M.H.; Foley, P.; Kharraz, E.; Curtis, J.M. J. Am. Oil. Chem. Soc. 2016, 93, 303-310
CrossRef - Behr, A.; Tenhumberg, N.; Wintzer, A. RSC Adv. 2013, 3, 172-180
CrossRef - Lasch, R.; Fehler, S.K.; Heinrich, M.R. Org. Lett. 2016, 18, 1586-1589
CrossRef - Singh, J.V.; Awasthi, A.; Dipti; Tomar, A.; Singh, D.; Agarwal, G.L. Orient. J. Chem. 2012, 28, 1465-1478
- Nojori, R.; Aoku, M.; Sato, K. Chem. Commun. 2003, 16, 1977-1986
- Fujitani, K.; Manami, H.; Nakazawa, M.; Oida, T.; Kawase, T. Elsevier Masson SAS. 2009, 58, 629-637
- Ardjmand, M.; Omidi, M.; Choolaei, M. Orient. J. Chem. 2015, 31, 2291-2301
CrossRef - Kerenkan, A.E.; Beland, F.; Do, T.O. Elsevier Masson SAS. 2016, 6, 971-987
- Amini. Int. J. Eng., Trans. C. 2015, 28, 855-863
- Hosseini, S.; Tarzi, B.G.; Gharachorloo, M.; Ghavami, M.; Bakhoda, H. Orient. J. Chem. 2015, 31, 1223-1230
CrossRef - Devi, K.B.D.; Vijayalaskhmi, P.; Shilpa, V.; Prasad, T.V.S.S.L.; Kumar, B.V. Indian J. Sci. Technol. 2015, 8, 556-561
CrossRef - Zuhrina, M. Orient J. Chem. 2016, 32, 1361-1371
- AOAC. Official methods of analysis. Association of Chemical Analytical Chemist: Washington, DC. 1990
- Masyithah, Z; Sihombing, M.P.; Tohang, L.V. Jurnal Teknik Kimia USU. 2017, 6, 14-20
- Masyithah, Z.; Herawan, T. J. Pure. App. Microbiol. 2017, 11, 1327-1336
CrossRef - Alimirzaloo, V.; Modanloo, V. Int. J. Eng., Trans. B. 2016, 29, 264-273
Accepted on: March 31, 2018


ISSN Online: 2231-5039

![]()


