N-Doped TiO2/CdS Nanocomposite Films: SILAR Synthesis, Characterization and Application in Quantum Dots Solar Cell
Kristian Handoyo Sugiyarto, Cahyorini Kusumawardani and Anti Kolonial Prodjosantoso
Department of Chemistry Education, Yogyakarta State University, Yogyakarta, 55281, Indonesia.
Corresponding Author E-mail: sugiyarto@uny.ac.id
DOI : http://dx.doi.org/10.13005/ojc/340313
Article Received on : April 25, 2018
Article Accepted on : June 08, 2018
Article Published : 21 Jun 2018
The N-doped TiO2/CdS nanocomposite films have been prepared through a successive ionic layer adsorption and reaction (SILAR) method on the N-doped TiO2 thin films with cadmium nitrate as Cd source and sodium sulphide as S precursor. The SILAR cycle was varied to study the CdS layer formation and its influence to the properties of resulted nanocomposite, i.e. 1, 5, 10, 25, and 50 cycles, respectively. The resulting materials were characterized using X-Ray Diffraction (XRD), UV/Vis Spectroscopy, and Scanning Electron Microscopy (SEM). The result showed that the higher SILAR cycle resulted in a smaller CdS crystallite size and a higher band gap energy. The higher SILAR cycle was also provided the more intense response in visible light area. The prepared N-doped TiO2/CdS nanocomposite films were then applied in the quantum dots-sensitized solar cells (QDSSC) system. The solar cells performa test showed that there is an optimum cycle which resulting in a highest power conversion. The quantum dot solar cells based on N-doped TiO2/CdS nanocomposite prepared with 25 cycles provided the highest performa with overall efficiency of 8.3%. Thus, by varying the cycle number in the SILAR synthesis process, it is easy for tuning the nanocomposite properties that fulfill the requirements as sensitized-semiconductor material in the solar cell system.
KEYWORDS:CdS; N-doped TiO2; Nanocomposite; Quantum Dots; QDSSC SILAR
Download this article as:| Copy the following to cite this article: Sugiyarto K. H, Kusumawardani C, Prodjosantoso A. K. N-Doped TiO2/CdS Nanocomposite Films: SILAR Synthesis, Characterization and Application in Quantum Dots Solar Cell. Orient J Chem 2018;34(3). |
| Copy the following to cite this URL: Sugiyarto K. H, Kusumawardani C, Prodjosantoso A. K. N-Doped TiO2/CdS Nanocomposite Films: SILAR Synthesis, Characterization and Application in Quantum Dots Solar Cell. Orient J Chem 2018;34(3). Available from: http://www.orientjchem.org/?p=46804 |
Introduction
The solar light-to-electricity conversion by photovoltaic technology offers an ideal problem solving for currently energy crisis because of the highly dependent on fossil fuel energy. Beside its unrenewable source, the use of fossil energy results in many serious environmental problems worldwide.1 The dye-sensitized solar cells (DSSC) based on nanocrystalline TiO2 has established an alternative concept to conventional solar cells owing to its low-cost production and high conversion efficiency.2 DSSC system has successfully obtained an overall power conversion efficiency of 12%, but it is still having problems for commercial application due to the dye sensitizer and liquid electrolyte degradations causing the lower of solar cell efficiency and stability. The use of tandem semiconductors in the solar cells system became one of promising solutions to prevent the problems appeared from the dye degradation.3
Inorganic quantum dots (QDs) semiconductors can serve as sensitizer instead of dye followed by some advantages: high light absorption in the visible region, great stability, an effective band gap that can be controlled by the QDs size, the possibility for multiple exciton generation, and the utilize of hot electron whose having higher energy than TiO2 conduction band.4 The small band gap semiconductors such as CdS, CdSe or CdTe have been used to sensitize TiO2 in the QD-sensitized solar cells (QDSSC) and has successfully increased the visible light absorption of TiO2. Among those QDs, CdS has been receiving much attention because it has a high established relationship between the optical absorption and the size of the particle.5 The QDSSC conversion efficiency has reach around 8% at present,6 being lower than the DSSC efficiency but it is highly potential to increase the efficiency of the QDSSC system by tuning several properties of quantum dots. In order to be applied in the solar cell system, it is desirable for preparing semiconductor nanoparticles which have appropriately functionalized with different size and optical properties.
The QDSSC based on wide band gap semiconductors, such as TiO2, has demonstrated a promising commercial technology in solar cell application. However, TiO2 is not ideal semiconductor for solar cell photoanode due to its nature intrinsic band gap (around 3-3.4 eV) which means TiO2 has a weak absorption of visible light7. Doping TiO2 is one of the most promising approaches to increase its visible light response. Asahi et al.8 firstly reported that N-doped TiO2 films prepared by sputtering method showed significance visible light absorption at wavelengths less than 500 nm related to the band gap narrowing by mixing of N 2p states with O 2p states. The application of N-doped TiO2 in the DSSC has significantly improved the efficiency and stability of DSSC.9,10
So far, both doping of TiO2 and quantum dot sensitization have been explored separately for solar cells applications, while combining the two approaches has not been reported yet. In this work, we develop CdS quantum dot sensitization with nitrogen-doping of TiO2 and its application in QDSSC system. In N-doped TiO2/CdS nanocomposite, CdS acts as a visible sensitizer and N-doped TiO2 being a wide band gap semiconductor that is responsible for the charge separation process. Therefore, the prepared N-doped TiO2/CdS nanocomposites thin films can effectively capture the visible light and transfer the photogenerated electrons into the N-doped TiO2 conduction band, and started the electrical flows. In this work, the N-doped TiO2/CdS nanocomposite films have been fabricated by the successive ionic layer adsorption and reaction (SILAR) method as a relatively simple technique for large scale uniform coating to produce clean, dense and strong adhesion to substrate thin films.
Materials and Methods
Materials
Cd(NO3)2.10H2O, (NH4)2S, ethanol absolute, acetyl acid glacial from Merck, Titanium Tetraisopropoxide from Aldrich, Dodecylamine from Fluka, ITO and electrolyte redox from Dyesol have been used as received without any further purification.
Methods
The N-TiO2 has been synthesized following the method reported previously.11 The prepared N-TiO2 nanocrystalline was then applied on ITO glass substrate through doctor blading method and was calcined at 450oC to obtain N-TiO2 thin film. The CdS quantum dots were synthesized directly on the N-TiO2 thin film surface by SILAR method as follows; the N-TiO2 thin film was immersed in 0.2 M Cd(NO3)2 solution for 1 minute then washed with aquadest before further immersing in 0.2 M (NH4)2S solution for 1 minute and again washed with aquadest to remove the impurities materials. The process was called as one cycle and the N-TiO2 was sensitized by CdS quantum dots with the cycle variation. The prepared CdS-sensitized N-TiO2 was then applied in QDSSC system and the performance of the QDSSC was measured as inscident photon to current efficiency (IPCE) and light to electricity conversion efficiency.
To fabricate the QDSSCs, the N-doped TiO2/CdS thin film TiO2 was assembled with the Pt-counter electrode (CE) between the active areas. The electrolyte solution was introduced through drilled hole on CE by capillary action, and the hole was then sealed. The current-voltage (I-V) measurements were performed using Keithley-2000 instrument with 1000 W/m2 power. Thus, during the measurement the Solar Cell was irradiated by the light with the power density of 1000 W/m2, which was equivalent to Air Mass 1 (AM1).
The overall photo-conversion efficiency, h is calculated from the integral of the short-circuit photocurrent density (Isc), the open-circuit photovoltage (Voc), the fill factor of the cell (FF), and the intensity of incident light (Is) using the formula of
where Voc= open-circuit Voltage (V), Isc = short- circuit-current density (mA/cm2), and Pinc = light intensity (W/cm2). Fill factor (FF) is given by
where Vpp is a maximum voltage (V), and Ipp is a maximum current density (mA/cm2).12,13
To study the structure of resulted materials, the corresponding difractograms were recorded using a Rigaku Miniflex 600 40 kW 15 mA Benchtop Diffractometer, CuKα, λ=1.5406 Å at scan rate of 2o/min.
To study the electronic structure of CdS/N-TiO2 nanocomposites, the light absorbances were recorded using UV/Vis Spectroscopy with diffuse reflectance of Shimadzu, UV-2550 model.
Results and Discussion
The N-doped TiO2/CdS nanocomposite films have been successfully synthesized on the N-TiO2 thin film surface through SILAR method with 1, 5, 10, 25, and 50 cycle’s variation resulted in CdS/N-TiO2 nanocomposites. Figure 1 shows the selected powder XRD patterns of CdS/N-TiO2 nanocomposites with cycle’s variation of 0, 5, and 50. The patterns indicated the existence of CdS quantum dots material on N-TiO2 semiconductor. The powder XRD pattern of CdS for the higher cycles performed in the synthesis showed the typical (111), (220), and (311) peaks of the cubic zinc blend structure which match the data of JCPDS-10-0454. The detailed CdS peaks appeared on 2q of 26.8o, 44.12o, 52.14o, and 72o corresponding to planes of (111), (220), (311), and (400), respectively, indicating the similar cubic structure of CdS as reported by Dhage et al14 and that of ZnS as reported by Soltani et al.15 The patterns also showed the peak of N-TiO2 nanocrystalline that appeared at around 2q of 25.2o, 38.5o, 47.8o, 54.1o, 55.4o, 63o, 69-71o, and 75o, corresponding to the anatase crystal planes of (101), (112), (200), (105), (211), (204), (116), (220), and (215), respectively.16 The diffractograms showed that there is not much peak change on the 5 cycles comparing to the pure N-TiO2 (0 cycle), while on 50 cycles, the higher peak intensity might be associated with the higher amount of CdS on N-TiO2 surface.
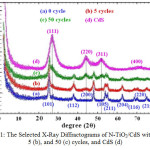 |
Figure 1: The Selected X-Ray Diffractograms of N-TiO2/CdS with 0 (a), 5 (b), and 50 (c) cycles, and CdS (d) Click here to View figure |
The crystal size of both CdS and N-TiO2 as estimated from Scherrer equation, are listed in Table 1. The result showed that all CdS synthesized on N-TiO2 are quantum dots size. It was also found that the cycles applied in the synthesis process highly affect the crystal structure of CdS/N-TiO2 nanocomposites. The more cycles lead to the lower CdS crystal size, while crystallite size of N-TiO2 was not significantly changed. It might be because the more cycles formed higher CdS quantum dots on the N-TiO2 surface, so it leads to the rearrangement of CdS quantum dots providing the lower particle size. In contrast to the smaller particle size with the more cycle synthesis process applied, it was also found that the more synthesis cycles resulted in smaller lattice parameter of the cubic crystal structure as listed in Table 1. The XRD patterns confirmed that both CdS and N-TiO2 retained their identity as shown in both crystal structures and peaks appeared in all XRD patterns except on pure N-TiO2. It means the resulted N-doped TiO2/CdS system is a nanocomposite material.17
Table 1: Crystal parameters of N-TiO2/CdS nanocomposites based on XRD analysis
|
Materials |
N-TiO2 size (nm) |
CdS size (nm) |
N-TiO2 lattice parameters |
CdS lattice parameters |
|
|
a |
c |
A |
|||
|
N-TiO2 |
16.8 |
– |
3.7924 |
9.5183 |
– |
|
N-TiO2/CdS (5) |
16.6 |
10.2 |
3.8142 |
9.5097 |
6.5342 |
|
N-TiO2/CdS (50) |
16.9 |
6.4 |
3.8068 |
9.5088 |
5.8324 |
|
CdS |
– |
8.0 |
– |
– |
6.6922 |
The absorption spectra of cycle’s variation on CdS/N-TiO2 synthesis are shown in Figure 2. The analysis of the typical bands together with colors may be seen in Table 2. It was clearly shown that the CdS addition on the N-TiO2 resulted in a visible active response, which the higher cycles on CdS synthesis provided higher increase on absorption and wider red-shift absorption bands (smaller band gap energy/Eg). It happened because the higher cycles resulted in the more CdS amount leading to the higher visible light response. The higher CdS amount could be also identified phisically from the deeper dark yellow intense color from the higher cycles applied (Table 2). The formation of CdS on N-TiO2 surface greatly enhances the visible light response, so the resulted CdS/N-TiO2 materials are highly potent to use as photoanode in solar cells system.
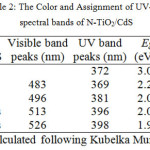 |
Table 2: The Color and Assignment of UV-Vis spectral bands of N-TiO2/CdS Click here to View table |
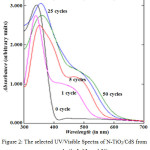 |
Figure 2: The selected UV/Visible Spectra of N-TiO2/CdS from every cycle (1, 5, 25, and 50) |
The surface morphology of CdS/N-TiO2 nanocomposites were evaluated using Scanning Electron Microscopy. The micrographs of N-TiO2 and CdS/N-TiO2 with 50 cycles are shown in Figure 3. The N-TiO2 micrographs (black region) seemed to show the porous nature of the N-TiO2 as a requirement for the electrode better adhesion in solar cell system, which was in fact to be true in preparing the electrode. The cross sectional micrographs indicated that the application of 50 cycles SILAR synthesis on N-doped TiO2 thin film led to the adsorption of CdS on the N-doped TiO2 as rough surface changed to smoother packed surface and the width of the film changed from around 55 µm to around 66 µm. The existence of cubic CdS can also be identified on the N-TiO2 surface.
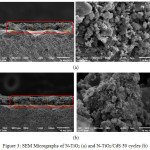 |
Figure 3: SEM Micrographs of N-TiO2 (a) and N-TiO2/CdS 50 cycles (b) |
To study the effect of SILAR cycles on the photoelectrochemical properties of the resulted materials, we applied N-TiO2/CdS nanocomposites in the solar cells system. The solar cells performa was analyzed as I-V measurements (Figure 4) and the overall efficiency (Table 3). From the I-V characteristics, it can be shown that these nanocomposites exhibit much higher efficiency compared to N-TiO2 only, being 4.5-8.3% with fill factors of 0.34-0.54. Within the cycles, the 25-SILAR cycle provided the best efficiency while the 1 and 50 cycles gave a lower efficiency even from the 5-SILAR cycles. It might be caused the higher CdS amount resulted in a low band gap energy which was easily to provide CdS as a center recombination which was then decreasing the overall solar cells performa. In general, these nanocomposites also exhibit much higher efficiency compared to the fluorine-doped-tin oxide (FTO) of FTO/TiO2/CdS bilayers systems which was only 0.78% with fill factor of 0.40,18 and to the CdS/TiO2-nanorod and CdS/TiO2-nanorod/g-C3N4, which were to be 1.67-2.31% with fill factors of 0.43-0.51.19 However, this is slightly less than that recently reported by Wang et al20 for different material, being 9.02% for Zn-Cu-In-Se QDSCs.
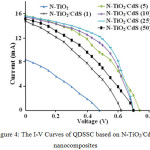 |
Figure 4: The I-V Curves of QDSSC based on N-TiO2/CdS nanocomposites |
Table 3: The performa of QDSSC based on N-TiO2/CdS nanocomposites
|
QDSSC |
Isc (mA) |
Voc (V) |
Imax(mA) |
Vmax(V) |
FF |
Ƞ (%) |
|
NTiO2 |
8.4 |
0.48 |
0.3 |
3.9 |
0.29 |
1.7 |
|
N-TiO2/CdS (1) |
14.8 |
0.62 |
0.35 |
8.9 |
0.34 |
4.5 |
|
N-TiO2/CdS(5) |
15.7 |
0.74 |
0.4 |
11.8 |
0.41 |
6.7 |
|
N-TiO2/CdS(10) |
15.4 |
0.7 |
0.5 |
10.8 |
0.50 |
7.7 |
|
N-TiO2/ CdS(25) |
15.6 |
0.7 |
0.5 |
11.8 |
0.54 |
8.3 |
|
N-TiO2/CdS (50) |
15.1 |
0.7 |
0.4 |
9.6 |
0.36 |
5.5 |
Conclusion
Nanocomposites of N-TiO2/CdS quantum dots have been successfully synthesized by SILAR method with the particle size of CdS is around 8 nm. The SILAR cycle was significantly influenced the visible light response, which the higher cycle applied in the synthesis provided higher red-shift absorption edge. The quantum dot solar cells based on N-doped TiO2/CdS nanocomposite prepared with 25 cycles provided the highest solar cell performa with overall efficiency of 8.3% with fill factor of 0.54.
Acknowledgment
The authors should thank to DIKTI (2015-2017) due to the special research funding support.
References
- Green, M. A. Solar Energy. 2003, 74(3), 181-192. https://doi.org/10.1016/S0038-092X(03)00187-7
CrossRef - O’Regan, B.; Gratzel, M. Nature. 1991, 353, 737-740. doi:10.1038/353737a0
CrossRef - Chen, X.; Lin, J.; Chen, J. Nanoscale Res Lett. 2011, 6(1), 475-480. doi: 10.1186/1556-276X-6-475
CrossRef - Nozik, A. J. Physica E. 2002, 14, 115-120.
CrossRef - Martinez-Castanon, G. A.; Loyola-Rodiguez, J. P.; Reyes-Macias, J. F.; Ruiz, N. N.-M. Superficies y Vacio. 2010, 23(4), 1-4. https://doi.org/10.1016/S1386-9477(02)00374-0
CrossRef - Jun, H. K.; Careem, M. A.; Arof, A. K. (2013). Renewable and Sustainable Energy Reviews. 2013, 22, 148-167. https://doi.org/10.1016/j.rser.2013.01.030
CrossRef - Qiu, X.; Burda, C. Chemical Physic. 2007, 339, 1-10. https://doi.org/10.1016/j.chemphys.2007.06.039
CrossRef - Asahi, R.; Morikawa, T.; Ohwaki, T.; Aoki, K.; Taga, Y. Science. 2001, 293, 269-273. DOI: 10.1126/science.1061051
CrossRef - Ma, T.; Akiyama, M.; Abe, E.; Imai, I. Nano Letter. 2005, 5(12), 2543-2547. DOI: 10.1021/nl051885l
CrossRef - Kusumawardani, C.; Kartini, I.; Narsito. Thammasat Int. J.Sc.Tech. 2010, 14(5), 1-10.
- Kusumawardani C.; Suwardi; Indriana, K.; Narsito. Asian Journal of Chemistry. 2012, 24(1), 255-260.
- ANONIM, Chapter 9: Solar Cell Parameters and Equivalent Circuit. 113-121
- Winkler, M. T.; Cox, C. R.; Nocera, D. G.; Bounasisi, T. Modeling integrated photovoltaic–electrochemical devices using steady-state equivalent circuits. 2012, E1076-E1082. www.pnas.org/cgi/doi/10.1073/pnas.1301532110
- Dhage, S. R.; Colorado, H. A.; Hahn, T. Nanoscale Research Letters. 2011, 1-5. https://doi.org/10.1186/1556-276X-6-420
CrossRef - Nayereh Soltani, N.; Saion, E.; Hussein, M. Z.; Erfani, M.; Abedini, A.; Bahmanrokh, G.; Navasery , M.; Vaziri, P. Int. J. Mol. Sci. 2012, 13, 12242-12258; doi:10.3390/ijms131012242
CrossRef - Jiang, H. B.; Cuan, Q.; Wen, C. Z.; Xing, J.; Wu, D.; Gong, X-Q.; Li, C.; Yang, H. G. Angewandte Chemie. 2011, 50(16), 3764-3768. https://doi.org/10.1002/anie.201007771
CrossRef - Chi, Y.; Fua, H.; Qi, L.; Shi, K.; Zhang, H.; Yu, H. Journal of Photochemistry and Photobiology A: Chemistry. 2008, 195, 357-363
CrossRef - Deshmukh, P. R.; Patil, U. M.; Gurav, K. V.; Kulkarni, S. B.; Lokhande, C. D. Bulletin of Material Science. 2012, 35(7), 1181-1186.
CrossRef - Gao, Q.; Sun, S.; Li, X.; Zhang, X.; Duan, L.; Lü, W. Nanoscale Research Letters. 2012, 1-9. DOI: 10.1186/s11671-016-1677-1
CrossRef - Wang, W.; Jiang, G.; Yu, J.; Wang, W.; Pan, Z.; Nakazawa, N.; Shen, Q.; Zhong, X. ACS Appl Mater Interfaces. 2017, 9(27), 22549-22559. doi: 10.1021/acsami.7b05598. Epub 2017 Jun 28.
CrossRef

This work is licensed under a Creative Commons Attribution 4.0 International License.
![]()
A New Edition of Web of Science
Journal Impact Factor
2022: 0.5
Five Year: 0.8
Journal is Indexed in

Cabells Whitelist
![]()


