In-silico Analysis of Phenyl Propanoic Acid Derivatives to Design Potent Peroxisome Proliferator-activated Receptor (PPAR) Dual Agonists for Type 2 Diabetes mellitus Therapy
 and Usha Chouhan
Department of Mathematics and Bioinformatics, Maulana Azad National Institute of Technology, Bhopal, India.
Corresponding Author E-mail: nehav2314@gmail.com
DOI : http://dx.doi.org/10.13005/ojc/340329
Download this article as:
![]()
Type 2 Diabetes Mellitus (T2DM) is an enfeeble and thriving disorder outlined by the hyperglycemia. The exponentially rising prevalence of T2DM, serves a major dilemma to public health and is marked by a fall in reactiveness of the tissues with respect to insulin that can be restored by the stimulation of Peroxisome Proliferator-Activated Receptors (PPARs). Objective: Identification of the structural features of ligands is performed in this study, which can help in modelling potent molecules to activate PPARs and analysis and Molecular Dynamics Simulation (MDS). A ‘sum-model’ is developed to design PPAR activators by adding the activities (EC50) of the ligands contrary to individual subtypes (PPARα and PPARγ) and using it as dependent parameter followed by validation using a test set of molecules, calculating the modified r2 and ‘Leave One-Out’ (LOO) method. Results and Discussion: The sum-model represents the optimum statistical outcome with R2 = 0.745 and R2pred = 0.838 while the corresponding values for the other two models are 0.747 and 0.732 for α-model, 0.600 and 0.677 for γ-model respectively. Docking analysis revealed that hydrogen bonding interactions are fundamental feature essential for the interaction among PPARs and Phenyl Propanoic Acid (PPA) derivatives. Docking of the most active compound to the proteins was followed by dynamically stabilizing the docked complexes of the PPARγ (1FM9) and PPARα (1K7L). The molecule PPARγ was found to stabilize at 2717ps having an RMSD value of 0.607nm while PPARα stabilized at 4500ps with an RMSD value of 1.1213nm. The potential energy, kinetic energy and total energy of the 1FM9 at 2717ps were found to be -543611 kj/mol, 96167 kj/mol and -441916 kj/mol, respectively, and that of 1K7L at 4500ps are found to be -2.995595 kj/mol, 542616 kj/mol and -2.45353 kj/mol respectively.
KEYWORDS:Type 2 Diabetes Mellitus; Peroxisome Proliferator-Activated Receptors; Multiple Linear Regressions; Docking; Molecular Dynamics Simulation; Leave One-Out
Introduction
Diabetes is a intricate and persistent illness which requires continuous medical care.1 Conventionally, persons having diabetes either completely deprive of insulin, a peptide hormone (Type 1 Diabetes Mellitus or T1DM) or possess inadequate insulin or the insulin cannot be used effectively (Type 2 Diabetes Mellitus or T2DM) among which T2DM reports for 90 to 95% of all diabetic cases.2,3 DM is designated by high levels of glucose in blood and is a heterogeneous clustre of disorders.4 The escalating rate of T2DM and their pay-off in terms of cardiovascular lithality and despair represent a huge threat to public health.5 Therefore, it is crucial to determine the biological targets for developing novel sanative molecules which can effectively cure T2DM as well as other metabolic syndrome. Among various receptors, Peroxisome Proliferator-Activated Receptors (PPARs), belonging to the nuclear hormone receptor family,6,7 has been given special attention. PPARs gets activated when the ligands bind to their Ligand-Binding Domains (LBDs). PPARs have 3 subtypes specifically PPARα, PPARβ/δ and PPARγ and they divulge a usual impact on target cells as their actions are restricted to specific tissue types. PPARα mainly affects the metabolism of fatty acids and lowers lipid levels on activation, while PPARγ mostly regulates the adipogenesis, energy balance, and biosynthesis of lipid. PPARβ/δ participates in the oxidation of fatty acid, in cardiac and skeletal muscles, but it also regulates the level of glucose in blood and cholesterol levels.
For designing PPAR dual agonists, MLR models for the solitary subtype might not be conducive as it produce knowledge just about upgrading the activity of that specific subtype. An integrated model having a balanced field with regard to Biological Activity (BA) for both subtypes of receptor is necessary. This could be achieved through adding the BA for creating a distinct variable which can be employed to generate a ‘combined-model’ that varies from the originally developed from the experimental BA and retain unique information. That is feasible since BA and chemical properties of a molecule/chemical compound are simultaneous and therefore, distinct parameters of a molecule / chemical compound may be obliged for revealing two distinct BA because of the inclusion of distinct biological receptors. After manipulating these BA, a relative combination of variables must be examined which can furnish significant information. Concept of manipulation of activities like division and multiplication was used in previous works to solve the hitches of duality and selectivity of composite triggering agents. Alike conception was applied in this study for molecular modeling of PPAR dual agonists. A testified dataset of PPAR dual agonists was considered for building the MLR models, from which, maximum molecules appeared to have potent EC50 values for PPARα and PPARγ subtype while slightly potent at PPARβ. Using this activity data, we establish our objective to create an MLR model which can forecast the over-all activity at most potent subtypes and would provide evidence about enhancing the activity for the specific subtypes where the majority of the chemical compounds/molecules are less active. To confirm that the potent ligands interacts on the active site of the receptor docking studies has been carried out, followed by the Molecular Dynamics (MD) simulation of the complexes.8 The coordinates of the ligand in the original target protein grids are selected as active site to carry out docking studies.
Materials and Methods
Quantitative Structure Activity Relationship (QSAR)9 study was performed on a dataset by means of Multiple Linear Regressions (MLR)10 using software SPSS.11 The dataset consists of a set of 71 derivatives of Phenyl Propanoic Acid (PPA) out of which 46 active molecules (Fig. 1) were considered to explore QSAR study to obtain potent leads intended for the remedy of T2DM.6, 12-14 Structure building and energy minimization was performed by means of Chem3D ultra15 whil egeneration of descriptors is done with Molecular orientation environment (MOE) software.16 The selection of potential descriptors from a set of various descriptors is a critical procedure in QSAR.17 Sum model as well as individual MLR model for PPARα and PPARγ were prepared using potential descriptors as independent and pEC50 value as dependent variable. The final model selected based on correlation coefficient (R2), cross validated correlation coefficient (Q2)and least standard error of estimation (see) values along with test set prediction.
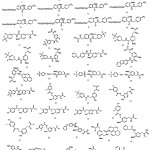 |
Figure 1: Structure of compounds |
Minimization
The structure of ligands considered for the study was drawn and minimized using the chemdraw ultra molecular modeling package.15 On the basis of a topical study carried on the crystal structure of proteins with a resolution higher than 2.5A°,18 accessible in the Protein Data Bank (PDB),19,20 we anticipated that PPARα and PPARγ, both molecules shares analogous conformation due to a similar structure in the LBD of the receptor. This study can be useful in establishing the fact that the molecules with structural similarity bind to a target in the same way. All molecules were minimized using Chem 3D Ultra software package.15
Qsar Analysis
The study of the statistical relationship among physicochemical properties of a group of molecules/compounds and their experimental activity is defined as QSAR where EC50 values are linearly correlated to the descriptor fields. Correlation analysis was performed followed by cross validation analysis. The statistical parameters calculated to judge the models were R2, see, Q2 and modified correlation coefficient (r2m). The cross-validated r2 (r2cv) that results in the optimal number of descriptors and least standard error of prediction (sp) are considered. To evaluate the predictive potential of the model, R2pred (correlation coefficient), sp (error of prediction) and modified correlation coefficient (r2m(test)) of the test set were also determined in all studies. The descriptors having correlation less than 0.6 were considered for model generation as shown in Table 1.
Table 1: Correlation between molecular descriptors
| BCUT_SMR_1 | GCUT_SMR_2 | wienerPath | vsurf_DW13 | BCUT_PEOE_3 | |
| BCUT_SMR_1 | 1.00 | ||||
| GCUT_SMR_2 | -0.32 | 1.00 | |||
| wienerPath | -0.55 | 0.08 | 1.00 | ||
| vsurf_DW13 | -0.11 | -0.24 | 0.56 | 1.00 | |
| BCUT_PEOE_3 | -0.34 | -0.56 | 0.13 | 0.14 | 1.00 |
Docking Analysis
To evaluate binding modes of the molecules with PPARγ and PPARα receptors, molecular docking was performed. The optimized chemical structures were used for QSAR and molecular docking studies. A very dynamic docking program FlexX 2.3.1 developed by Rarey and co-workers (presently commercialized by BioSolveIT) 21 was used to examine the binding interaction of the best active compound with the PPAR receptor. FlexX is relied on a vigorous incremental construction algorithm which fragmentize the ligand and then flexibly constructing it in the binding pocket with diverse placement strategies. For the purpose of docking 3 Dimensional structure with a respective resolution of 2.65 Å and 2.5 Å of receptors PPARγ and PPARα is taken from the PDB.19, 20 The active site coordinates of co-crystallized ligand were considered for molecular docking of all of the PPA compounds for calculating the dock scores with FlexX. The atoms within a specified radius of 6.5 A˚ of the co-crystallized ligand were defined as an active site. The docking scores were determined from the docked molecular complexes for each ligand. Docking analysis was executed for 100 conformations, and the top scored complexes/poses with a most negative flexX score were further analyzed. On the basis of ligand orientation and FlexX score, single complex for each best fitted ligand was carefully chosen, and its dock score was built-in to the molecular spreadsheet.
Validation
For the developing a dependable QSAR model having acceptable predictive power, validation is an important step.22, 23 External validation is a necessary step to test the predictive power of the QSAR model to ensure that the model will fit well on a new dataset even if it manifests a good predictive ability based on the statistics of the test set. For this purpose modified correlation coefficient (r2m) is calculated which can be defined as the measure of the degree of variance among the experimental activity and the predicted ones. The models are accepted only if they satisfy these criteria: R2 >0.5, Q2 >0.5, see<0.5 and r2m >0.5.24 For the validation of docking studies the receptor protein was made to dock with the natural ligand and the mode of binding was observed and compared with the other ligands in the dataset.
Molecular Dynamics Simulation
MD simulations were performed on PPARγ (PDB ID 1FM9) and PPARα (PDB ID 1K7L) receptor-ligand complex by using GROMACS25 to evaluate the stability of the complex. MD studies were performed to explain different behavior of target at the molecular level. However, Gromacs incorporates a more detailed temperature system and has more functionality built in for executing protein ligand interactions. 26, 27 Energy minimization is a very important step in MD and can be performed using conjugate gradients, lbfgs or steepest descent out of which the default method steepest descent is considered for energy minimization in this work. Cubic box type (with box size 0.5 taken as default) has been preferred over default box type i.e. rectangular, for the purpose of minimizing edge effects in a finite system to apply periodic boundary conditions in which the atoms of the system to be simulated are put into the space filling box, which is surrounded by translated copies of itself. For a system of particles, Potential Energy (PE) can be described by a force field, which is a parameter of mathematical functions. GROMOS96 43a1 force field is chosen which is an improved force field suited for molecular dynamics simulation of proteins and is parameterized with cutoff 1.4nm Lennard-Jones. The molecular dynamics study is done by taking into consideration certain parameters as input such as constraints set as all-bonds, Integrator as MD (molecular dynamics), Berendsen temperature coupling on, and temperature 300k etc. The MD run is set for 2000000 steps for PPARγ and 250000 steps for PPARα which is equal to 4000 and 4500ps respectively.
Results and Discussion
Statistical Investigation
Three self-determining MLR models were put up with alike training set: (i) α-model, built on basis of the EC50 of the compounds/molecules as the dependent parameter with respect to PPARα, (ii) γ-model, built on basis of the EC50 of the molecules for the PPARγ, (iii) ‘sum-model’, on the basis of summation of BA at both PPARα and PPARγ subtypes. The data set is subjected to step wise MLR analysis, so as to develop SAR between BA (dependent parameter) and various descriptors (independent variables). Several models were acquired out of which best model chosen on the basis of predictions obtained from the training set (internal prediction) and test set (external prediction). The statistically obtained parameters for MLR models are generated are displayed in Table 2. The optimal statistical results of the sum-model with R2 > 0.7 and R2pred > 0.8 refuse any likelihood of accidental correlation.
Table 2: Statistical parameters of PPARα, PPARγ and Sum Model
| Parameters | PPARα | PPARγ | Sum Model |
| No. of molecules in training set | 34 | 34 | 34 |
| No. of molecules in test set | 12 | 12 | 12 |
| R2 | 0.747 | 0.600 | 0.745 |
| No. of Descriptors | 5 | 5 | 5 |
| R2pred | 0.732 | 0.677 | 0.838 |
| See | 0.316 | 0.305 | 0.300 |
| r2m | 0.719 | 0.665 | 0.788 |
| Q2 | 0.677 | 0.649 | 0.620 |
MLR Analysis of PPARα Agonists
A similar set of descriptors used for the model preparation as taken in sum model and the equation obtained is shown in Model 1.
pEC50 = – 25.301(±15.671) – 24.541 (±9.213) x BCUT _SMR_1-106.091(±31.561) x GCUT_SMR_2+14.468 (±5.994) x BCUT_ PEOE_3-0.053(±0.032) x VSURF_DW_13 +0.00(±0.00) x wiener papth………………………model 1
The statistical quality of the model is: nTr=34; R2tr=0.732; see=0.316; Q2=0.677; nTs=12 and R2ts=0.747, where, nTr is number of molecules in the training set, R2tr is coefficient of correlation for the training set, see is the standard error of estimation, Q2 is cross validated correlation coefficient, and nTs is number of molecule in test set, R2ts is coefficient of correlation for test set. The predicted activity for test and training set compounds calculated from the model is given in Table 3. The correlation plot obtained between observed and predicted activity is given in Fig. 2.
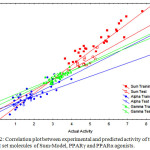 |
Figure 2: Correlation plot between experimental and predicted activity of training and test set molecules of Sum-Model, PPARγ and PPARα agonists. |
MLR Analysis of PPARγ Agonists
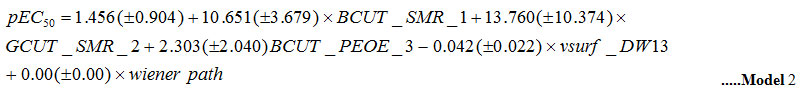
The statistical quality of the model is: nTr =34; R2tr=0.677; see=0.305; Q2=0.649; nTs = 12and R2ts=0.600. The equation obtained is shown in model 2.
MLR Analysis of Sum Model
The best univariate model showed BCUT_SMR_1 (nTr = 34, R2 = 0.292) as the vital characteristic adding to the activity. Descriptors BCUT_SMR_1 and GCUT_SMR_2 (R2 =0.453) contribute to bivariate model. The BCUT_SMR_1 descriptor is found to be dominating in illumination the variation in BA as supported by the concluding QSAR equation.
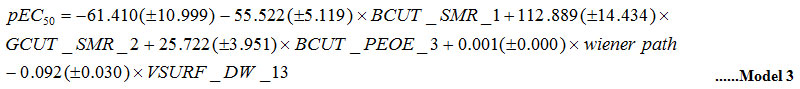
The values of descriptors (independent variables) applied in Model 3 are not inter correlated (R < 0.6) (Table 1). The statistical attributes of the model are: nTr =34; R2tr=0.838; see=0.300; Q2=0.620; nTs =12 and R2ts=0.745.
The acquired MLR model revealed the significance of BCUT_SMR_1, GCUT_SMR_2, BCUT_PEOE_3 descriptors, wiener path (Distance matrix and Adjacency descriptors), and VSURF_DW13 (Shape, Surface area and volume) descriptors. The positive coefficient of GCUT_SMR_2 and BCUT_SMR_1 indicates that molar refractivity of ligands have an optimistic influence on the activity of molecule respectively. The model derived from the MLR studies revealed the significance of the above mentioned descriptors for the interaction between receptor and ligands. Similar results from MLR studies of the dataset for all PPAR subtypes and sum model justifies that minimum van der Waals surface area favor the activity of molecules and increase in PE, molar refractivity and wiener path number can favor the activity.
Molecular Docking Studies
The Hydrogen Bonding (HB) interactions are the fundamental characteristics obligatory for the binding of PPARs and PPA derivatives. Molecular Docking is a computational approach that uses an algorithm which generates a huge number of potential structures. By this method prediction of favored orientation of one molecule to another while bound to each other to form a steady complex is done.
Protein and Ligand Preparation
Protein preparation is a necessary step in the docking analysis in which it is assumed that the ligand protein complex 3D structure is known. Hydrogen atoms are added to fill out open valences. A reference ligand is used in order to assess the success of docking solution. The ligand preparation tool of LeatIT is able to deal with a reference ligand and automatically gives a reliable state of the ligand.
PPARα
The substituted PPA derivatives reportedly exhibit strong agonistic activities against PPARs. 6,12-14 In this study, we monitored the agonistic activities only against PPARs using molecular docking scores and MLR studies. The binding site is constituted/defined by all the residues which are present in close vicinity from the reference ligand. At the active site, 100 conformational binding modes for the most active and reference ligand were generated. Each of the 100 conformations were observed using pose view diagram, and the best score conformation was chosen. The minimum binding energy indicated that the PPAR receptor (target protein) was successfully docked with PPA derivative is shown in the table. The possible binding modes of most active PPA derivative at PPARα active sites have been shown in Fig. 3. PPARα protein residues Ile241, Leu247, Ile272, Phe273, Cys275, Cys276, Thr279, Ser280, Tyr314, His440, Tyr464 etc. formed active site in the protein. Residue Ser280, Tyr314, His440 and Tyr464 found to form Hbond with the reference ligand molecule. Most active ligand showed relatively good binding affinity as compared to the rest of the ligands.Visualization of docked ligand in PPARα reveals that the carboxylate group is located in a favorable position to interact with the hydroxyl group of Ser280 and Tyr314 with FlexX score of -15.82. Similar kind of orientations was observed from docking of the natural ligand with the receptor with FlexX score -32.15.
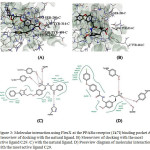 |
Figure 3: Molecular interaction using FlexX at the PPARα receptor (1k7l) binding pocket A) Stereoview of docking with the natural ligand. B) Stereoview of docking with the most active ligand C29. C) with the natural ligand. D) Click here to View figure |
Poseview diagram of molecular interaction with the most active ligand C29.
PPARγ
The molecular interactions at PPARγ active sites with natural ligand and the most active PPA derivative were shown in Fig. 4. PPARγ protein residues Gln286, Ile241, Leu453, Ile281, Phe360, Phe363, Cys285, Phe282, Ser342, Tyr327, His449, Arg288, Ile341, Met364, Leu330 formed active site in the protein. Residue Ser342 and Tyr327 found to form Hbond with the reference ligand molecule with FlexX score -31.54.Visualization of docked ligand in PPARγ reveals that the carboxylate group is located in a favorable position to interact with the hydroxyl group of Tyr327 residue while the N atoms behaves as an H bond acceptor. Docking of the natural ligand on the active site revealed that the Tyr327 residue interacts in the similar manner as the C25 with FlexX score -28.90.
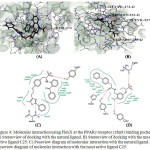 |
Figure 4: Molecular interaction using FlexX at the PPARγ receptor (1fm9) binding pocket A) Stereoview of docking with the natural ligand. B) Stereoview of docking with the most active ligand C25. C) Poseview diagram of molecular interaction with the natural ligand. D) |
Poseview diagram of molecular interaction with the most active ligand C25.
Molecular Dynamics Analysis of PPARγ and PPARα
In Molecular dynamics studies on PPAR nuclear receptors gives a stable protein structures at 2717ps (for PPARγ) and 4500ps (for PPARα) respectively. The application of explicit-water MD computations allow for assessing the movement of the systems. For the examined systems, the RMSDs of all the side chain atom positions from their prior configuration as a function of simulation time are shown in Fig. 5 (A). The RMSD values are reviewed to test the stability of the equilibrated trajectory and whether the convergence of the calculations is obtained. The values of RMSD for the stabilized conformer found within 0.607nm and 1.1213nm for PPARγ and PPARα respectively demonstrating the conformational stability of the system. The potential, kinetic and total energy of the 1FM9 at 2717ps are found to be -543611 kj/mol, 96167 kj/mol and -441916 kj/mol, respectively, whereas that of PPARα molecule are found to be -2.995595 kj/mol, 542616 kj/mol and -2.45353 kj/mol, respectively. The stability and behavior of the model can also be assessed by analyzing the root mean square fluctuations (RMSF) which is found to be 1.108 for PPARγ and 0.555for PPARα as shown in Fig. 5 (B). The mean square distance of atoms from the centre of mass is referred as the radius of gyration (Rg) is obtained as 2.467 nm and 3.488nm respectively The stability and behavior of the model can also be assessed by analyzing the root mean square fluctuations (RMSF) which is found to be 1.108 for PPARγ and 0.555for PPARα as shown in Fig. 5 (C).
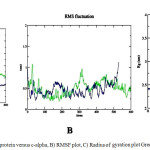 |
Figure 5a: RMSD plot of protein versus c-alpha, B) RMSF plot, C) Radius of gyration plot Green-PPARα Blue- PPARγ Click here to View figure |
Validation
All the MLR models were confirmed using a test set containing 12 compounds and the results are shown in Table 3. The prediction efficacy of the models was acceptable. The predicted EC50 is of the Sum-model is compared with the sum of predicted EC50 of individual models (last three columns of Table 3).
Table 3: Actual (Act) and predicted (Pred) pEC50 values and the residuals (Res) of training and test set molecules for the α-,γ- and sum model.
| Comp | Act | Pred | Res | Act | Pred | Res | Act | Pred | Res | Pred | Pred | Res |
| (α) | (α) | (γ) | (γ) | (sum) | (sum) | (α+ γ) | (sum) | |||||
| C1 | 3 | 3.12 | -0.12 | 2.9 | 2.75 | 0.15 | 5.9 | 6.05 | -0.15 | 5.87 | 6.05 | -0.18 |
| C2 | 3.34 | 2.9 | 0.44 | 3.48 | 3.27 | 0.21 | 6.82 | 6.37 | 0.45 | 6.17 | 6.37 | -0.2 |
| C3 | 1.6 | 1.87 | -0.27 | 2.6 | 3.24 | -0.64 | 4.2 | 5.3 | -1.1 | 5.11 | 5.3 | -0.19 |
| C4 | 3 | 2.86 | 0.14 | 3.4 | 3.11 | 0.29 | 6.4 | 6.97 | -0.57 | 5.97 | 6.97 | -1 |
| C5 | 3.2 | 2.25 | 0.95 | 3.45 | 3.39 | 0.06 | 6.65 | 7.67 | -1.02 | 5.64 | 7.67 | -2.03 |
| C6 | 1.85 | 1.65 | 0.2 | 3.48 | 3.24 | 0.24 | 5.32 | 5.28 | 0.04 | 4.89 | 5.28 | -0.39 |
| C7 | 1.86 | 2.15 | -0.29 | 2.94 | 3.22 | -0.28 | 4.8 | 5.48 | -0.68 | 5.37 | 5.48 | -0.11 |
| C8 | 1.51 | 1.46 | 0.05 | 3.23 | 3.22 | 0.01 | 4.74 | 5.51 | -0.77 | 4.68 | 5.51 | -0.83 |
| C9 | 1.28 | 1.16 | 0.12 | 3.91 | 4.07 | -0.16 | 5.19 | 5.67 | -0.48 | 5.23 | 5.67 | -0.44 |
| C10 | 1.18 | 1.69 | -0.51 | 3.3 | 3.46 | -0.16 | 4.48 | 4.89 | -0.41 | 5.15 | 4.89 | 0.26 |
| C11 | 2.7 | 1.96 | 0.74 | 3.85 | 3.59 | 0.26 | 6.54 | 7.44 | -0.9 | 5.55 | 7.44 | -1.89 |
| C12 | 1.85 | 1.68 | 0.17 | 3.48 | 3.24 | 0.24 | 5.32 | 5.28 | 0.04 | 4.92 | 5.28 | -0.36 |
| C13 | 1.28 | 1.47 | -0.19 | 3.41 | 3.33 | 0.08 | 4.69 | 4.28 | 0.41 | 4.8 | 4.28 | 0.52 |
| C17 | 1.8 | 1.94 | -0.14 | 3.56 | 3.58 | -0.02 | 5.36 | 5.56 | -0.2 | 5.52 | 5.56 | -0.04 |
| C18 | 1 | 0.75 | 0.25 | 3.28 | 3.22 | 0.06 | 4.28 | 4.45 | -0.17 | 3.97 | 4.45 | -0.48 |
| C19 | 1.08 | 0.91 | 0.17 | 3.69 | 3.57 | 0.12 | 4.77 | 5.48 | -0.71 | 4.48 | 5.48 | -1 |
| C21 | 2 | 1.6 | 0.4 | 3.98 | 3.62 | 0.36 | 5.98 | 6.43 | -0.45 | 5.22 | 6.43 | -1.21 |
| C23 | 0.94 | 1.46 | -0.52 | 2.91 | 2.93 | -0.02 | 3.86 | 4.32 | -0.46 | 4.39 | 4.32 | 0.07 |
| C25 | 0.88 | 1.7 | -0.82 | 2.53 | 2.83 | -0.3 | 3.41 | 3.5 | -0.09 | 4.53 | 3.5 | 1.03 |
| C27 | 1.72 | 1.62 | 0.1 | 2.66 | 2.82 | -0.16 | 4.38 | 5.17 | -0.79 | 4.44 | 5.17 | -0.73 |
| C28 | 1.78 | 1.7 | 0.08 | 2.89 | 2.75 | 0.14 | 4.67 | 5.69 | -1.02 | 4.45 | 5.69 | -1.24 |
| C29 | 0.7 | 0.39 | 0.31 | 2.96 | 2.9 | 0.06 | 3.66 | 4.71 | -1.05 | 3.29 | 4.71 | -1.42 |
| C30 | 1.18 | 1.31 | -0.13 | 2.92 | 2.86 | 0.06 | 4.1 | 4.43 | -0.34 | 4.17 | 4.43 | -0.26 |
| C31 | 1.46 | 1.28 | 0.18 | 3 | 2.74 | 0.26 | 4.46 | 5.47 | -1.01 | 4.02 | 5.47 | -1.45 |
| C32 | 1.26 | 1.93 | -0.67 | 3.41 | 3.6 | -0.19 | 4.67 | 5.27 | -0.6 | 5.53 | 5.27 | 0.26 |
| C35 | 2.72 | 3.24 | -0.52 | 3.11 | 3.37 | -0.26 | 5.83 | 6.09 | -0.26 | 6.61 | 6.09 | 0.52 |
| C36 | 3.08 | 3.5 | -0.42 | 3.36 | 3.2 | 0.16 | 6.44 | 6.85 | -0.41 | 6.7 | 6.85 | -0.15 |
| C37 | 4 | 3.11 | 0.89 | 3.79 | 3.48 | 0.31 | 7.79 | 8.39 | -0.6 | 6.59 | 8.39 | -1.8 |
| C38 | 0.91 | 1.16 | -0.25 | 3.34 | 3.22 | 0.12 | 4.26 | 4.45 | -0.19 | 4.38 | 4.45 | -0.07 |
| C39 | 1.61 | 2.38 | -0.77 | 2.81 | 3.09 | -0.28 | 4.43 | 4.07 | 0.36 | 5.47 | 4.07 | 1.4 |
| C40 | 2.45 | 2.11 | 0.34 | 3.15 | 3.02 | 0.13 | 5.59 | 6.36 | -0.77 | 5.13 | 6.36 | -1.23 |
| C42 | 2.36 | 1.76 | 0.6 | 3.38 | 3.54 | -0.16 | 5.74 | 5.94 | -0.2 | 5.3 | 5.94 | -0.64 |
| C45 | 2.91 | 2.54 | 0.37 | 3 | 2.95 | 0.05 | 5.91 | 6.9 | -0.99 | 5.49 | 6.9 | -1.41 |
| C46 | 3 | 2.83 | 0.17 | 3.93 | 3.82 | 0.11 | 6.93 | 7.99 | -1.06 | 6.65 | 7.99 | -1.34 |
| C14ts | 1.08 | 1.92 | -0.84 | 3.41 | 3.45 | -0.04 | 4.69 | 4.62 | 0.07 | 5.37 | 4.62 | 0.75 |
| C15ts | 1 | 1.13 | -0.13 | 3.34 | 3.42 | -0.08 | 4.34 | 4.21 | 0.13 | 4.55 | 4.21 | 0.34 |
| C16ts | 1.89 | 1.94 | -0.05 | 3.78 | 3.72 | 0.06 | 4.82 | 4.2 | 0.62 | 5.66 | 4.2 | 1.46 |
| C20ts | 1.04 | 1.11 | -0.07 | 2.9 | 2.95 | -0.05 | 3.83 | 3.81 | 0.02 | 4.06 | 3.81 | 0.25 |
| C22ts | 2.15 | 1.84 | 0.31 | 3.64 | 3.52 | 0.12 | 4.72 | 4.19 | 0.53 | 5.36 | 4.19 | 1.17 |
| C24ts | 1.08 | 1.2 | -0.12 | 3.66 | 3.43 | 0.23 | 5.28 | 4.69 | 0.59 | 4.63 | 4.69 | -0.06 |
| C26ts | 1.87 | 1.75 | 0.12 | 2.85 | 3 | -0.15 | 4.72 | 4.76 | -0.04 | 4.75 | 4.76 | -0.01 |
| C33ts | 1.85 | 1.48 | 0.37 | 3.26 | 3.49 | -0.23 | 4.33 | 4.36 | -0.03 | 4.97 | 4.36 | 0.61 |
| C34ts | 1.61 | 1.68 | -0.07 | 3.11 | 3.47 | -0.36 | 5 | 4.36 | 0.64 | 5.15 | 4.36 | 0.79 |
| C41ts | 0.93 | 1.04 | -0.11 | 3.56 | 3.34 | 0.22 | 5.4 | 5.6 | -0.2 | 4.38 | 5.6 | -1.22 |
| C43ts | 1.28 | 1.78 | -0.5 | 3.18 | 2.98 | 0.2 | 4.64 | 4.25 | 0.39 | 4.76 | 4.25 | 0.51 |
| C44ts | 1.46 | 1.11 | 0.35 | 3 | 3.25 | -0.25 | 5.15 | 4.84 | 0.31 | 4.36 | 4.84 | -0.48 |
ts* test set compounds
The resultant values of EC50 in these columns are fairly comparable and therefore build the sureness in the specified models as expected. The EC50 of the training set compounds was calculated by means of LOO (cross-validation) technique in QSAR analysis of the α- and γ-subtypes and sum model. The Q2, r2m and see was found to be 0.677; 0.719; 0.316, 0.649; 0.665; 0.305 and 0.620; 0.788; 0.300 for model 1, 2 and 3 respectively. The statistical results (Q2 and r2m > 0.5) explained the vigorous nature of the selected models. In external validation or test set validation, R2pred for model 1, 2 and 3 was found to be 0.732, 0.677 and 0.838 respectively. For satisfactory governing the predictive power of the models, the values of r2m of test set were also evaluated. For deducing the closeness between the predicted and the corresponding observed activity, the value of r2m(test) is predicted, as the upper value of R2pred may not persistently signify a small variation among the predicted and observed activity data. The r2m(test) was obtained as 0.508, 0.594 and 0.529 for α- and γ-subtypes and sum model respectively. All models in this study revealed with superior R2pred (>0.5) and r2m(test) (>0.5) values that explained the supremacy of the models.
Conclusions
The ‘sum-model’ gave a better overall prediction as compared to the individual PPARα and PPARγ models and the sum-model may be used to sketch new compounds having better ‘overall activity’ in comparison to the molecules of the dataset, which are the molecules of present concern for T2DM therapy. The ‘sum-model’ suggested in this paper offers acceptable result for both PPARs dual agonists. Furthermore the docking analysis revealed that the hydrogen bonding interactions are essential for the binding of ligands to the receptor. For evaluating the stability of the receptor ligand complex, molecular dynamics studies were performed and the results were quite acceptable. The examination of water conditions within the binding pocket during the molecular dynamic simulation revealed that the presence of sufficient water molecules inside binding pocket facilitates the hydrogen bonding interaction between receptor and ligand. This approach may well implement for identifying further known multiple triggering drugs.
References
- Diabetes Care 2015;38(Suppl. 1):S1–S2 | DOI: 10.2337/dc15-S001
CrossRef - Amos A, McCarty D and Zimmet P. The rising global burden of diabetes and its complications: estimates and projections to the year 2010. Diabetic Med 1987;14:S1–S85
- Centers for Disease Control and Prevention. National Diabetes Statistics Report: Estimates of Diabetes and Its Burden in the United States, 2014. Atlanta, GA: U.S. Department of Health and Human Services; 2014.
- World Health Organization (WHO): Definition, Diagnosis and classification of diabetes mellitus and its complications. Part 1: Diagnosis and classifications of diabetes mellitus. Department of Noncommunicable Disease Surveillance, Geneva, 1999. http://whqlibdoc.who.int/hq/1999/who_ncd_ncs_99.2.pdf
- Alberti K, Zimmet P. Definition, diagnosis and classification of diabetes mellitus and its complications. Part 1: diagnosis and classification of diabetes mellitus provisional report of a WHO consultation. Diabet Med 1999;7:539-53
- Kasuga J, Yamasaki D, Araya Y, Nakagawa, A., Makishima, M., Miyachi, H. et al.: Design, synthesis, and evaluation of a novel series of a-substituted phenylpropanoic acid derivatives as human peroxisome proliferator-activated receptor (PPAR) α/δ dual agonists for the treatment of metabolic syndrome. Bioorg Med Chem 2006;14:8405–8414
CrossRef - Oyama T, Toyota K, Waku T, Hirakawa Y, Nagasawa N, Kasuga J, et al. Adaptability and selectivity of human peroxisome proliferator-activated receptor (PPAR) pan agonists revealed from crystal structures. Acta Cryst 2009; D65: 786–795
CrossRef - Car R, Parrinello M. Unified approach for molecular dynamics and density-functional theory. Phys Rev Lett 1985;55:2471–2474
CrossRef - Okazaki S, et al. Structure–activity relationship studies of non-carboxylic acid peroxisome proliferator-activated receptor α/δ (PPARα/δ) dual agonists. Bioorg Med Chem 2016; 24(21): 5455-5461.
CrossRef - Jain S, Ghate M, Bhadoriya K, Bari S, Chaudhari A, Borse J. 2D, 3D-QSAR and docking studies of 1, 2, 3-thiadiazole thioacetanilides analogues as potent HIV-1 non-nucleoside reverse transcriptase inhibitors. Org Med Chem Lett 2012;2:22
CrossRef - IBM Corp. Released 2011. IBM SPSS Statistics for Windows, Version 20.0. Armonk, NY: IBM Corp.
- Miyachi H, Nomura M, Tanase T, Takahashi Y, Ide T, Tsunoda M, et al. Design, Synthesis and Evaluation of Substituted Phenylpropanoic Acid Derivatives as Peroxisome Proliferator-Activated Receptor (PPAR) Activators: Novel Human PPARγ Selective Activators. Bioorg Med Chem Lett 2002;12:77–80
CrossRef - Ban S, Kasuga J, Nakagome I, Nobusada H, Takayama F, Miyachi H, et al. Structure-based design, synthesis, and non-alcoholic steatohepatitis (NASH)-preventive effect of phenylpropanoic acid peroxisome proliferator-activated receptor (PPAR) α-selective agonists. Bioorg Med Chem 2011;19:3183–3191
CrossRef - Kasuga J, Nakagome I, Aoyama A, Sako K, Ishizawa M, Miyachi H, et al. Design, synthesis, and evaluation of potent, structurally novel peroxisome proliferator-activated receptor (PPAR) δ-selective agonists. Bioorg Med Chem 2007;15:5177–5190
CrossRef - Chemdraw ultra package version 7.0 http://www.cambridgesoft.com/.
- MOE (2013) Molecular operating environment (MOE). Chemical Computing Group Inc., 1010 Sherbooke St. West, Suite #910, Montreal, QC, Canada.
- Pourbasheer E, Vahdani S, Aalizadeh R, Banaei A, Reza M. QSAR study of prolylcarboxypeptidase inhibitors by genetic algorithm: Multiple linear regressions. J Chem Sci 2015;127:1243 doi:10.1007/s12039-015-0893-z
CrossRef - Protein data bank http://www.rcsb.org/pdb/home/home.do
- Bostrom J, Hogner A, Schmitt S. Do structurally similar ligands bind in a similar fashion. J Med Chem 2006;49:6716-6725
CrossRef - Nolte RT, Wisley BG, Westin S, Cobb JE, Lambert MH, Kurokawa R. et al. Ligand binding and coactivator assembly of the peroxisome proliferator-activated receptor. Nature 1998;395:137-143
CrossRef - Rarey M, Kramer B, Lengauer T, Klebe G. A fast flexible docking method using an incremental construction algorithm. J Mol Biol 1996;261:470-489
CrossRef - Golbrakikh A, Tropsha A. Beware of q2!. J. Mol Graph Model 2002;20:269-276
CrossRef - Tropsha A. Chemoinformatics in Drug Discovery. Wiley 2004;22:437-455
- Bathini R, Sivan S, Fatima S, Manga V. Molecular docking, MM/GBSA and 3D-QSAR studies on EGFR inhibitors. J Chem Sci 2016;128:1163 doi:10.1007/s12039-016-1103-3
CrossRef - Hess B, Vander SD, Lindahl E, Groenhof G, Mark AE, Berendsen HJC. GROMACS: Fast, Flexible and Free. J Comput Chem 2005;26:1701-1719
CrossRef - Hess B, Kutzner C, Vander SD, Lindahl E. GROMACS 4: Algorithms for highly efficient, loadbalanced, and scalable molecular simulation. J Chem Theory Comput 2008;4:435447
CrossRef - Perilla JR. Molecular dynamics simulations of large macromolecular complexes. Curr Opin Struct Biol 2015;31: 64–74.
CrossRef
Accepted on: January 11, 2018


ISSN Online: 2231-5039

![]()


