Fatty Acids Profile and Functional Group of Mixture of Yellow Striped Scad (Selaroides spp) Fish and Local Catfish (Clarias sp) Oils
Minarny Gobel
Departement of Animal Husbandry, Faculty of Agriculture,Tadulako University, Palu, Central Sulawesi, Indonesia.
Corresponding Author E-mail: gminarny@ymail.com
DOI : http://dx.doi.org/10.13005/ojc/340326
Article Received on : August 23, 2017
Article Accepted on : January 07, 2018
Article Published : 04 May 2018
Two different fish oils were extracted from yellow striped scad (Selaroides spp) and local catfish (Clarias sp) using wet rendering method and mixture of these oils were analysed using Gas Chromatography for the fatty acids profile and using FTIR for determining the functional group. The research results showed that the omega-3, -6 and -9 contents of mixed yellow stripped scad (Selaroides spp) and local catfish (Clarias sp) oils were 15.03g, 11.65g and 41.20g respectively. While the SFA, MUFA and PUFA contents of mixed fish oils were 32.56g, 41.20g and 26.67g respectively with the ratio of PUFA/SFA : 0.82. The free hydroxyl (-OH) group of mixed fish oils was observed in wave number 3943.53 cm-1, while hydroxyl (-OH) binding in carboxylate was observed in wave number 3005.95 cm-1 and function ester group (-C-O-C-) at wave number 1181.15 cm-1 in the spectra of FITR analysis. The results showed that mixture oils of yellow striped scad (Selaroides spp) and local catfish (Clarias sp) could be considered as a good natural source of omega-3, -6 and -9.
KEYWORDS:Fish oils; Omega-3; Omega-6; Omega-9; Fatty Acid Profile
Download this article as:| Copy the following to cite this article: Gobel M. Fatty Acids Profile and Functional Group of Mixture of Yellow Striped Scad (Selaroides spp) Fish and Local Catfish (Clarias sp) Oils. Orient J Chem 2018;34(3). |
| Copy the following to cite this URL: Gobel M. Fatty Acids Profile and Functional Group of Mixture of Yellow Striped Scad (Selaroides spp) Fish and Local Catfish (Clarias sp) Oils. Orient J Chem 2018;34(3). Available from: http://www.orientjchem.org/?p=45353 |
Introduction
Fish oil generally contained omega-3 (eicopenthanoic acid, docosahexanoic acid), omega-6 (linoleic acids and arachidoneic acid) and omega-9 (oleic acids) which believed have a healthy beneficial as noted by 5-14-16-6. Intensive studies on omega-3, -6 and -9 as well as fatty acids profile of some sea water and freshwater had been carried out by some researcher 20-23-13-1-10.
Omega-3, -6 (PUFA) and -9 (MUFA) long chain fatty acids could be classified as critical nutrients for human health and these fatty acids were most minimal of all fatty acids in the human diet. A study conducted in the U.S found that giving a diet that has a high content of omega-9 could increase the good cholesterol (HDL-High Density Lipoprotein), lowers bad cholesterol (LDL), and also lowers blood pressure. Therefore cardiovascular health will be maintained. Consuming a diet rich in Omega-9, the risk of heart attack can be reduced by more than15%11. The oil which is rich in omega-3 largely derived from cold water fish and sea food products (seafood)12.Yellow striped fish (Selaroides spp) and catfish (Clarias sp) are abundantly found in the waters of Central Sulawesi. The production of yellow striped scad fish and catfish in water area of Central Sulawesi are 13.288 tonnes/year and 35.00 tonnes/year respectively2.
The yellow striped scad (Selaroides spp) fish oils contained 24.45% omega-3, 10.53% omega-6, while local catfish (Clarias sp) fish oil contained 34.96% omega-915, however the fatty acid profile and its functional group of mixture of these two fish species oil are not yet reported. Therefore the aim of this study was to investigate the fatty acids profile of yellow striped scad (Selaroides spp) and local catfish (Clarias sp) oils mixture and its functional group using GC and FTIR methods.
Materials and Methods
Sample Preparation
The fish oil of yellow striped scad (Selaroides spp) and local catfish(Clarias sp) obtained from sea water of Makassar or Tomini Gulf (Parimo Regency) were extracted using wet rendering method3. While mixing oil of these fish (1 : 1) were prepared using shaker at 50°C for 29 minutes. The oil samples before injected into GC (Shimadzu-FID) apparatus for fatty acids profile were transmethylated into fatty acid methyl esters(FAME) and followed by the determination of functional groups by Infra Red analysis using FTIR.
Laboratory Analysis
Samples (0.3 ml) were methylated using 1.5 ml of Na-Metanolic and heated at 65°C for 15 minutes in waterbath and 1.5 ml of BF3-Methanol were then added to the mixture before reheated at the same condition. The solution after heating were allowed to cool down before extracted with 0.5 ml of N-Heptane and 1 ml of saturated NaCl, and the top-layer of solution (1µl) was injected to the Gas Chromatography (at the same condition with standard) as described in3. IR spectra were recorded on a FTIR model Shimadzu 8400S grating infrared spectrophotometer in KBr pellets (in cm-1) following the method as described24.
Results and Discussion
Fatty Acid Composition of Mixed Oil
The fatty acid composition of yellow striped scad (Selaroides spp) fish oil, local catfish (Clarias sp) fish oil and mixture of these oils are presented in Table 1.
Table1: Fatty acid profile of yellow striped scad fish oil (Selaroides spp), local catfish oil (Clarias sp) and mixed fish oil (g/100g fish oil)*)
| Fatty acids | Yellow striped scad(SelaroidesSpp) fish oil *)**) | Local Catfish (ClariasSp) fish oil *)**) | Mixed fish oils *) | |||
| C12 : 0 (Lauric acid) | 0.10 ± | 0.02 | 1.98 ± | 0.04 | 0.10 ± | 0.001 |
| C13 : 0 (Tridecanoic acid) | 0.11 ± | 0.04 | 0.01 ± | 0.00 | 0 | 0 |
| C14 : 1 (Miristoleic acid) | 0.03 ± | 0.00 | 0.05 ± | 0.00 | 0.06 ± | 0.001 |
| C14 : 0 (Miristic acid) | 7.11 ± | 0.94 | 1.99 ± | 0.04 | 3.30 ± | 0.05 |
| C15 : 0 (Pentadecanoic acid) | 1.69 ± | 0.04 | 0.21 ± | 0.00 | 0 | 0 |
| C16 : 1 (Palmitoleic acid) | 8.18 ± | 0.58 | 4.95 ± | 0.07 | 4.89± | 0.05 |
| C16 : 0 (Palmitic acid) | 29.36 ± | 1.09 | 25.00 ± | 0.41 | 26.62± | 0.25 |
| C17 : 0 (Heptadecanoic acid) | 0.19 ± | 0.02 | 0 | 0 | 1.1± | 0.01 |
| C17 : 1 (Cis-Heptadecanoic acid) | 2.36 ± | 0.42 | 0.00 ± | 0.00 | 0.00 | 0.00 |
| C18 : 0 (Stearic acid) | 3.01 ± | 0.58 | 22.95 ± | 1.35 | 0.00 | 0.00 |
| C18 : 1 ( Oleic acid) | 14.52 ± | 0.93 | 34.97 ± | 1.48 | 35.52± | 0.33 |
| C18 : 2 (Linoleic acid) | 10.95 ± | 0.87 | 6.29 ± | 0.10 | 11.13± | 0.13 |
| C18 : 3 ( Linolenic acid) | 1.52 ± | 0.26 | 0.86 ± | 0.52 | 1.57± | 0.02 |
| C20 : 0 ( Arachidic acid) | 6.30 ± | 1.02 | 0 | 0 | 1.33± | 0.02 |
| C20 : 3(Linolenic acid) | 1.53 ± | 0.04 | 0 | 0 | 3.16± | 0.28 |
| C20 : 4 ( Arachidoneic acid) | 16.99 ± | 0.17 | 0.12 ± | 0.04 | 1,57± | 0,02 |
| C20 : 5 (Eicosapentanoic acid) | 0.23 ± | 0.22 | 0.12 ± | 0.02 | 0 | 0 |
| C22 : 6 ( Docosahexanoic acid) | 0.34 ± | 0.02 | 0.00 ± | 0.00 | 0.001± | 0.00 |
| C24 : 1 ( Tricosanoic acid) | 0.99 ± | 0.00 | 0.05 ± | 0.00 | 0.06± | 0.001 |
| SFA (%) | 45.55 | 48.59 | 32.56 | |||
| MUFA(%) | 26.76 | 40.02 | 41.2 | |||
| PUFA (%) | 30.71 | 7.36 | 26.67 | |||
*) Means ± standard deviation (3 replication).
**) Minarny et al. (2014).
Data in Table 1 showed that the average content of fatty acids of yellow striped scad (Selaroides spp) fish oil and local catfish (Clarias sp) fish oil, and mixture consist of Saturated Fatty Acid (SFA), Monounsaturated Fatty Acids (MUFA) and Polyunsaturated Fatty Acids (PUFA).
The total SFA was 32.56% which dominated by palmitic acid (C16 : 0) : 26.62%, while MUFA was 41.2% dominated by quite high content of oleic acid C18 :1n-9) : 41.2% and PUFA in the amount of 26.67% dominated by linoleic acid (C18 : 2n-6) and arachidoneic acid (C20 : 4n-3) in the amount of 11.13% and 9.48% respectively. However, the amount of eicopentanoic acid (EPA, C20 : 3n-3) and docohexanaoic acid (DHA) tended lower than general fish oil. While high amount of omega 3 (linoleic and arachidoneic acids) gave an oppurtunity to form eicopentanoic acid and docosahexanoic acid in the metabolism process.
The PUFA omega 3 and 6 series have the ability to enter the desaturation, elongation and retroconversion in its derivates of other fatty acids such as eicopentanoic acid (C20 : 5n3) and docohexanoic acid (C22 : 5n3) as illustrated in Figure 1, 2 and 3 9-21-19-22.
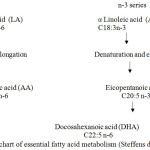 |
Figure 1: Flowchart of essential fatty acid metabolism (Steffens dan Wirth, 2005) |
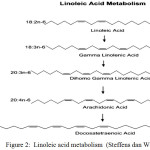 |
Figure 2: Linoleic acid metabolism (Steffens dan Wirth, 2005) |
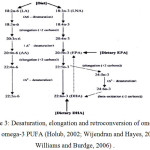 |
Figure 3: Desaturation, elongation and retroconversion of omega-6 and omega-3 PUFA (Holub, 2002; Wijendran and Hayes, 2004; Williams and Burdge, 2006). |
FTIR Analysis Results of Mixed oils
The FTIR spectra of yellow striped scad (Selaroides spp) fish oil, local catfish (Clarias sp) fish oil and mixture of these oils using maceration technique are presented in Figure 4 and Table 2.
Free hydroxyl group of yellow striped scad (Selaroides spp) fish oil, local catfish (Clarias sp) fish oil and mixture of these oil were observed in wave number at 3488.01, 3468.01 dan 3643.53 cm1 ,respectively as showed in Figure 4 and Table 2. While OH bonding in carboxylic acid was found at wave number at 3469.94 cm1 for yellow stripe scad fish oil, 3005.95 cm1 for local catfish oil and 3151.60 cm1 for mixture of these oils. These data showed the widen of C-H vibration from –CH2 and –CH3 groups and also one small absorption band at wavelength of 3005.95 cm1 for unsaturated alkena ( -CH=CH-). The wave number at 1743.65 cm1 at those three different kind of oil showed there are carbonyl (C=O) group present from its ester and C-O group and wave number at 1232.51 cm1 for yellow stripe scad fish oil, 1236.37 cm1 for local catfish oil and 1234.44 cm1 for mixture of these oils. This data were also supported by the more sharp peak at wave number at 985 – 1200 cm1 which showed the ester function (-C-O-C-) group tends to be higher compared to the one in mixture of yellow stripe scad and local catfish oils at wavelength of 1181.15 cm1; for yellow stripe scad fish oil at 1155.36 cm1 and for local catfish oil at wave number at 1166.93 cm1.
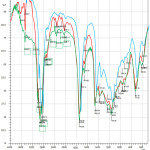 |
Figure 4: The FTIR spectra of yellowstripe scad (Selaroides spp) – blue colour local catfish (Clarias sp) fish oil – green colour and mixture of these fish oils– red colour. |
Table 2: Interpretation of Infra Red spectra of yellow stripe scad (Selaroidesspp) fish oil, local catfish (Clarias sp) fish oil and mixture of these fish oils.
| No. | Vibration | Wave number (cm-1) | |||
| Yellowstriped scad (Selaroides spp) fish oil | Local catfish (Clarias sp) fish oil | Mixture of yellowstripe scad and local catfish oils | Functional group | ||
| 1. | OH stretching (4000 – 3200 cm-1) | 3643.53 | 3468.01 | 3488.01 | Alcohols and Phenols |
| 2. | OH stretching, hydrogen – carboxilic acid bonding (3300 – 2500 cm-1) | 3469.94 | 3005.95 | 3151.69 | Carboxylic acids |
| 3. | OH stretching, hidrogen– carboxilic acid bonding (3300 – 2500 cm-1) | 3007.02 | 2922.16 | 3008.95 | Carboxylic acids |
| 4. | OH stretching, hydrogen – carboxilic acid bonding (3300 – 2500 cm-1) | 2922.72 | 2852.72 | 2922.16 | Alkanes |
| 5. | OH stretching, hydrogen – carboxilic acidbonding (3300 – 2500 cm-1) | 2852.72 | 2679.13 | 2852.72 | Alkanes |
| 6. | OH stretching, hydrogen– carboxilic acid bonding (3300 – 2500 cm-1) | 2729.27 | – | 2727.35 | Alkanes |
| 7. | OH stretching, hydrogen – carboxilic acidbonding (3300 – 2500 cm-1) | 2677.20 | – | 2677.20 | Alkanes |
| 8. | OH stretching, hydrogen – carboxilic acid bonding (3300 – 2500 cm-1) | – | – | 2532.54 | Alkanes |
| 9. | C = C stretching of aliphatic ester (1750 – 1725 cm-1) | 1743.66 | 1743.65 | 1743.65 | Esters, saturarated aliphatic |
| 10. | C = C stretching of carboxilic acid (1725 – 1700 cm-1) | – | – | 1703.14 | Esters. Carboxylic acids |
| 11. | C = C stretching of conjugated alkena (1680 – 1620 cm-1) | 1653.00 | 1654.92 | 1654.92 | Esters, Alkanes |
| 12. | C = C stretching of aromatic (1625 – 1430 cm-1) | 1462.04 | 1460.11 | 1458.16 | Esters,Aromatics |
| 13. | C-O stretching (1320 – 1210 cm-1) | 1236.37 | 1234.44 | 1232.51 | Eter |
| 14. | C-O-C (985 – 1200 cm-1) | 1166.93 | 1181.15 | 1155.36 | Eter |
| 15. | C-O-C (985 – 1200 cm-1) | 1116.78 | 1099.43 | 1107.14 | Eter |
| 16. | C-O-C (985 – 1200 cm-1) | 1028.08 | 1031.92 | 1066.64 | Eter |
| 17. | C-X chlorida (800 – 600 cm-1) | 721.38 | 721.38 | 717.52605.65 | Aromatics |
| 18. | C-X Bromida,Iodida< 667 | 599.86588.20 | 590.22 | Aromatics | |
In the mixture oils sample there were three additional peaks of OH group (OH streching, hidrogen bonded to carboxylic acid at wave number at 3300 – 2500 cm1) and one additional peak of caboxylic acid group were also observed. This phenomena possibly due to the some fatty acid were entering to elongation and unification process so that OH group which were bonded with carboxylic (C=C) continue increasing. also noted similar process as noted earlier. The other supported data were the results of Gas Chromatogarphy (GC) analysis as presented in Table 1 i.e some kind of fatty acids such as C16 : 2n-3 and C22 : 1n-9 just appeared in the mixed oils sample and it was not detected before mixing those two kind of oils19. Numbers at the bottom part of the peak showed the peak frequency indicated the functional group as presented in Table 2.
C=O group could be found in the wave number at 1750 – 1725 cm1, hydroxyl (OH) group at wave number 4000 – 3200 cm1, and C-O-C at wave number 985 – 1200 cm1 18. Furthermore, that carbonyl (C=O) functional group of carboxylic acid was obeserved at wave number 1711 cm1 and asymetric group number at wave number at 1283 – 1285 cm1 , while vibration of carboxylic acid was observed at wave number 1413 and 918 – 937 cm1 also noted17. Sachii oil had a high unsaturated rate and it was shown by the strong absorption wavelength of CH-CH cis olephin i.e. 3010.5 cm1 and directed to the absorption wavelength of symetric methyl i.e. 2855.1 cm1. While 4reported that O-H streching at 3009.71(alcohol and phenol functional groups),C-H streching at 2926.63 (alkanes), C-H streching at 2858.12 (alkanes), C-H streching at 2857.60 ( alkanes), B-H streching at 2041.49 (boron compounds), C=O streching at 1742,88 (esters, saturated aliphatic), C-C streching at 1448.57 (aromatics), C-F streching at 1362.83 (halogen compounds), P=O streching at 1170.29 (halogen compounds), O-H at 918.83 (carboxylic acids) and C-H’oop’ at 716.94 (aromatics) were observed in sardine fish oil samples 8.
The proportion of monounsaturated fatty acids, polyunsaturated fatty acids and saturated fatty acids group were estimated also within those FTIR wave number. the same results of linseed oil analysed using FTIR where absorption band of C-H ( asymetric and symetric respectively) were shown at wave number 2927 cm1 and 2855 cm1. While the absorption band of C-H was also observed in the wave number 3010 cm1 from aliphatic –CH=CH- (double cis) 7.
Conclusion
The results showed that mixture of yellow striped scad (Selaroides spp) fish oil and local catfish (Clarias sp) oil could be considered as a good source for omega-3, omega-6 and omega-9 as contained high percentage of MUFA and PUFA but low content of SFA. While the results of FTIR analysis confirmed the presence of alcohols, carboxilic acid, aliphatic esters, alkanes and aromatic compounds in yellow striped scad (Selaroides spp) and local catfish (Clarias sp) oil mixture.
References
- Adeniyi, S.A., Orjiekwe, C. L., Ehiagbonare, J.E. and Josiah, S.J. 2012. Nutritional composition of three different fishes (Clariasgarieinus, Malapteruruselectricusand Tilapia guineensis). Pakistan Journal of Nutrition 11 (9): 793-797.
CrossRef - Anonymous, 2012. Statistics Data Department of Fisheries and Marine of Central Sulawesi Province, Palu,Central Sulawesi.
- AOAC, 2000. Official methods of analysis of the association of official analysis. 18th Edition, Washington.
- Arul Franco, P., Shenbagavinayagamoorthi, N., and Venkatesan, A. 2014. FT-IR Determinationof Free FattyAcids inSardinella longiceps Fish Oil and its Performance and Emission characteristics in DI Diesel Engine. International Journal of ChemTech Research 6, (7): 3776-3783.
- Calder, P. C. 1996. Immunomodulation and anti-inflamantory effects of n-3 polyunsaturated fatty acis. Proceedings of the Nutrition Society 55: 737-774.
CrossRef - Cleland, L. G. James, M. J. and Proudman, S. M. 2003. The Role of fish oils in the treatment of rheumatoid arthritis. Drugs 63: 845-853.
CrossRef - Grehk,T.M., Berger, R. and Bexwil, U. 2008. Investigation of the drying process of lineseed oil using FTIR and ToF-Sims. Journal of Physics Conference Science 1-4.
- Guilen, M.D., , Ruiz, A., Cabo, N., Chirino, R. and Pascual, G. 2003. Characterization of Sacha Inchi ( Plukenia volubilis L ) oil by FTIR spectroscopy and 1H-NMR comparison with linseed oil. Journal of the American Oil Chemists’ Society 80(8): 755 – 762.
CrossRef - Holub,B.J. 2002. Clinical Nutrition: 4. Omega-3 Fatty acids in Cardiovascular Care. Canadian Medical Association Journal166: 608 – 615.
- Jakhar, J.K., Pal, A.K., Reddy, A.D.,Sahu, N.P.,Venkateshwarlu, G. and Vardia, H.K. 2012. Fatty Acids Composition of Some Selected Indian Fishes. African Journal of Basic & Applied Sciences 4 (5): 155-160.
- Kolanowski, W. 2005. Bioavailability of omega-3 PUFA from foods enriched with fishoil – A mini review. Polish Journal of Food and Nutrition Sciences 14/55 (4): 335–340.
- Lee, M.R.F, Tweed,J.K.S, Moloney, A.P. and Scollan, N.D. 2005. The effects of fish oil supplementation on rumen metabolism and biohydrogenation of unsaturated fatty acids in beef steers given diets containing sunflower oil.Animal Science 80: 361 – 367.
CrossRef - Luczynska, J. B., Paszczyk, Z., Borejsco. L. and Tarkowski. 2012. Fatty acid profile of muscles of freshwater fish from olsztyn markets. Polish Journal Food Nutrition Science 60 (1): 51-55.
- Massaro, M., Carluccio, M. A. and De Caterina, R. 1999. Direct vascular antiatherogenic effects of oleic acid: a clue to the cardioprotective effects of the Mediterranean diet. Cardiologia 44 (6): 507-513.
- Minarny, G.,Purnomo, H., Asriani and DjalalRosyidi 2014.Fatty acid profile of fish from Central Sulawesi, Indonesia.International Food Research Journal 21(3): 943-947
- Ruxton, C. H. S., Reed, S. C., Simpson, M. J. A. and Millington, K. J. 2004.The healthy benefits of omega-3 polyunsaturated fatty acids: a review of the evidence. Journal Human Nutrition Diet 17: 448-459.
CrossRef - Salimon,J., Abdullah,B.M. and Nadia, S. 2011. Hydrolisis optimisation and Characterization study of preparing fatty acids from Jatropha curcas seed oil. Chemistry Central Journal 5:67.
CrossRef - Silverstein,R.M. and Webster, F.X. 1997. Spectrometric Identification of Organic Compounds, Willey Inc, New York.
- Steffens, W. and Wirth, M. 2005. Freshwater fish – an Important Source of n-3 polyunsaturated fatty acid: A review. Archives of Polish Fisheries 13 (1): 5-16.
- Ugoala, Chukwuemeka, Ndukwe, G.I. and Audu, T.O. 2008. Comparison of fattyacids profile of some freshwater and marine fishes. Journal of Food Safety 10: 9-17.
- Wijendran, V. and Hayes, K.C. 2004. Dietary n-6 and n-3 fatty acid balance and cardiovacular health. Annual Review Nutrition 24: 597 – 615.
CrossRef - Williams, C.M. and Burdge, G. 2006. Long Chain n-3 PUFA: plant vs marine sources. Proceeding of the Nutrition Society 65: 42 – 50.
CrossRef - Yildiz, M. 2009. Fatty acid profiles of microdiets for marine fish in Turkey.Turkey Journal Veterinary Animal Science 33 (4): 333-343.
- Yue, D., Frederik van de Voort, R., Andrew, G. Diego and Gonzales, G. 2006. Perspectives on quantitative mid FTIR spectroscopy in relation to edible oil and lubricant analysis. Evolution and Integration of Analytical Methodologies 1 (3) : 153 – 163.

This work is licensed under a Creative Commons Attribution 4.0 International License.
![]()
A New Edition of Web of Science
Journal Impact Factor
2022: 0.5
Five Year: 0.8
Journal is Indexed in

Cabells Whitelist
![]()


