Fatty Acids Analysis and Antioxidant Activity of Fixed Oil of Quercus Infectoria Grown in Jordan
Zaha A. El-Agbar, Rajashri R. Naik and Ashok K. Shakya
Faculty of Pharmacy and Medical Sciences PO Box 263, Al-Ahliyya Amman University, Amman, Jordan.
Corresponding Author E-mail: ashokshakya@hotmail.com
DOI : http://dx.doi.org/10.13005/ojc/340324
Article Received on : December 11, 2017
Article Accepted on : April 04, 2018
Article Published : 06 May 2018
Quercus infectoria seeds were used in the present study, and fatty acid content in fixed oil was determined using GC-FID. The total amount of the oil present in the seed was 7.2%. The major fatty acid identified were oleic acid (58.13%), linoleic acid (19.84%), palmitic acid (15.99%), stearic acid (2.27%), α–linolenic acid (1.31%) and other constituents like heptadecanoic acid, cis–11-eicosenoic acid, cis-10-heptadecenoic acid, behenic, lignoceric and myristic acid with less the 1 %. Due to its phenolic compounds and α-tocopherol, the oil exhibits its antioxidant activity. Antioxidant properties of the oil were determined via DPPH radical scavenging and β-carotene bleaching assay. The physical properties and UV and FT-IR spectra were also determined.
KEYWORDS:Quercus Infectoria; Fixed Oil; Antioxidant; GC-FID; α-tocopherol; Fatty Acid Methyl Ester (FAME), DPPH Radical scavenging activity, β-carotene bleaching assay, oleic acid, linoleic acid, palmitic acid, FT-IR, UV spectrum.
Download this article as:| Copy the following to cite this article: El-Agbar Z. A, Naik R. R. Shakya A. K. Fatty Acids Analysis and Antioxidant Activity of Fixed Oil of Quercus Infectoria Grown in Jordan. Orient J Chem 2018;34(3). |
| Copy the following to cite this URL: El-Agbar Z. A, Naik R. R. Shakya A. K. Fatty Acids Analysis and Antioxidant Activity of Fixed Oil of Quercus Infectoria Grown in Jordan. Orient J Chem 2018;34(3). Available from: http://www.orientjchem.org/?p=45485 |
Introduction
Since primeval time, medicinal plants have been used for its medicinal properties. The crude extract of the plants is now being used for the development and in preparation of traditional medicines1, 2. Plants have innumerable source of chemicals that have different pharmacological, biological activities and are known to be good source of chemical or phytochemical ingredients to cure various diseases3. According to the WHO around 70% of the population in the developing countries depend on the plant for primary health and 25% of the modern drugs get its ingredients from plants4. Its known fact that, plants contains significant amount of antioxidants, which play a key role in the human defence system and overcome the oxidative stress caused by the reactive oxygen species5-6.
Quercus infectoria (Family: Fagaceae, Common name: Aleppo Oak and Arabic name: “Oak” Baloouth) and Quercus aegilops trees are widely distributed in Jordan. It’s a small tree or a shrub grown in some parts of Greece, Syria and Iran. Tannin is one of the main constituents in the galls of Q. infectoria with 50 – 70 %, free gallic acid and ellagic acid with small amouts7. Tannins are water soluble polyphenols with molecular weight ranging from 500 to 3000 Dalton with ability to precipitate protein8. The galls of the Q. infectoria pharmacologically display antibacterial9-11, antifungal12, larvicidal13-14, antiviral15, antidiabetic16, and antiinflammatory17 activities.
With the polyphenols content the activity of the antioxidant increases relatively due to their redox properties18. Polyphenols are known to possess varied roles; they are potent free radical scavenger protecting the constituents of the cells from damage due to oxidative stress – thereby preventing various chronic diseases associated with it. The antioxidant activity of the polyphenols is due to their structure and to their redox property to either accept or donate the electrons which causes the delocalisation of unpaired electrons in their aromatic structure19, the antioxidant activity of the Quercus infectoria has been studied for their antioxidants20 and is shown to contain efficient free radical scavenging activity.
Due to geographical difference and the weather conditions there may be difference in the content and the biological activity. The biological activity of the Quercus infectoria grown in Jordan that has not been studied so far.
In the present study we are reporting the GC-FID analysis of fatty acid composition and antioxidant activity.
Experimental
Materials and Methods
The chemicals, solvent and the reagents of analytical grade were used. DPPH, (±) α- tocopherol, β-carotene, rutin and other chemicals were procured from Sigma–Aldrich. The oak fruit (Quercus infectoria, Oak fruits) along with the twigs were collected from Al-Balqa region of Jordan during Jan-Mar, 2013. Voucher specimens (FP-MS-2014-O) was deposited in Faculty of Pharmacy and Medical Sciences, Al-Ahliyya Amman University, Amman, Jordan. After drying the fruit at room temperature the seeds were separated from the upper hard coat and grounded to fine powder using mixer.
Extraction of Fixed oil
In a 200 ml round bottomed flask, 50 g of the powdered seed was added. It was extracted with 200ml of n-hexane with aid of sonication for 15 min. The sonicated mixture was filtered and extracted again using 150ml normal hexane. Hexane extract was collected and solvent was evaporated using Buchi rotavap. The resultant oil was collected and transferred to amber coloured glass vials. These vials were sealed with Teflon caps after flushing with nitrogen and stored in deep freezer (-10°C) till analysis.
Physical Properties
Physical properties like specific density (20ºC) and refractive index (RI, 25ºC) of the oil samples were determined according to standard procedure (AOCS)21 using Abbe’s refractometer. Using the standard procedure, acid value, saponification value and fatty acid content were determined. Infrared spectrum of oil (as thin film) was recorded on Shimadzu Infinity IR spectrophotometer (Shimadzu co. Japan).
Determination of α-tocopherol in oil
α-Tocopherol content in the oil was determined using procedure described earlier22. Briefly, the separation of different isomers and quantization was carried out using BDS-Hypersil column (150 mm × 4.6 mm, 5 µm) using a mixture of methanol and acetonitrile (50:50, v/v) as mobile phase (flow rate – 1mL/min). The signals of analyte were captured using PDA detector (between 200 to 350nm), and quantitated at 290 nm using LC-solution (version 1.25) software running under Windows-7 environment, after injecting 5µl of different standard and test sample. The α-tocopherol content was calculated in the oil from the calibration curve.
Fatty Acid Methyl Esters (FAME)
FAME were synthesised by using sodium methoxide in presence of methanol at 40°C. In a solution of fixed oil (0.1g) in methanol (25 ml), sodium methoxide solution (30% w/v in methanol, 0.1 g) was added with stirring. Reaction mixture was maintained at 40°C for 45 min. with constant shaking. Twenty-five millilitre of n-hexane was added and the solution was shaken for 20 min. The reaction was stopped using saturated solution of oxalic acid. The precipitated sodium oxalate was removed after centrifuging the mixture at 5000 r.p.m. for fifteen minutes. The supernatant was collected and dried over anhydrous sodium sulphate and were analysed by GC-FID for FAME23.
Determination of FAME by GC-FID
FAME samples were analysed using gas chromatograph (Model 2010, Shimadzu Co., Japan). The instrument is equipped with DB-23 capillary column with thickness of the film of 0.25 μm, length of 60 m, and 0.250 mm internal diameter. The optimum conditions for operating the GC with respect to temperature, flow rate of helium gas was as follows – Initial temperature of the oven was maintained at 70°C for 2 min. and then raised to 200°C (at rate of 4°C/min), thereafter the temperature was maintained at 200°C for 15 min. Separation of analyte were achieved by carrier gas (He) at a Linear velocity of 35 mL/min. The injection volume of samples was 1µL and the split ratio was 1:50. Injector port and the detectors were maintained at temperature of 240°C. The signals were recorded using windows 7 based GC–solution software (version 1.25) and the data were analysed. Different fatty acid methyl esters of oak seed oil were identified, using standard FAME which contains 37 methyl ester of C4 – C24 fatty acid. The results of the three independent reactions were averaged on the basis of three different experiments.

β-carotene Bleaching (BCB) Assay24
β-carotene (5 mg) was dissolved in 50 ml of chloroform. In a separate Erlenmeyer flask, linoleic acid (40mg) and Tween-40 (400mg) were taken and an aliquot of β-carotene (3 ml) solution was added. It was mixed and set aside for 2 minutes. The chloroform was evaporated using N2 gas. The resultant mixture was dissolved in 100 ml of distilled water. Immediately after preparation the absorbance of this solution was recorded at 470 and 700 nm. Different solutions of oil (50 µg/ml to 1000 µg/ml) were prepared in methanol (with the aid of 0.05% Tween-40). β-Carotene-linoleic acid emulsion (1ml) was mixed with different solutions of oil (0.25 ml). All the solutions (control and test) were capped and incubated (50°C) for 1 hour. The control sample contain equivalent amount of methanol (0.05% Tween-40). The absorbance of the solutions (λ470 and λ700 nm) was determined after 60 min. All determinations were carried out in triplicate; the degradation rate (DR) and antioxidant activity was calculated.
Degradation rate (DR) of β-carotene = Ln(Ainitial/Asample)/60
![]()
Statistical Analysis
Results are expressed as mean ± standard deviation (SD). Graph-Pad Prism 5 (San Diego, CA, USA) for Windows was used for statistical analyses of experimental data.
Results and Discussion
The total amount of the oil obtained from the dried seeds of oak was 7.2 ± 0.3%. The presence of unsaturated fatty acid was confirmed from its iodine value and absorption maxima (λmax) at 215nm. A secondary λmax was observed at 270 nm. Figure 1, depicts the ultraviolet spectrum of oak oil in hexane. Table 1, represents the physical properties of the oil. Acid, saponification and iodine values were 5.8, 187.2, and 72.6, respectively. The percentage of α-tocopherol was 139.1 mg/kg.
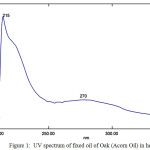 |
Figure 1: UV spectrum of fixed oil of Oak (Acorn Oil) in hexane.
|
Table 1: Some physical and chemical properties of Oak fruit oil
| Parameters | Values |
| Specific density (20ºC) | 0.9215 ± 0.0008 |
| Refractive Index (25ºC) | 1.4572 ± 0.0006 |
| Acid Value | 5.8 ± 1.2 |
| Saponification Value | 187.2 ± 4.4 |
| Iodine Value (Wij’s Method) | 72.6 ± 1.9 |
| α-tocopherol content (mg/kg) | 139.1 ± 3.9 |
* Values are given as Mean±SD (n=3)
The FT-IR spectrum (as thin film) reveals characteristic signal at 723 (cis –CH=CH– out of plane bending); 800 (-CH=CH- out of plane bending); 1026 (-CO- stretch), 1098 (-OCH2 stretch), 1163 (-CO- stretch); 1238 (-CO- stretch); 1260 (-CO- stretch), 1331, 1377 (-CH3 bending), 1464 (–CH2‑ bending), 1746 (C=O esters); 2853 and 2924 cm-1 (symmetrical and asymmetrical Stretching of-CH2) and 3007 cm−1 (trans =C–H stretch) were observed in IR spectrum25-26 (Fig. 2). Presence of weak signal at 1653 cm-1(cis -C=C- stretch) indicates the presence of non-conjugated double bond in fatty acid, which are categorised as MUFA and PUFA (Table 2 and Fig. 3). The signal at 800 cm-1 (=CH- out of plane bending) was not observed in different fixed oil obtained from soyabean, sunflower or virgin walnut oil seeds27.
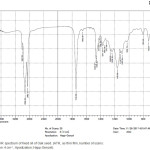 |
Figure 2: FT-IR spectrum of fixed oil of Oak seed. (ATR, as thin film, number of scans: 20, resolution: 4 cm−1, Apodization; Happ-Genzel). Click here to View figure |
The composition of the fatty acid of the seed analysed are recorded in Table 2 and Fig. 3. The composition of the fatty acid showed that oleic acid (58.13%), linoleic acid (19.84 %), palmitic acid (15.99%), stearic acid (2.27%), α-linolenic acid (1.31%), heptadecanoic (0.58%), cis-11-eicasenoic acid (0.50%) were major constituents; where as other fatty acids like arachidic (0.35%), palmitoleic (0.29%), cis-10-heptadecenoic (0.29%), behenic (0.23%), lignoceric (0.12%) and myristic acid (0.10%) as minor constituents. With respect to the fatty acid composition like oleic acid and palmitic acid the oil is similar to some edible oils like palm oil. The composition of the fatty acid of the oil of Quercus infectoria extracted using n–hexane showed the presence of saturated fatty acid, (SFA, 19.64%), monosaturated fatty acid (MUFA, 59.21%), polyunsaturated fatty acid (PUFA, 21.15%). The predominant fatty acid in the extracted oil was the oleic acid (C18:1). The results showed that the oleic acid content in the reported species was less compared to our studies. But the palmitic, linoleic and stearic acid were high in the reported species. Due to its fatty acid content this oils may be used in the food supplements to prevent chronic diseases. This oil also contains linoleic acid and α-linolenic acid (ALA) which may also be an edible source and can be used as dietary supplements.
Table 2. Fatty acid composition (as percent of Total Fatty Acids) of Oak seed oil (Acorn oil, analysed as FAME)
| Fatty acid | % Content* |
| Myristic (C14:0) | 0.10 |
| Palmitic (C16:0) | 15.99 |
| Heptadecanoic (C17:0) | 0.58 |
| Stearic (C18:0) | 2.27 |
| Arachidic (C20:0) | 0.35 |
| Behenic (C22:0) | 0.23 |
| Lignoceric (C24:0) | 0.12 |
| ƩSFAa | 19.64 |
| Palmitoleic (C16:1) | 0.29 |
| Cis-10-heptadecenoic (C17:1) | 0.29 |
| Oleic (C18:1) | 58.13 |
| Cis-11-Eicosenoic (C20:1) | 0.5 |
| ƩMUFAb | 59.21 |
| Linoleic (C18:2) | 19.84 |
| α-linolenic (18:3) | 1.31 |
| ƩPUFAc | 21.15 |
* Mean of three replicates; aSFA = Saturated fatty acids;
bMUFA= monounsaturated fatty acids; cPUFA= Polyunsaturated fatty acids
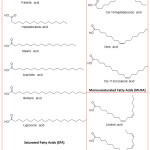 |
Figure 3: Chemical structures of fatty acids identified in a sample of fixed oil of Oak |
Table 3: Antioxidant activity of the oil
| Sample | IC50 (µg/ml) | |
| DPPH radical activity* | β-Carotene bleaching Assay* | |
| Oil | 170.5 ± 2.1 | 265.5 ± 2.8 |
| Rutin | – | 8.2 ± 0.5 |
| α-Tocopherol | 83.5 ± 1.5 | – |
* Values are given as Mean±SD (n=3)
DPPH was used to test various samples for its free radical scavenging activity. The antioxidant compound either donates an electron or hydrogen to DPPH when they react with it, neutralizing its free radical activity. In the present study the IC50 of extracted oil was 170.5 µg/ml compared to 83.5 µg/ml of α-tocopherol. The oil is a potent antioxidant which may be due to phenolic compounds, α-tocopherol, flavonoids and numerous different fatty acids. Many factors contribute to the antioxidant activity like PUFA, levels of α-tocopherol. β-carotene bleaching methods measure the capacity of active component to prevent or inhibit the lipid peroxidation by its antioxidant properties. In this experiment the linoleic acid forms radical which attacked the β-carotene molecule and oxidises it in absence of antioxidant. The rate of bleaching of β-carotene solution was measured by a taking its absorbance at time 0 and after 1 hour in control and in presence of antioxidant (oil or rutin). The antioxidants prevent the lipid peroxidation. The IC50 of extracted oil was 265.5 µg/ml compared to 8.2 µg/ml of rutin. This experiment indicates the presence of antioxidant compound which are capable of preventing the oxidation of β-carotene.
Conclusion
As the oil is a rich source of essential fatty acid it can be used to compensate the daily requirement of the essential fatty acid. The oil can be enhanced and used in food supplements to meet the requirement. As evident from our findings the oil contains many essential constituents in large quantities which can be further used to explore its potential as a potent biological agent against various treatable aliments. Its constituents are also similar to some of the edible oils this may be taken as an advantage and used in preparation of safe herbal preparation. The oil can also be exploited in pharmaceutical/chemical industries for its free radical scavenging activity. It may be concluded that oak can also be used in cattle feed.
Acknowledgements
The authors wish to thank the Dean of Faculty of Pharmacy and Medical Sciences and the Dean of Research and Higher Education, Al-Ahliyya Amman University, Amman, Jordan, for providing necessary facilities and financial assistance (Grant no. 2014-2013/7/3). The authors also wish to thank Executive Director, Royal Scientific Society, Amman, Jordan, for GC-FID analysis.
References
- Baydar, H.; Sagdic, O.; Ozkan, G.; Karadoganatureja, T. Food Control, 2004, 15, 169-172.
CrossRef - Rota, M.C.; Herrera, A.; Martínez, R.M.; Sotomayor, J.A.; Jordán, M.J. Food Control 2008, 19(7), 681–687.
CrossRef - Chatoui, K.; Talbaoui, A.; Aneb, M.; Bakri, Y.; Harhar, H.; Tabyaoui, M. J. Mater. Environ. Sci. 2016, 7(8), 2938-2946.
- Malar, J.; Chairman, K.; Singh, A.R.J.; Vanmathi, J.S.; Balasubramanian, A.; Vasanthi, K. Biotechnol. Rep. (Amst.) 2014, 3, 95–98.
CrossRef - Zia-Ul-Haq, M.; Ahmad, S.; Calani, L.; Mazzeo, T.; Del-Rio, D.; Pellegrini, N.; De-Feo, V. Molecules 2012, 17, 10306-10321.
CrossRef - Sindhi, V.; Gupta, V.; Sharma, K.; Bhatnagar, S.; Kumari, R.; Dhaka, N. J. Pharm. Res., 2013, 7(9), 828-835.
CrossRef - Bruneton, J. Pharmacognosy, Phytochemistry, Medicinal Plants. 2nd ed. Hampshire UK, (1999).
- Gouemo, N.P.; Yasuda, R.P.; Morad, M.; Faingold, C.L. Abs. Soc. Neurosci. Program. 2003, 212, 20.
- Basri, D.F.; Ha, F.S.; Zin, N.M.; Jantan, I. Malay J. Sci. 2005, 24, 257–262.
- Darogha,S.N. J. Kirkuk University Scientific Studies 2009, 4, 20-30.
- Fatima, S.; Farooqi, A.H.A.; Kumar, R.; Kumar, T.R.S.; Khanuja, S.P.S. J. Med. Aromatic Plant Sci. 2001, 22, 187-9.
- Yamunarani, K.; Jaganathan, R.; Bhaskaran, R.; Govindaraju, P.; Velazhahan, R. Acta Phytopathol. Entomol. Hung. 2005, 40, 43–54.
CrossRef - Aivazi, A.A.; Vijayan, V.A. Parasitol. Res. 2009, 104, 1289–1293.
CrossRef - Redwane, A.; Lazrek, H. B.; Bouallam, S.; Markouk, M.; Amarouch, H.; Jana, M. J. Ethnopharmacol. 2002, 79, 261– 263.
CrossRef - Hussein, G.; Miyashiro, H.; Nakamura, N.; Hattori, M.; Kakiuchi, N.; Shimotohno, K. Phytother. Res. 2000, 14, 510–516.
CrossRef - Hwang, J.K.; Kong, T.W.; Baek, N.I.; Pyun, Y.R. Planta Med. 2000, 66, 273-4.
CrossRef - Kaur, G.; Hamid, H.; Ali, A.; Alam, M.S.; Athar, M. J. Ethnopharmacol. 2004, 90, 285-92.
CrossRef - Rasineni, G.K.; Siddavattam, D.; Reddy, A.R. J. Med. Plants Res. 2008, 2, 285–291
- Ross, J.A.; Kasum, C.M. Ann. Rev. Nutr. 2002, 22, 19–34.
CrossRef - Kaur, G.; Athar, M.; Alam, M. S. Chem-Biol. Interact. 2008, 171, 272– 282.
CrossRef - AOCS. Official methods and recommended practices of American Oil Chemists’ Society.4th ed. AOCS Press, Champaign (2003).
- Elagbar, Z.A.; Naik, R.R.; Shakya, A.K.; Bardaweel, S.K., Journal of Chemistry (Hindawi) 2016, 6948098, 6 pages. http://dx.doi.org/10.1155/2016/6948098.
CrossRef - Naik, R.R. Oriental J. Chem. 2015, 31(4), 1929-1935.
- Lim, Y.Y.; Quah, E.P.L. Food Chem. 2007, 103, 734-740.
CrossRef - Guillén, M.D.; Cabo, N. Journal of the American Oil Chemists’ Society, 1997, 74(10), 1281–1286.
CrossRef - Lerma-García, M.J.; Ramis-Ramos, G.; Herrero-Martínez, J.M.; Simó-Alfonso, E.F. Food Chem. 2010, 118(1), 78–83.
CrossRef - Liang. P.; Wang, H.; Chen, C.; Ge, F.; Liu, D.; Li, S.; Han, B.; Xiong, X.; Zhao, S. Journal of Spectroscopy (Hindawi). 2013, 305604, 6 pages. http://dx.doi.org/doi:10.1155/2013/305604.
CrossRef

This work is licensed under a Creative Commons Attribution 4.0 International License.
![]()
A New Edition of Web of Science
Journal Impact Factor
2022: 0.5
Five Year: 0.8
Journal is Indexed in

Cabells Whitelist
![]()


