Experimental and Theoretical Spectroscopic Investigations of 4-Bromo-3-methylbenzonitrile

1Department of Physics, Noorul Islam Centre for Higher Education, Kumaracoil - 629 180, Kanyakumari Dist, Tamilnadu, India.
2Nano Computational Laboratory, Department of Nano Technology, Noorul Islam Centre for Higher Education, Kumaracoil - 629 180, Kanyakumari Dist, Tamilnadu, India.
Corresponding Author E-mail: shajikumaar@yahoo.com
DOI : http://dx.doi.org/10.13005/ojc/340338
Download this article as:
![]()
4-Bromo-3-methylbenzonitrile (4B3MBN) was investigated by electronic structure calculations based on Density Functional Theory (DFT) carried out at HF methods. The FTIR (400–4000 cm-1) and FT-Raman (50-3500 cm-1) spectra of 4B3MBN had been traced in the solid phase. The equilibrium geometrical parameters and vibrational assignments of 4B3MBN for the ground state had been deliberated through the theoretical methods invoking a basis set. The charges are computed by MA with same basic sets tabulated. The visual representations are the mostly welcomed one compared with other studies. Finally, spectra of the title compound have good complement while compared with the calculation results were applied to simulate infrared and Raman spectra.
KEYWORDS:DFT; TED; VEDA; 4B3MBN
Introduction
The many organic molecules investigated for future applications through the experimental as well as the theoretical methods in the various twigs of the science and engineering.1 The theoretical methods have the fast and furious results for the larger molecules to evaluate the applications in addition to their physicochemical properties. The computational techniques powerful tool for the pin pointed answers for the molecules, So as to corroborate and yet expand the experimental results. Benzonitrile is the child molecule to the parent molecule ammonia to toluene, which had the enormous changing with the consequence of the particular ratio.1 Benzonitrile has the nick names like phenyl cyanide or cyanobenzone; these are very sensitive in air, skin and eye nuisance. The fragrances, cosmetics, steroid, aromatic alcohols for color removers, solvents for fatty acids, hydrocarbons and oils are used with benzonitrile as a chemical broker. The existence of Vitamin B-complex in plants and animal tissues helps to increase the salicylate level in blood. This complex is used in cholocystrographic tests, urology media, miticides and medicine productions.2
Benzonitrile compound is the best solvent in the chemical and physical laboratories. Because of benzene has an aprotic polar molecule with a dipole moment of 4.18Debye. The properties enhanced while added the substituted roles to the benzene. The substitution benzonitrile compounds had weak effect and strong inhibitory effect as a consequence of its position. The catalytic rate of the nitrilase enzyme is the vast cause for the weak effect in the meta or para position of benzonitrile. In the ortho position of the benzonitrile has strong effect due to steric hindrance.3 Benzonitrile is used as antiseptic, anti-urinary, pharmaceutical, agrochemical intermediates, epoxy curing agent and dye sensitizers etc.
The title compound 4B3MBN is almost planar and the derivatives are used like midways in the production of phthalocyanine dyes. The surrogated phthalocyanine dyes are used for DSSC, photo redox responses and photodynamic cancer therapy.4 To the best of our knowledge, the vibrational assignments and other properties never determined for this compound still now. So this article going to serve about complete vibrational assignments of different modes of molecules. And electronic and thermo studies are simultaneously take over to the molecule.
Results and Discussions
Optimized Geometry
The B3LYP/6311++G(d,p) energy values are most probable global minimum energy and good agreement with experiment data.5 Table.3.1 shows the equilibrium geometry parameters of the 4B3MBN molecule for two dissimilar basis sets. Figure.3.1 shows the computerized structure of the 4B3MBN molecule with same basis set. The length should be increased between every atom in the calculated values while compared with experimental values because of substituent of the title molecule. The length and angle of the Br substituent are longer value 1.91Å in all other compound bonding. Carbon interactions are short value in the whole molecule. These effects are qualified for the intra charge transformations (ICT) for stability of the molecule.
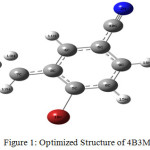 |
Figure 1: Optimized Structure of 4B3MBN |
Table 1: Geometrical Parameters of 4B3MBN
|
Bond Length |
B3LYP |
Exp. |
Bond Angle |
B3LYP |
Exp. |
Dihedral Angle |
B3LYP |
|
Br1-C5 |
1.91 |
1.882 |
C4-C3-C5 |
120 |
121 |
C5-C3-C4-C6 |
0 |
|
N2-C10 |
1.1466 |
1.133 |
C4-C3-C7 |
120 |
120.8 |
C5-C3-C4-H11 |
180 |
|
C3-C4 |
1.54 |
1.503 |
C4-C3-H13 |
76.55 |
C7-C3-C4-C6 |
180 |
|
|
C3-C5 |
1.3552 |
1.371 |
C5-C3-C7 |
120 |
C7-C3-C4-H11 |
0 |
|
|
C3-C7 |
1.54 |
1.503 |
C5-C3-H13 |
163.45 |
H13-C3-C4-C6 |
180 |
|
|
C3-H13 |
1.2703 |
C3-C4-C6 |
120 |
120.8 |
H13-C3-C4-H11 |
0 |
|
|
C4-C6 |
1.3552 |
1.371 |
C3-C4-H11 |
120 |
119.9 |
C4-C3-C5-Br1 |
180 |
|
C4-H11 |
1.07 |
0.96 |
C6-C4-H11 |
120 |
119.9 |
C4-C3-C5-C8 |
0 |
|
C5-C8 |
1.54 |
1.503 |
Br1-C5-C3 |
120 |
119.6 |
C7-C3-C5-Br1 |
0 |
|
C6-C9 |
1.54 |
1.503 |
Br1-C5-C8 |
120 |
119.6 |
C7-C3-C5-C8 |
180 |
|
C6-C10 |
1.54 |
1.503 |
C3-C5-C8 |
120 |
118.6 |
H13-C3-C5-Br1 |
0 |
|
C7-H12 |
1.07 |
0.96 |
C4-C6-C9 |
120 |
121.8 |
H13-C3-C5-C8 |
180 |
|
C7-H13 |
1.07 |
0.96 |
C4-C6-C10 |
120 |
119.6 |
C4-C3-C7-H12 |
180 |
|
C7-H14 |
1.07 |
0.96 |
C9-C6-C10 |
120 |
120.3 |
C4-C3-C7-H14 |
0 |
|
C8-C9 |
1.3552 |
1.371 |
C3-C7-H12 |
90 |
109.5 |
C5-C3-C7-H12 |
0 |
|
C8-H15 |
1.07 |
0.93 |
C3-C7-H14 |
144.74 |
C5-C3-C7-H14 |
180 |
|
|
C9-H16 |
1.07 |
0.93 |
H12-C7-H13 |
144.74 |
C3-C4-C6-C9 |
0 |
|
|
H12-C7-H14 |
125.26 |
C3-C4-C6-C10 |
180 |
||||
|
H13-C7-H14 |
90 |
109.5 |
H11-C4-C6-C9 |
180 |
|||
|
C5-C8-C9 |
120 |
119.9 |
H11-C4-C6-C10 |
0 |
|||
|
C5-C8-H15 |
120 |
119.9 |
Br1-C5-C8-C9 |
180 |
|||
|
C9-C8-H15 |
120 |
119.9 |
Br1-C5-C8-H15 |
0 |
|||
|
C6-C9-C8 |
120 |
C3-C5-C8-C9 |
0 |
||||
|
C6-C9-H16 |
120 |
119.9 |
C3-C5-C8-H15 |
180 |
|||
|
C8-C9-H16 |
120 |
119.9 |
C4-C6-C9-C8 |
0 |
|||
|
C4-C6-C9-H16 |
180 |
||||||
|
C10-C6-C9-C8 |
180 |
||||||
|
C10-C6-C9-H16 |
0 |
||||||
|
C5-C8-C9-C6 |
0 |
||||||
|
C5-C8-C9-H16 |
180 |
||||||
|
H15-C8-C9-C6 |
180 |
||||||
|
H15-C8-C9-H16 |
0 |
Vibrational Assignments
There are 41 vibrational assignments are assigns for the 4B3MBN molecule. In the 42 assignments C1 point group symmetry includes the 30 in-plane (β) and 12 out-of-plane (γ) bending vibrations. The experimental and calculated graphical representations of both spectra (FTIR & FTR) are illustrated in the Fig.3.3 and Fig.3.4. The molecule vibrational modes have been separated by 16 stretching (υ), 13 bending, 13 torsion (τ) and 18 CH modes are tabulates in Table.3.3.
CH Vibrations
Four kinds of CH moieties are calculated in the title compound 4B3MBN. In this CH moieties have been listed, six υCH and βCH as well as three torsion and δ bending vibrations. The scenery of the substituent does not align because of these stretching vibrations. The stretching has most feasible frequency between the region at 3100-3000cm‑1.6,7 The calculated stretching vibrations of the title compound region, in between 3301 -2431cm‑1. The experimental frequencies have been observed at the regions 1698, 2319 cm‑1. The CH stretching and β bending vibrations are incorporate with each other. The calculated CH β bending vibrations of 4B3MBN occurs in the region of 1233-1017cm‑1 and observed FTIR and FTR spectra at 1023 cm‑1 and 1040 cm‑1, respectively. The CH δ bending transpires at the region 950-800cm‑1 generally. The analyzed δ bending vibrations of 4B3MBN are found at 815, 941, 965 cm‑1 and observed in FTIR arises in the region 811, 888cm‑1. In this case, the δ bending has been merged with the torsion vibrations. Calculate and observed values good agreement with each other.
CBr Cibrations
CBr moieties tabulated on the root of calculated energy distribution and separated three kinds of styles. Two stretching and three in-plane bending vibrations are packed in the CBr atom. In the literature survey, the authors assigned vibrations frequency range of 1129–480 cm‑1 while the Carbon interactions with others heavy atoms like Cl, Br, I [8]. The 4B3MBN compound has the strong stretching vibrations in the region of 254, 522 and 1040 cm‑1 found from Raman spectrum. Bending vibrations in the FTR spectra occurs in the range of 134, 380 cm‑1 and the calculated frequency of the title molecule transpire in the range at 135, 219, 361cm‑1. These vibrations are very well agreed with literature survey.9
CN Vibrations
In the CN moieties, stretching frequency is the intensively localized one due to the TED for this frequency contains good contribution from that constant value of stretching force. The benzonitrile compound wavenumbers of stretching vibrations fall in the range 2220-2240cm‑1 .10 IR intensity modulated depends upon add the substituent to the benzonitrile. In this research compound has been identified at 2338 and 2217cm‑1 in Raman and FTIR spectra respectively. The calculated wavenumbers of stretching vibrations at 2331cm‑1 coincide with the Raman value. This is the ideal frequency of the whole molecule which confirmed the CN stretching with 89% assignment. The bending vibrations (β) of the title molecule spotted at 134, 380, 548 cm‑1 in Raman spectra. These experiment values are well agreement with the calculated frequencies.
CC Vibrations
There are six equivalents and two out of CC bonding in the 4B3MBN compound and totally eight CC stretching vibrations exist. Generally, the benzene ring υCC vibrational modes fall in the constituency 1650–1200cm‑1.11 The title compound υCC vibrations are found in the regions at 1203, 1375, 1428, 1459, 1541, 1648, 2217cm‑1 and 712, 1040, 1250, 1374, 1416, 1612cm‑1 (735, 965, 1022, 1141, 1170, 1209, 1283, 1315, 1343, 1411, 1492, 1569, 1612, 2331cm‑1 by theoretically) through IR & Raman spectra, correspondingly. In addition, some other modes are couples with CC bending vibrations (β) are found in the regions at 1023cm‑1 and 2217cm‑1 (1022, 2231cm‑1 by theoretically) through spectra respectively.
CCCC Torsional Vibrations
The ring torsions have been assigned in the region at below 800cm-1 which is discussed in present paper referred by earlier reports.12 The IR and Raman spectra peak observe in the regions at 578, 627 cm‑1 and 496, 572 cm-1, respectively. These peaks have been calculated at the region at 73, 144, 208, 277, 402, 472, 580, 648 cm-1by B3LYP methods which are well merge with observed values. And these wavenumbers are mixed with CCCN torsions in the investigated molecules.
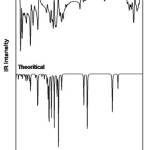 |
Figure 2: FTIR spectrum of 4B3MBN |
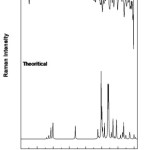 |
Figure 3: FTR spectrum of 4B3MBN |
Table 2: Vibrational assignments for 4B3MBN
|
Normal Modes |
Experimental(cm-1) |
Scaled Wavenumbers(cm-1) |
Vibrational assignments |
||||
|
Mode |
Label |
FT-IR |
FT-Raman |
B3LYP |
IR Intensity(Km/mol) |
Raman Intensity |
|
|
1 |
A” |
-2252 |
0.246 |
303.223 |
δCHCH(99) |
||
|
2 |
A” |
-613 |
257.277 |
473.250 |
δCHCH(84)+ τHCCC(13) |
||
|
3 |
A” |
73 |
4.238 |
9407.325 |
τCCCC(41)+ τCCCβr(35) |
||
|
4 |
A’ |
134 |
135 |
6.947 |
9062.251 |
βCCC(46)+βCCN(38)+βCCβr(11) |
|
|
5 |
A’ |
144 |
4.597 |
818.871 |
τCCCC(60)+ τHCCC(17) |
||
|
6 |
A” |
208 |
10.281 |
414.616 |
τCCCβr(28)+ τHCCC(26)+ τCCCC(19) |
||
|
7 |
A’ |
219 |
7.462 |
3594.329 |
βCCβr(62)+βCCC(23) |
||
|
8 |
A’ |
254 |
266 |
0.919 |
3760.133 |
νβrC(46)+βCCC(28) |
|
|
9 |
A” |
277 |
3.120 |
93.043 |
τHCCC(40)+ τCCCβr(22)+ τCCCC(13) |
||
|
10 |
A’ |
380 |
361 |
16.581 |
1306.858 |
βCCC(44)+βCCN(12)+βHCC(12)+βCCβr(10) |
|
|
11 |
A” |
402 |
10.840 |
59.070 |
τCCCC(72)+ τCCCN(10) |
||
|
12 |
A” |
496 |
472 |
9.471 |
506.472 |
τCCCC(54)+ τCCCN(31)+ τCCCβr(11) |
|
|
13 |
A’ |
522 |
525 |
2.798 |
240.879 |
βCCC(35)+υCC(22)+υβrC(18) |
|
|
14 |
A’ |
548 |
553 |
3.841 |
1931.634 |
βCCC(43)+βCCN(12) |
|
|
15 |
A” |
578 |
572 |
580 |
1.482 |
19.100 |
τCCCC(77)+ τCCCN(15) |
|
16 |
A’ |
587 |
8.496 |
302.955 |
βCCC(31)+βCCN(28) |
||
|
17 |
A” |
627 |
648 |
4.103 |
239.624 |
τCCCC(67)+ τCCCN(14) |
|
|
18 |
A’ |
697 |
686 |
17.909 |
694.714 |
βHCC(42)+βCCC(38) |
|
|
19 |
A’ |
712 |
735 |
13.119 |
1733.726 |
βCCC(31)+υCC(13) |
|
|
20 |
A” |
794 |
10.720 |
16.150 |
τHCCC(55)+δCCCH(20)+ τHCCH(17) |
||
|
21 |
A” |
811 |
815 |
37.046 |
80.179 |
δCCCH(70)+ τHCCC(12) |
|
|
22 |
A” |
888 |
941 |
0.242 |
19.861 |
τHCCH(72)+ τHCCC(19) |
|
|
23 |
A’ |
965 |
8.577 |
280.184 |
νCC(57) |
||
|
24 |
A’ |
1023 |
1040 |
1022 |
86.113 |
1197.028 |
βCCC(47)+υCC(26)+υβrC(10) |
|
25 |
A’ |
1141 |
6.624 |
10.146 |
βHCC(39)+υCC(16) |
||
|
26 |
A’ |
1170 |
0.274 |
191.564 |
βHCC(56)+υCC(16) |
||
|
27 |
A’ |
1250 |
1209 |
9.482 |
1596.052 |
βHCC(32)+υCC(22) |
|
|
28 |
A’ |
1266 |
1283 |
15.357 |
281.706 |
βHCC(51)+υCC(21) |
|
|
29 |
A’ |
1315 |
39.844 |
201.944 |
υCC(73) |
||
|
30 |
A’ |
1375 |
1374 |
1343 |
126.961 |
499.217 |
βHCC(45)+υCC(24) |
|
31 |
A’ |
1428 |
1416 |
1411 |
75.293 |
152.166 |
νCC(53)+βHCC(16) |
|
32 |
A’ |
1459 |
1492 |
95.942 |
199.388 |
νCC(46)+βHCC(36) |
|
|
33 |
A’ |
1541 |
1569 |
41.204 |
789.702 |
νCC(53)+βHCC(16) |
|
|
34 |
A’ |
1648 |
1612 |
1612 |
131.186 |
1422.424 |
νCC(52)+βHCC(12) |
|
35 |
A’ |
1698 |
1701 |
32.549 |
172.222 |
νCH(55)+βHCH(32) |
|
|
36 |
A’ |
2217 |
2338 |
2331 |
62.212 |
3298.040 |
νNC(89)+υCC(11) |
|
37 |
A’ |
2319 |
2431 |
108.420 |
137.357 |
νCH(95) |
|
|
38 |
A’ |
3135 |
21.637 |
533.274 |
νCH(68)+βHCH(19) |
||
|
39 |
A’ |
3145 |
72.690 |
215.473 |
νCH(24)+βHCH(24) |
||
|
40 |
A’ |
3195 |
0.526 |
98.421 |
νCH(99) |
||
|
41 |
A’ |
3215 |
0.121 |
244.687 |
νCH(99) |
||
|
42 |
A’ |
3301 |
29.107 |
23.606 |
νCH(80)+βHCH(11) |
||
|
v-stretching; β-in plane bending; δ-Out-Of-plane bending; τ- torsion; TED-Total Energy Distribution |
|||||||
Molecular Electrostatic Potential
The visual representations are the mostly welcomed one compared with other studies. Molecular electrostatic potential (MEP) is the versatile used visual illustration for find out the reactivity of the molecule which explains through its colors,13 hydrogen bonding interactions and biological detection methods.14 The electrophilic and nucleophilic attacks are demonstrated by two different colors. The MEP’s of 4B3MBN calculated and drawn by the computational method in Fig.3.6. The colors are increased the order of red, yellow, green, blue. The red color starts from negative region for electrophilic reactivity and blue ends with positive region for nucleophilic reactivity regions. The values of the regions increased from red to blue (-9.944 to 9.944) for the title molecule. The carbon, nitrogen and Bromine groups are almost negative electrostatic potential for electrophilic attack. The hydrogen atoms are the positive one for nucleophilic attack. The Mulliken population analysis is showing the electronic charges distribution of the molecules which identified the support of MEP maps.
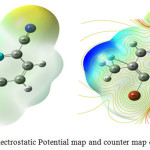 |
Figure 4: Electrostatic Potential map and counter map of 4B3MBN Click here to View figure |
Conclusion
The 4B3MBN molecule has been observed FTIR and FTR spectra for experimental studies. The theoretical calculations are performed for the B3LYP/6-311++G (d, p) and (2d, p) method. These basis sets were the best and minimum energy values compared with others. The vibrational assignments with TED % has been predicted and analyzes the vibrational studies. Both experimental and theoretical studies were compared and tabulated. MEP map drawn and explained the different charges and interactions of the molecules. The optimized parameters are the great impact for the above all. These properties show that the title compound 4B3MBN had good chemical stability and bioactivities are helping the future researchers and innovative thinkers.
References
- Ajaypraveenkumar, A.; Raman, R.G. J. Chem. Pharm. Sci. 2017, 27-41.
- El-Azab, A.S.; Jalaja, K.; Abdel-Aziz, A.M.; Al-Obaid, A.M.; Mary, Y.S.; Panicker, C.Y.; Alsenoy, C.V. J. Mol. Struct. 2016, 1119, 451-461.
CrossRef - Sudha, S.; Sundaraganesan, N.; Kurt, M.; Cinar, M.; Karabacak, M. J. Mol. Struct. 2011, 985, 148–156.
CrossRef - Ajaypraveenkumar, A.; Raman, R.G. J. Chem. Pharm. Sci. 2017, 1-9.
- Dai, S.; Weng, J.; Sui, Y.; Chen, S.; Xiao, S.; Huang, Y.; Kong, F.; Pan, X.; Hu, L.; Zhang, C.; Wang, K. Inorg. Chim. Acta. 2008, 361, 786–791.
CrossRef - Govindharaju, R.; Balasubramaniyan, S.; Rajasekar, K.; Ramachandramoorthy, T. Int. J. Pharm. Res. Rev. 2014, 3(10), 8-13.
- Remya.; Karunakaran.; Cherumuttathu H.S. J. Comput. Chem. 2014, 35, no. 12, 910-922.
- Ajaypraveenkumar, A.; Raman, R.G. J. Chem. Pharm. Sci. 2017, 10, 1309-1316.
- Saravanan, R.R.; Seshadri, S.; Gunasekaran, S.; Mendoza-Merono, R.; Garcia-Granda, S. Spectrochim. Acta, Part A. 2015, 139, 321–328.
CrossRef - Parr, R.R.; Yang, R.G. Density Functional Theory of Atoms and Molecules, Oxford University Press, New York, USA, 1989.
- Anbarasan, P.M.; Subramanian, M.K.; Manimegala, S.; Suguna, K.; Ilangovan, V.; Sundaraganesan, N. J. Chem. Pharm. Res. 2011, 3(3), 123-136.
- Shajikumar.; Ajaypraveenkumar, A.; Raman, R.G. J. Chem. Pharm. Sci. 2017, 2063-2072.
- Murugan, M.; Balachandran, V.; Karnan, M. J. Chem. Pharm. Res. 2012, 4(7), 3400-3413.
- Ajay Praveen Kumar, A.; Raman, R.G.: Sebastian, S. Recent Trends in Materials Science and Applications. 2017, 189, 629-654.
Accepted on: April 10, 2018


ISSN Online: 2231-5039

![]()


