Effect of Combined Trisaminomethane and Hexadecyltrimethyl Ammonium Bromide (Hdtab) Inhibitors on Mild Steel in Nitric Acid
 and Roland Tolulope Loto1
1Department of Mechanical Engineering, Covenant University, Canaan Land, Ota, Nigeria.
2Department of Chemical, Metallurgical and Materials Engineering, Tshwane University of Technology, Pretoria, South Africa.
Corresponding Author E-mail: akinloto@gmail.com
DOI : http://dx.doi.org/10.13005/ojc/340347
Download this article as:
![]()
The effect of combined trisaminomethane (THAM) and hexadecyltrimethyl ammonium bromide (HDTAB) as chemical inhibitors for corrosion of mild steel in 1M HNO3 was investigated at the ambient temperature of 25°C. The investigation was done with gravimetric (weight loss) method and also with the potentiodynamic polarisation technique. A potentiostat, Digi-Ivy potentiostat, connected to a computer for data collection and analysis was used for potentiodynamic polarisation experiment. The effective corrosion inhibition of the steel specimens in the HNO3 test medium, using the combined inhibitors had its best performance achieved with the 6 g/ 250 mL HNO3 concentration with weight loss of 2.99 g and a corrosion rate of 0.00913 mm/yr at 480 h of the experiment. This was closely followed with the 4 g/ 250 mL HNO3 with 3.72 g weight loss at 480 h. At this concentration, the experiment also recorded polarisation resistance (Ω) values of 3.11E+01, corrosion rate of 1.95691E-05 mm/yr and current density of 0.000175A cm-2 for the 6 g 250 mL. The calculated inhibition efficiency values are, respectively, 39.2 and 24.3 % for both the 6 and 4 g 250 mL–1 HNO3 concentrations at 480 h. The potentiodynamic polarisation results of ba and bc indicated mixed type inhibitors.
KEYWORDS:Corrosion; Electrochemical; Inhibitors; Mild Steel; Nitric Acid; Polarisation
Introduction
Mild steel has very wide application in diverse areas of use including all engineering purposes, construction, marine, industrial, domestic and services. The metal, however, has the challenge of environmental corrosive degradation in service. The use of chemical inhibitors is a major method of prevention and control of corrosion. Various corrosion scientists have shown keen interest in mild steel corrosion chemical inhibition research.1-5 This is because of the metal’s very wide applications. In this work two different chemical compounds have been used in combination. These are trisaminomethane (THAM) and hexadecyltrimethyl ammonium bromide (HDTAB). The combined choice in use has not been influenced by any previous use separately. These chemical compounds used as inhibitors in this investigation have been of many uses in chemical, pharmaceutical and health industries.6-7 The chemical structures of the two inhibitor compounds are provided in Figure 1 (a) and (b).8
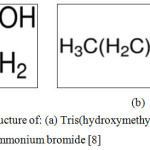 |
Figure 1: Chemical structure of: (a) Tris (hydroxymethyl) aminomethane. (b) Hexadecyl trimethyl ammonium bromide8 |
Hexadecyltrimethylammonium bromide and THAM are known corrosion inhibitors for mild steel in H2SO4.9-16 HDTAB is also a known corrosion inhibitor for aluminium alloy in hydrochloric acid.17 Hexadecyltrimethyl- ammonium bromide is a cationic surfactant used as a template in the synthesis of mesoporous γ-Fe2O3.
Commonly used as a strong oxidizing agent,18 HNO3 which is a highly corrosive mineral acid is also the primary reagent used for nitration.
The structure and chemistry of these two chemical inhibitor compounds are expected to work as good corrosion inhibitors for mild steel in this acid environment.
Experimental and Methods
Composition of Mild Steel
The material used as the test electrodes (specimens) was locally obtained mild steel. The compositions of the steel are given in Table 1.
Table 1: Nominal composition of mild steel
| C | Si | S | P | Mn | Ni | Cr | Mo | V | Cu | Sn | Al |
| 0.171 | 0.209 | 0.04 | 0.025 | 0.55 | 0.141 | 0.067 | 0.011 | 0.002 | 0.252 | 0.01 | 0.003 |
| Zn | Nb | Ti | W | Pb | B | Ca | Ce | Zr | Bi | Co | Fe |
| 0.003 | 0.012 | 0.0004 | 0.004 | 0.0004 | 0.001 | 0.0007 | 0.008 | 0.002 | 0.001 | 0.009 | 98.48 |
Materials Preparation
The cylindrical mild steel (13 mm diameter) used as test samples was cut into several pieces of size 13 mm x 10 mm coupons for the two different tests. These are weight loss measurements and the potentiodynamic polarisation measurements. The samples used for weight loss experiment were de-scaled with a wire brush; ground with various grades of abrasive paper and then polished to 6 μm. The samples were then rinsed in distilled water to remove any dirt/corrosion products and then cleaned/degreased with acetone. Another set of samples for the corrosion polarisation experiments were similarly prepared as just described above. The specimens were separately mounted in resin to ensure that only the tested surface of the sample was exposed to the test medium. Each of the samples was spot-welded to copper wire before mounting. The surface of the samples were thoroughly cleaned and prepared for experiments using silicon carbide papers of up to 1000 grade before being cleansed in distilled water and dried with acetone. Six different weights of THAM and HDTAB of 1 to 6 g were made and prepared into the various per cent concentrations for potentiodynamic polarisation tests.
Experimental set-up
Seven different test environments were used for the experiments with one being the control experiment. The six other experiments were done with different concentrations of the combined inhibitors in 1 M HNO3. The six different combined inhibitors concentrations used ranged from 1 to 6 g/ 250 ml HNO3 respectively.
Weight loss Experiments
Separately weighed specimens were fully immersed, in turns, in 250 ml of HNO3 test environment in which different predetermined concentrations of the inhibitors (as mentioned above) at room temperature had been added. Each specimen was exposed to the test environment and readings were recorded at a time interval of 48 hours over a period of 480 hours. Each of the test samples was then removed from the test medium and washed with water. The samples were further rinsed with acetone, dried and re-weighed. The results obtained were each separately plotted against exposure time after different but relevant calculations.
Corrosion rate (CR) values were calculated from the weight loss data using this formula:
CR (mm/yr) = 87.6 x (W/DAT) (1)
where:
W = weight loss in milligrams; D = metal density in g/cm3
A = area of sample in cm2; T = time of exposure of the metal sample in hours
Similarly, the per cent inhibitor efficiency is calculated from the formula:
Inhibitor Efficiency (%) = 100·(CR uninhibited– CR inhibited)/ CR uninhibited (2)
where:
CR uninhibited = corrosion rate of the uninhibited system
CR inhibited = corrosion rate of the inhibited system
Potentiodynamic Polarisation Experiments
Polarisation tests on the corrosion cell set-up; with and without the addition of various inhibitor concentrations were carried out with the same test environments as above. The polarisation tests were performed at ambient temperature of 25oC with Digi-Ivy potentiostat. A counter electrode made of platinum rod was used and the used reference electrode was silver-silver chloride electrode (Ag/AgCl) with pH of 6.5. A scan rate of 0.002 V/s and scanned potential coverage of -1.5V to +1.5 V were used; while polarisation was done at 300 mV potential in the anodic direction and also in cathodic direction. The obtained current values are given on a logarithmic scale. The data generated include current density, corrosion rate, and polarisation resistance. The results are tabulated in Table 1 and further given graphically in Figure 6.
Optical Microscopy/Micrographs
Photomicrographs were made from the selected surface parts of the test samples after the weight loss experiments using the optical / metallurgical microscope, (Figure 8)
Scanning Electron Microscopy
Some selected portions of the test electrodes were examined with scanning electron microscope (SEM) and the Energy Dispersive Spectroscopy (EDS) for surface composition and surface corrosion product analysis. The micrographs obtained are presented in Figures 9 and 10.
Results and Discussion
Weight Loss Experiment
Results of weight-loss experiments for test specimens in the 1M HNO3 with and without combined trisaminomethane and hexadecyltrimethyl ammonium bromide ((HOCH2)3CNH2 and [(C16H33)N(CH3)3]Br) inhibitors are given in Figure 2. The weight loss (g) increased with increase in the exposure time. As at the 240 hours (10th day) of the experiment, the 4 and 5 g/250 ml concentration achieved the same weight loss of 3.54 g; this however changed from that time to the end of the experiment when the 4 g/ 250ml HNO3 performed better recording 3.72 g weight loss and the 5 g concentration recorded 4.39 g loss. The concentration of 6 g/ 250 ml of nitric acid provided the best inhibition performance overall. The combined inhibitor concentrations of 1, 2 and 3 g / 250 ml HNO3 clearly performed lower than the test without added inhibitor. It is thus apparent that the lower the concentrations of these combined inhibitors the less effective is the corrosion inhibition performance. The results obtained here confirm that the combined inhibitors can exhibit significant corrosion inhibition at the higher concentrations of use. The corrosion rate results that emanated from the weight loss, Figure 2, give a corresponding corrosion rate profile.
A clear observation here was the decrease in the rate of corrosion as the inhibitor concentrations were increasing. This trend achieves a value of 0.0091 mm/yr for the 6 g/ 250ml HNO3 combined inhibitor concentration, 0.013 g for the 5 g’s and 0.0182 mm/yr for the 3 g’s inhibitor concentrations respectively as at the 480 hours of the experiment. The observation that the corrosion rates decrease with time is an indication that the test environment was getting weakened by the corrosion products within the test environment that has reduced the acid test environment strength.
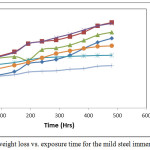 |
Figure 2: Plot of weight loss vs. exposure time for the mild steel immersed in 1M HNO Click here to View figure |
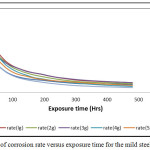 |
Figure 3: Curves of corrosion rate versus exposure time for the mild steel immersed in HNO3 |
The inhibition efficiency obtained by calculation from the corrosion rate data, Figure 3 confirmed the effectiveness of the combined trisaminomethane and hexadecyltrimethyl ammonium bromide ((HOCH2)3CNH2 and [(C16H33)N(CH3)3]Br) as inhibitors for the mild steel specimens in 1M HNO3 test medium only at the high concentrations of use such as obtained in the 6 g/ 250ml HNO3. In Figure 4, the per cent inhibition efficiency values decreased with the exposure time of the experiment. This can be explained to be due to the weakening of the test environment due to the stifling effect of corrosion deposits emanating from the corrosion reactions process.
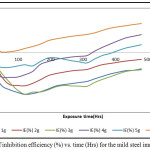 |
Figure 4: Plot of inhibition efficiency (%) vs. time (Hrs) for the mild steel immersed in HNO3 |
Potentiodynamic Polarization Method
A summary of results from polarisation experiments of corrosion and inhibition of mild steel in NHO3 used in this work is shown in Table 2. The potentiodynamic polarisation results obtained from the different concentrations of combined trisamino-methane and hexadecyltrimethyl ammonium bromide’s corrosion inhibition of mild steel in the 1M HNO3 are presented in Figure 6. From the data obtained in Table 2, and the corrosion profile parameters in Figure 6, the corrosion current density, icorr (A/cm2), values decrease with increase in inhibitor concentration up to 2 g/ 250 ml HNO3. This trend changed from 3 g to 5 g/ 250 ml HNO3. The 6 g/ 250 ml HNO3 recorded the lowest corrosion current density while the uninhibited sample had the highest value. The corrosion rate (mm/yr) values also follow the same trend as with the current density.
Table 2: Polarisation results for the mild steel and its inhibition tests in 1M HNO3
| Weight (g) | Equilibrium (V) | Bc (V/dec) | Ba (V/dec) | Resistance (Ω) | I corr | I density | Corrosion rate | (%IE) |
| Control | -0.311 | -2.57E+00 | 0.00E+00 | 6.23E+00 | 4.13E-03 | 0.000876 | 9.78573E-05 | |
| 1 | -0.318 | -4.38E+00 | 3.69E+01 | 1.54E+01 | 1.67E-03 | 0.000355 | 3.96456E-05 | 59.48631 |
| 2 | -0.338 | -6.08E00 | 1.28E+01 | 2.83E+01 | 9.10E-04 | 0.000193 | 2.15656E-05 | 77.9622 |
| 3 | -0.316 | -5.00E+00 | 1.45E+00 | 1.93E+01 | 1.33E-03 | 0.000283 | 3.16311E-05 | 67.67528 |
| 4 | -0.331 | -5.67E+00 | 4.14E+00 | 1.79E+01 | 1.44E-03 | 0.000306 | 3.42157E-05 | 65.03513 |
| 5 | -0.333 | -4.12E+00 | 1.31E-01 | 1.18E+01 | 2.18E-03 | 0.000463 | 5.17859E-05 | 47.0802 |
| 6 | -0.358 | -6.91E+00 | 1.14E+01 | 3.11E+01 | 8.25E-04 | 0.000175 | 1.9561E-05 | 80.00242 |
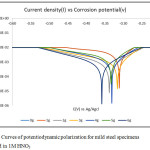 |
Figure 6: Curves of potentiodynamic polarization for mild steel specimens immersed in 1M HNO3 Click here to View figure |
The values decreased with increase in inhibitor concentration but haphazardly. Here also the concentration of 6 g/ 250ml HNO3 recorded the lowest corrosion rate value of 1.95619E-05. The polarization resistance (Ω) values in following the same trend as for the formers decrease at random also with increase in inhibitor concentration recording a polarization value of 3.11E+01 Ω. What all these indicate is that the combined inhibitors effectiveness increases in part with the increase in concentration with the 6 g/250 ml HNO3 concentration maintaining good inhibition performance throughout the experimental period. The combined inhibitors passive film adherence to the electrode’s surface really became very effective at the concentration of 6 g/ 250 ml HNO3 used. It could be inferred that effective performance of these combined inhibitors could be better achieved at higher concentrations. With the exception of 2 and 3 g/250ml HNO3, the open corrosion potential value(s) also increased positively with increase in the combined inhibitors concentration.
Optical Microscopy
Photomicrographs were made of representative test samples used in the weight loss experiments as shown in Figures 7 and 8. Figure 7 indicates micrographs of samples from weight loss tests after immersion in 1M HNO3 without the addition of the two inhibitors – this is the control experiment. In spite of low quality of the photomicrographs, significant corrosion of the surface was visible. In Fig. 8, the 6 g/ 250mL HNO3 concentration of the combined inhibitor, an improved surface feature that could be associated with corrosion inhibition of the mild steel in the acid was observed. Effectiveness of the combined inhibitors’ synergism on the test samples in the strong acid is apparent; though some surface corrosion could still be observed. The inhibitors provided the surface film barrier on the metal –acid test environment interface. The active corrosion reactions process is thus reduced for some effective surface inhibition. The strong acid used and the low combined inhibitor concentrations could also cause reduced inhibition manifesting in the corrosion of the test electrodes observed.
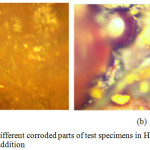 |
Figure 7: (a and b): Different corroded parts of test specimens in HNO3 without the combined inhibitors addition Click here to View figure |
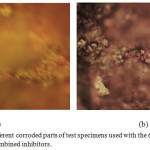 |
Figure 8: (a and b) Different corroded parts of test specimens used with the 6 g / 250 ml HNO3 concentration of the combined inhibitors. |
Scanning Electron Microscopy
Figures 9 and 10 show respectively the micrographs and the analysis of surface of test samples after the experiments. A further composition of the surface is presented in Table 3. The specimen’s surface showed apparent degradation and corrosion deposits The EDS made from the specimen’s surface showed predominantly the iron peak. However, other elements shown in the composition include C, Si, O, and Fe.
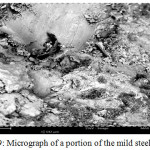 |
Figure 9: Micrograph of a portion of the mild steel sample. |
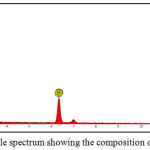 |
Figure 10: EDS visible spectrum showing the composition of the sample |
Table 1: Table of elements and their concentration
| Element No. | Element Symbol | Element | Confidence | Concentration | Error |
| 8 | O | Oxygen | 100.0 | 79.1 | 0.8 |
| 26 | Fe | Iron | 100.0 | 14.5 | 1.2 |
| 6 | C | Carbon | 100.0 | 4.6 | 2.2 |
| 14 | Si | Silicon | 100.0 | 1.9 | 2.9 |
As shown in Figure 1, both inhibitors, that is, the trisaminomethane and hexadecyltrimethyl ammonium bromide consist of nitrogen (N), and oxygen (O). Heteroatoms such as these and S, are usually contained within their chemical constituents’ structure and their role in enhancing inhibition of corroded metals by atomic/molecular adsorption may be significant.19 Several factors are involved in the inhibitory mechanistic behaviour of these atoms. These may include among others: the numerically available active centres in the molecule for adsorption, the size of the molecule, the formation of metallic complexes and the adsorption mode.20 The density of the charges is also an important factor. The effective and remarkable corrosion inhibition characteristics of several organic compounds for mild steel in diverse test media had been mentioned in research studies.21–26 In the present investigation, trisaminomethane and hexadecyltrimethyl ammonium bromide were also used as organic compounds with good corrosion inhibition of mild steel in nitric acid even at their low concentrations as shown by the obtained results. The two inhibitors used in combination, can also be considered as environmentally friendly inhibitors just like any others that are currently being used in corrosion protection research studies.27–34
Conclusion
From all the above, the following conclusions are made:
The combined trisaminomethane and hexadecyltrimethyl ammonium bromide was a good inhibitor for mild steel corrosion in the HNO3 concentrations used. They gave up to 39 % efficiency of inhibition with 6 g / 250 mLHNO3 concentration within the experimental time. It is anticipated, from the increasing effect of the inhibitors with concentration, that further increase will yield better inhibition efficiency and corrosion prevention performance.
The effectiveness of corrosion inhibition performance of trisaminomethane and hexadecyltrimethyl ammonium bromide as chemical inhibitors in all the experiments was achieved.
Acknowledgement
The authors wish to acknowledge the laboratory work contribution of Mr. Okam Sorochukwu; and also the Department of Mechanical Engineering, Covenant University, Ota, Nigeria for the provision of research facilities.
References
- Solmaz, R. Corros Sci 2010, 52: 3321.
CrossRef - Parameswar,i K.; Chitra, S.; Selvaraj, A.; Brindha, S.; Menaga, M. Port. Elect. Acta, 2012, 30. 126.
- Loto, C.A.; Loto, R.T.; Joseph, O.O. S. Afr. J. Chem. 2017, 70, 38–43.
- Loto, R.T.; Loto, C.A.; Popoola, A.P.; Kupolati, W. J. Chem. Soc. Pak. 2016, 38(2), 222–233.
- Loto, C.A.; Joseph, O.O.; Loto, R.T. J. Mater. Environ. Sci. 2016, 7 (3), 915-925.
- Gomori, G. Methods Enzymology 1955, 1, 138-146 http://2008.igem.org/ wiki/images/ 8/ 84/Protein_Buffers.pdf.
CrossRef - Clarke, J.D. Cold Spring Harbor Protocols. (3): pdb.prot5177. doi:10.1101/ pdb. Prot 2009, 5177. ISSN 1940-3402 PMID 20147112.
- Chemical structures of THAM and HDTAB: http://www.sigmaaldrich.com/ catalog/ product/aldrich/855820?lang=en®ion=NG.
- Osman, M.M. Anti-Corro. Methods and Matls, 1998, 45 (3): 176-180, doi: 10. 1108/00035599810216894.
- Mukta, S.; Jyoti C.; Gurmeet, S. Indian J Chem Tech 2009, 16 (7): 339-343.
- Guo, D.; Xing, W.; Shan, Y-B.; Lu T-H. Thin Solid Films 1994, 243, !-2):540-543 https://doi.org/10.1016/0040-6090(93)04094-9.
CrossRef - Bílková, K.; Gulbrandsen, E. Electrochim Acta 2008, 53 (16): 5423–5433, http://doi.org / 10.1016 /j. electacta.2008.02.096.
- Osman, M. Anti-Corro. Methods and Matls 1998, 45 (3):176-180, DOI: 10.1108/ 00035599810216894.
- Soror, T.Y.; El-Ziady, M.A. Matls Chem Phys. 2003, 77 (3), 697–703, http://doi.org/ 10. 1016/S0254-0584(02)00129-3.
- Arvydas Stoncius, Corrosion inhibitor for deicing fluids, Patent US5708068A, published on 1998-01-13.
- Rana, A. M.; Anaee, R.A.M. Int. J. of Sci and Eng Res. 2015, 6 (4): 683.
- Niamien, P.M.; Ossonon, D.; Trokourey, A.; Kouassi, H.A.; Bokra, Y. Afric J of P Appl Chem. 2011, 5 (9), 297-306.
- Nitric acid: Wikipaedia – https://en.wikipedia.org/wiki/Nitric_acid, Retrieved 19-04-2017.
- Donnelly, B.; Downier, T.C.; Grzeskowiak, R.; Hamburg, H.R.; Short, D. Corros Sci. 1978, 18: 109 –116.
CrossRef - Chetouani, A.; Hammouti, B.; Benhadda, T.; Daoudi, M. App Surf Sci. 2005, 249, 375–385.
CrossRef - Bentiss, F.; Lagrenee, M.; Traisnel, M. Corrosion, 2000, 56(7): 733–742.
CrossRef - Bastidas, J.M.; Polo, J.L.; Cano, E.; Torres, C.L. J. Mater. Sci. 2000, 35: 2637–2642.
CrossRef - Abd El-Rehim, S.S.; Ibrahim, M.A.; Khaled, K.F. Appl Electrochem 1999, 29, 593–599.
CrossRef - Trabanelli, T.G. Corrosion 1991, 47(6), 410–419.
CrossRef - Abd El-Rehim, S.S.; Refay, S.A.M.; Taha. F.; Saleh, M.B.; Ahmed, R.A. J. Appl. Electrochem, 2001, 31, 429–435.
CrossRef - Abd El-Nabey, B.A.; Khamis, E.; Ramadan, M.; El-Gindy, A. Corrosion 1996, 52(9), 671–679.
CrossRef - Negm, N.A.; Kandile, N.G.; Badr, E.A.; Mohammed, M.A. Corros Sci. 2012, 65, 94–103.
CrossRef - Abdel-Gaber, A.M.; Abd-El-Nabey, B.A.; Khamis, E.; Abd-El-Khalek, D.E. Desalination 2011, 278 (1-2), 337–342.
CrossRef - Lecante, A.; Robert, F.; Blandinières, P.A.; Roos, C. Curr. Appl. Phys. 2011, 11(3): 714–724.
CrossRef - Radojcic, K.; Berkovic, S.; Kovac, J.; Vorkapic, F. Corros Sci. 2008, 50(5): 1498–1504.
CrossRef - Okafor, P.C.; Ikpi, M.E.; Uwah, I.E.; Ebenso, E.E.; Ekpe, U.J.; Umoren, S. A. Corros. Sci., 2008, 50 (8): 2310–2317.
CrossRef - Salasi, M.; Sharabi, T.; Roayaei, E.; Aliofkhazraei, M. Mater Chem Phys. 2007, 104(1): 183–190.
CrossRef - Blustein, G.; Romagnoli, R. Coll. Surf. A: Physicochem. Eng. Aspects 2006, 290 (1-3): 7–18.
CrossRef - Bommersbach, P.; Alemany-Dumont, C.; Millet, J.P.; Normand, B. Electrochim Acta. 2005, 51 (6): 1076–1084.
CrossRef
Accepted on: June 15, 2018


![]()


