Development of Spectrophotometric Method for Estimating Clonazepam in its Pure Form and Pharmaceutical Tablets
Sahar Rihan Fadhel and Nidhal Meteab Khamees
Chemistry Department, Science College, Diyala University, Diyala, Iraq.
Corresponding Author E-mail: Saharchemst2011@yahoo.com
DOI : http://dx.doi.org/10.13005/ojc/340354
Article Received on : January 15, 2018
Article Accepted on : March 01, 2018
Article Published : 05 May 2018
A study aimed to recommend spectrophotometric method for the determination of clonazepam (CLZ.) in pure form and their pharmaceutical tablets by the reaction of sited drug with ferric chloride in presence potassium ferric cyanide in acid medium to form prussian blue complex and determine it by UV-VIS spectrophotometric at 526 nm. The variables that affect the completion of reaction have been carefully optimized. The linearity range was (2-35 μg.mL-1) with a molar absorptivity of 3.4200×10⁴ L.mol-1.cm-1. The limit of detection was 0.5703 μg.mL-1 and Sandell’s sensitivity value was 0.0103μg.cm-2. The suggest method was successfully used to estimate clonazepam in commercial formulations.
KEYWORDS:Clonazepam; Prussian blue; ferric chloride; potassium ferric cyanide; spectrophotometry
Download this article as:| Copy the following to cite this article: Fadhel S. R, Khamees N. M. Development of Spectrophotometric Method for Estimating Clonazepam in its Pure form and Pharmaceutical Tablets. Orient J Chem 2018;34(3). |
| Copy the following to cite this URL: Fadhel S. R, Khamees N. M. Development of Spectrophotometric Method for Estimating Clonazepam in its Pure form and Pharmaceutical Tablets. Orient J Chem 2018;34(3). Available from: http://www.orientjchem.org/?p=45404 |
Introduction
Clonazepam (CLZ.) is a medication of benzodiazepine 1, belongs to a group of psychoactive drugs used in the controlling of epilepsy, is primarily used as a panacea to prevent certain types of seizures.2 Clonazepam works on receptors in the brain called GABA receptors, leading to its release, a neurotransmitter that calms the nerves.3, 4 (CLZ.) is a white powder, soluble in alcohol. When it exposed to air and light decomposes.5 Its (IUPAK) name: 5-(2-Chlorophenyl) -7-nitro -1, 3- dihydro -2H -1,4-benzodiazepin-2-one1, Figure (1).
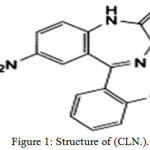 |
Figure 1: Structure of (CLN.).1 |
The literature review revealed that many analytical methods were used to quantify (CLZ.) in their bulk and pharmaceutical formulations including spectrophotometry6,7,8,9, GC-MS chromatography10, HPLC11,12,capillary electrophoresis13, electrochem-iluminescence sensors14, Voltammetry15, potentiometry16,17.
The purpose of this work is to develop a simple, rapid and accurate spectrophotometric method to measure the quantities (CLZ.) in bulk and Pharmaceutical tablets
Experimental
Apparatus
A JASCO V-650 UV-Visible double beam spectrophotometer (JAPAN) equipped with 10 mm quartz cell was used.
A FA2004 electronic balance was used for weighing the samples.
A LSB-015S Thermostatic Shaker water bath, LabTech.
Materials and Method
All chemicals used in this study were obtained from BDH and Sigma Aldrich. The standard grade powder clonazepam used in this work received in pure form (99.99%) from the State :Company: for Drug: Industries and Medical Appliances: Samara-Iraq (S.D.I.). Pharmaceutical formulation- assayed in this study; Rivotril 0.5 mg/tablet and 2mg/tablet (Roche Farma-Spain) was purchased from commercial source.
Clonazepam Standard Solution [1000μg.mL-1]
Standard (CLZ.) solution (1000μg.mL-1) was prepared by dissolution exactly 0.05gm of (CLZ.) in 5mL of methanol, and diluted to 50mL with some solvent. The stock solution was protected from light, and store at 4°C. Working standard (CLZ.) solution (200μg.mL-1) was obtained by dilution.
Ferric Chloride, FeCl3, [0.3M]
Prepared by dissolving 4.8660gm of FeCl3 in a suitable volume of distilled water then the volume was made up to 100mL.
Potassium Ferricyanide, K3[Fe(CN)6], [0.2M]
Prepared by dissolving 6.5848gm of K3[Fe(CN)6], in a suitable volume of distilled water and the volume was made up to 100mL.
Sulfuric Acid, H2SO4, [~10M]
Prepared by adding 27.2 mL of concentrated sulfuric acid to 22.8 mL distilled water in 50mL volumetric flask.
Clonazepam Tablets Solution [1000μg.mL-1]
Separately, 10 tablets from (CLZ.) was grinded and mixed well. equivalent to 0.3705g and 0.1612 from tablets powder (each containing 0.0100 g of the drug (CLZ.)) for Rivotril® 0.5 mg and 2 mg respectively were weighed, dissolution in about 5mL of methanol, in a separate flask. The solutions were stirred for more than 15 minute and complete to 10mL with methanol to get 1000μg.mL-1. Thereafter, By Whatman filter paper No. 41 each solution was filtered, avoided any un-dissolved material before use and stored at 4°C, further dilution in subsequent use.
General Recommended Procedure for Calibration
In a series of standard flasks 10mL, 1mL of (CLZ.) (20- 350)μg.mL-1 and 1mL of 10M H2SO4 were added to each flask. Followed by 1mL of 0.3M FeCl3 and 1mL of 0.2M K3[Fe(CN)6] with shaking, and allowed to stand in water bath for 15 minutes at 45°C .The volume was made up, with distilled, water to 10mL and mixed well. After 10min the absorbance of the resulted complex was measured at 526nm versus the blank prepared in the same manner without the analyte.
Results and Discussion
Absorption Spectra for Primary Test
A 1mL of H2SO4 (10 M) is added to 1mL of (CLZ.) (200 μg.mL-1) solution in the presence of 1mL of FeCl3 (0.3M) and 1mL of K3[Fe(CN)6] (0.2M) and diluted with distilled water in a 10mL standard flask, a blue color product was formed. The absorbance and λmax of the product was measured against reagent blank Figure (2) shows that the maximum absorption was obtained at a wavelength of 525nm at which the reagent blank shows a negligible absorption.
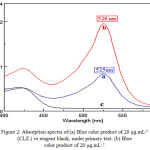 |
Figure 2: Absorption spectra of:(a) Blue color product of 20 μg.mL-1 (CLZ.) vs reagent blank, under primary test. (b) Blue color product of 20 μg.mL– 1 |
(CLZ.) vs reagent blank, under the optimum conditions. (c) Blank Solution against distilled water.
Optimization of Reaction Variables
All important parameters that effect on the absorption intensity of the formed product have been studied and the optimum conditions have been selected.
Effect of Sulfuric Acid Concentration
The influence of the different concentrations of sulfuric acid was investigated by adding 1mL of various concentration [1.0 to 12.0]M. Figure (3) shows that 10.0M of sulfuric acid was chosen as optimal concentration to obtain the maximum absorbance. Then, 10M of H2SO4 was selected for the subsequent studies.
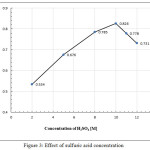 |
Figure 3: Effect of sulfuric acid concentration |
Effect of Ferric Chloride Concentration
Various concentrations of FeCl3 [0.10 to 0.60] M have been tested. The results shown in Figure (4) indicated that 1mL of 0.30M of FeCl3 was the optimum concentration and recommended in the subsequent experiments according to the highest intensity of the colored product.
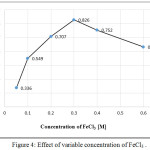 |
Figure 4: Effect of variable concentration of FeCl3. Click here to View figure |
Effect of Potassium Ferricyanide Concentration
Potassium Ferricyanide concentration effect on the intensity of the product color was examined by adding 1mL of different amounts of the reagent [0.050- 0.50]M to fixed concentration of 20μg mL-1 of (CLZ.) drug Figure (5). It is obvious that using 0.20 M of K3[Fe(CN)6] is the suitable concentration for quantitative estimation of (CLZ.) drug. That means, maximum and reproducible color intensities are obtained, and higher reagent concentration do not affect the color intensity.
![Figure 5: Effect of different concentrations of K3[Fe(CN)6].](http://www.orientjchem.org/wp-content/uploads/2018/05/Vol34No3_Dev_Sah_fig5-150x150.jpg) |
Figure 5: Effect of different concentrations of K3[Fe(CN)6]. |
Effect of Time of Reaction
Optimum coupling reaction time was determined by choosing different time periods (0 – 25) minutes for development the colored complex. As shown in Figure (6) the absorbance reached its maximum after 15 min. Therefore, 15 min was selected as optimal period in the analytical procedure.
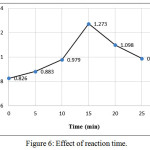 |
Figure 6: Effect of reaction time. Click here to View figure |
Effect of Temperature
The influence temperature on the charge-transfer complex between (CLZ.) and Fe (III) was checked by changing temperature for the range (20-45)°C, Figure (7). It was clear from the results that the absorbance attains maximum color intensity at 45°C and at higher temperatures gave no satisfactory results because the product showed a slight turbidity.
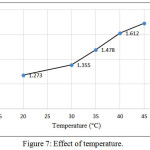 |
Figure 7: Effect of temperature. Click here to View figure |
Effect of Addition order
The addition order influence of the reactive materials was also examined to form the charge transfer complex. The best result in Table (1) was found to be (1) recommended for subsequent testing.
Table 1: Addition order influence.
|
No |
Sequence |
Absorbance |
|
1. |
Drug +H2SO4 + FeCl3+ [K3Fe(CN)6)] |
1.692 |
|
2. |
Drug + H2SO4 + [K3Fe(CN)6)]+ FeCl3 |
1.510 |
|
3. |
FeCl3+ [K3Fe(CN)6)] + H2SO4 + Drug |
0.231 |
|
4. |
FeCl3+ [K3Fe(CN)6)]+ Drug + H2SO4 |
0.528 |
Stability Time
Optimal time for complex stability was estimated the effect of time on the formation of the colored product was examined by allowing the reaction to proceed for varying period after dilution to 10mL. The results showed that the complex between (CLZ.) and Fe (III) reached maximum absorbance after 10 min and remains stable at least for 60 min, Figure (8).
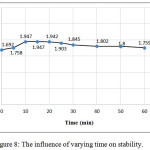 |
Figure 8: The influence of varying time on stability. |
Calibration Graph and Analytical Data
According to the above described analytical conditions, the final spectrum of the colored product formed exhibits a maximum at 526nm, shows in Figure (2). Linear calibration graph was obtained, Figure (9). The linearity of the concentration ranged from (2- 35)μg.mL-1 of the resulted complex. Table (2) shows the analytical parameters obtained such as slope, intercept, correlation coefficient, Sandell sensitivity, molar absorptivity (ε), limit of quantification and limit of detection.
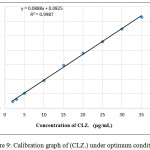 |
Figure 9: Calibration graph of (CLZ.) under optimum conditions. |
Table 2: Optical characteristics and statistical data for the determination of CLZ.
| Parameter | Value |
| λmax (nm) | 526 |
| Color | Blue |
| Regression equation | Y=0.0888[(CLZ)µg/mL]+0.0825 |
| Linearity range (µg/ mL) | 2-35 |
| Calibration sensitivity (mL/ µg) | 0.0962 |
| Correlation coefficient (r) | 0.9993 |
| Correlation of linearity (R2) | 0.9987 |
| Molar absorptivity (L/ mol.cm) | 3.4200´104 |
| Sandell’s sensitivity*(µg.cm-2) | 0.0103 |
| L.O.D.(µg/ mL)* | 0.5703 |
| L.O.Q.(µg/ mL)* | 1.8005 |
Mechanism of the Reaction
The stoichiometry of the reaction between (CLZ.) drug and Fe(III) was investigated using the mole ratio(18) and continuous variation(19) methods under the analytical conditions. The results obtained Figure(10), show a 1:2 (CLZ.): Fe(III)) product was formed .The suggest mechanism for formation the complex, as follows:
CLZ (reductant) + 2Fe+3 → 2Fe+2 + CLZ (oxidant)
Fe+2 + 3K3[Fe(CN)6] → Fe4[Fe(CN)6]3.xH2O (x=14-16)
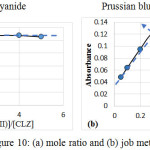 |
Figure 10: (a) mole ratio and (b) job methods. |
Accuracy and Precision
The accuracy and precision of the estimation of (CLZ.) via the studied method which were established by found the values of the relative error (RE %) and relative standard deviation(RSD %), for five replicate analyses at three different levels of analytes concentrations in the range of (5-20) μg.mL-1. The calculated analytical results show good accuracy with acceptable precision, as reported in Table (3).
Table 3: Validation of the suggest method for the estimation of (CLZ.) in pure form.
|
Conc. of (CLZ) (µg/ mL) |
Mean (µg/ mL) |
Er% |
RSD% |
|
|
Taken |
Found* |
|||
|
5.000 |
4.992 |
4.985 |
-0.3000 |
0.0701 |
|
4.978 |
||||
|
4.985 |
||||
|
10.000 |
9.994 |
9.973 |
-0.2700 |
0.2864 |
|
9.941 |
||||
|
9.986 |
||||
|
20.000 |
19.995 |
20.017 |
0.0865 |
0.2377 |
|
19.985 |
||||
|
20.072 |
||||
*Average of five measurements.
Interference Study
The effect of various foreign species, which may be present in pharmaceutical products and affecting the reaction between (CLZ.) and Fe(III), was studied. Optimum experimental conditions, were employed to determine 20 μg.mL-1 concentration of (CLZ.). Table (4) shows the presence of 500µg.mL-1 of the studied interfering. It was observed that the studied foreign species did not interfere in the proposed method.
Table 4: Percent recovery for 20 µg.mL-1 of (CLZ.) in the presence of excipients.
|
Excipients |
(CLZ.) Conc. Found (µg/ mL) |
Recovery (%) |
|
|
Name |
Conc. (µg/ mL) |
||
|
Glucose |
50.000 |
20.081 |
100.405 |
|
Sucrose |
50.000 |
20.059 |
100.295 |
|
Starch |
20.000 |
20.104 |
100.520 |
|
Magnesium Stearate |
10.000 |
19.951 |
99.755 |
Application
Commercially available tablets of (CLZ.) Rivotril 0.5 mg and 2mg were subjected to analysis by the proposed procedure. The quantitative determination of two concentration levels of (CLZ.) was carried out via the proposed method. Table (5) shows the values of recovery percentage obtained for the analyzed samples by the application of the mentioned method on the pharmaceutical tablet. The results of the analysis were satisfactory, as indicated by the good recovery percent.
Table 5: Application of the proposed spectrophotometry to the (CLZ.) concentration measurements in their pharmaceutical tablet.
|
Sample |
Weight Found* (mg) |
Concentration (µg.mL-1) |
Recovery % |
RSD % |
|
|
Taken |
Found* |
||||
|
Rivotril® – 0.5 mg |
0.502 |
5.000 |
5.026 |
100.520 |
0.249 |
|
0.502 |
10.000 |
10.040 |
100.400 |
0.242 |
|
|
Rivotril® – 2 mg |
2.018 |
5.000 |
5.046 |
100.920 |
0.419 |
|
2.023 |
10.000 |
10.117 |
101.170 |
0.160 |
|
*Average of five measurements.
Statistical Evaluation
The results obtained were statistically compared with those obtained using other methods as shown in table (6). The F test was used to estimate the difference in variance between the two methods, while student’s t-test was used to compare the mean.
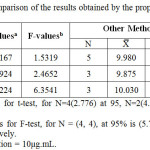 |
Table 6: Statistical comparison of the results obtained by the proposed method and other methods
|
Conclusion
The present study describes a simple and cheap method for determination of CLZ in its pharmaceutical Tablets depend on charge*transfer reaction. The method described here have many advantages such as simplicity, specificity, sensitivity and in addition it does not need expensive apparatus. After studying all the chemical conditions of the method and optimized, the method applied successfully for estimation of CLZ in tablets, with good recoveries. The proposed method was compared with other methods of CLZ determination and by using two statistical methods (t- and F tests) and both methods proved accuracy and precision of the method.
Acknowledgement
I am grateful to Dr. Najwa Issac for the critical and continuous control, discussion and help during the scope of the work.
References
- British Pharmacopeia, CD-ROM Her Majesty, Stationary office, London. 2013, III, 2444-2445.
- Dahlin, M.G.; Amark, P.E.; Nergårdh, A.R.; Amark, N., Pediatr. Neurol. 2003, 28, 48–52.
CrossRef - Parker, W.A., Gourley DR, Hart LL (Eds), Clinical pharmacy and therapeutics. Williams and Wilkins, Maryland. 1988, 585-586.
- Martindale., Pharmaceutical press. 36th Edition. 2009, 478-479.
- The Indian Pharmacopoeia. The Indian Pharmacopoeia commission, Ghaziabad, 6th edition. 2010, II, 1111-1114.
- Karajgi, S.; Patil, A.; Kotnal, R., Human Journals. 2016, 6, 314-323.
- Hadi, H., Iraqi J. Pharm. Sci. 2015, 24, 25-32.
- Sharma, S.; Rajpurohit, H.; Sonwal, C.; Sharma, P.; Bhandari, A., J. Pharmacy Research, 2010; 3, 2303.
- Randez-Gil, F.; Daros, J. A.; Salvador, A.; Guardia, M. D., J. Pharmaceutical and Biomedical Analysis.1991, 9, 539–545.
CrossRef - Papoutsis, I. I.; Athanaselis, S. A.; Nikolaou, P. D.; Pistos, C.M.; Spiliopoulou, A.; Maravelias, C. P., J. Pharmaceutical and Biomedical Analysis. 2010, 52, 609- 614.
CrossRef - Patil, P. M.; Wankhede, S. B.; Chaudhari, P. D., Pharm Anal Acta, 2015, 6, 1-5.
- Bhimanadhuni, C. N.; Garikapati, D. O.; Usha, R., International Current Pharmaceutical Journal, 2012, 1, 193-198.
- Wo´zniakiewicz, A.; Wietecha-Posłuszny, R.; Wo´zniakiewicz, M.; Bryczek, E.; Ko´scielniak P., Journal of Pharmaceutical and Biomedical Analysis. 2015, 111, 177-185.
CrossRef - Chaichi, M. J.; Alijanpour, S. O., Spectrochimica Acta Part A: Molecular and Biomolecular Spectroscopy. 2014, 118, 36-41.
CrossRef - Habibi, B.; Jahanbakhshi, M., Electrochimica Acta. 2014, 118, 10-17.
CrossRef - Babanejad, M.; Tehrani, M. S.; Mafakheri, M.; Sardari, S., Pharm Anal Acta. 2016, 7, 1-8.
- Salema, A. A.; Barsoumb, B. N.; Izake, E. L., Analytica Chimica Acta. 2003, 498, 79-91.
CrossRef - Delvie, R., International Edn. McGraw-Hill Inc., Singapore. 1979, 498.
- Job, P., Oliner and Boyd, Edinburgh, 2nd ed. 1964, 4.
- Patel, V. B.; Jayant, A. B.; Patel, D. F.; Patel, C. N., Vinay Patel, IJPRBS. 2012, 2, 62-70.

This work is licensed under a Creative Commons Attribution 4.0 International License.
![]()
A New Edition of Web of Science
Journal Impact Factor
2022: 0.5
Five Year: 0.8
Journal is Indexed in

Cabells Whitelist
![]()


