Adsorption Behavior of Some N-alkyl Pyridinium Salts from Aqueous Solution on Amberlit-IR 120 H+ Resin
 , Ehteram A. Noor1 and Jamilah Mohammad Alahmari1
1Department of Chemistry, Faculty of Sciences, King Abdulaziz University, Jeddah, Saudi Arabia.
2Department of Chemistry, Faculty of Sciences and Art, Northern Border University (NBU), Rafha, Saudi Arabia.
Corresponding Author E-mail: najah.a.j@hotmail.com
DOI : http://dx.doi.org/10.13005/ojc/340312
Download this article as:
![]()
The effect of Amberlite-IR 120 H+ resin to remove some organic compounds (N-alkyl pyridinium salts) from aqueous solutions at certain conditions was investigated. The effect of resin dosage, contact time, adsorbate concentration, ionic strength and solution temperature on the adsorption efficiency was examined. The experimental data collected generally proved that the adsorption efficiency decreased as the alkyl chain increased. The thermodynamic equilibrium parameters of the adsorption processes were evaluated and showed that the adsorption process is spontaneous, disordered and exothermic. Langmuir, Freundlich, Temkin and Dubinin–Radushkevich (D.R) isotherm models were applied based on the batch method. Freundlich, Temkin and D. R gave bilinear segments model based on the adsorbate initial concentrations except that for compound III where it gave straight of one segment for Temkin adsorption isotherm. Overall, Amberlite-IR 120 H+ resin is effective in removing some N-alkyl pyridinium salts from an aqueous solution.
KEYWORDS:Adsorption; Ion Exchange; Isotherms; Pyridinium Salts; Resin; Removal; Thermodynamics
Introduction
Adsorption can be employed in a variety of applications particularly in the area of environment. For example, it is used to purify water from solvents or vice versa. Organic resins are the most useful type of adsorbents that used to remove heavy metals, dyes, fluoride, nitrate, ammonia and contaminants due to their high adsorption capacities and low cost. They are classified based on functional groups and whether they include cationic, anionic or amphoteric. Further classification is based on the strength of an acid or base.1,2 Specially, Amberlite IR-120.H+ is an excellent resin that can be used for a variety of water demineralization applications.3
Ion exchange and adsorption have similar diffusion processes. In both of them a substance is captured by solid particles. However, there are some different characteristics between them. For instance, Ion exchange processes require releasing an equivalent amount of removed ions into the solution while adsorption processes do not demand any replacement of the removed ions.4
The adsorption isotherm relieves essential information about the adsorbent surface characteristics, and it represents the distribution of adsorbate between a liquid phase and a solid phase at equilibrium state. Langmuir adsorption isotherm assumes that the surface is homogeneous and consists of many active sites in which each one can adsorb only one molecule of the adsorbate forming monolayer adsorption. The Langmuir equation has the linear form of5:
Ce/qe= (1/qm KL) + (Ce/qm) (1)
Where “qm” and “KL” are the Langmuir constants related to adsorption capacity and energy of adsorption. Freundlich model is used to represent the adsorption characteristics for heterogeneous surfaces. Freundlich states that the adsorbate molecules interact with each other in multilayer adsorption. The Freundlich equation has the linear form6:
Log qe= log KF+ 1/n log Ce (2)
The sorption capacity KF, which is the indication of the quantity of adsorbate onto adsorbent for a unit equilibrium concentration. Temkin model assumes that the heat of all molecules of a layer diminishes at a straight line with the coverage as a consequence of the interaction of adsorbent-adsorbate.7
qe = B InKT + B InCe (3)
KT is the equilibrium constant while B is related to the adsorption heat. D.R model estimates the mean free energy of the adsorption and determines whether the adsorption has the chemical or physical characteristic. The D.R equation has the form8:
In qe = In qs – bε2 (4)
qe is the maximum adsorption capacity, b is a constant related to mean adsorption energy, and ε is the Polanyi adsorption potential, which is equal to:
![]()
The energy of adsorption is the free energy of the transfer of 1 mole of a solute from infinity (in solution) to the surface of the adsorbent. The mean value of adsorption energy E can be computed using the following relationship:
![]()
E, mean free energy, is used to determine the type of adsorption process. For example, E < 8 kJ/mol is for physisorption, 8 < E < 16 kJ/mol is for ion-exchange and 20 < E < 40 kJ/mol is for chemisorption.8,9
N-methyl pridynium salts with different substituents had been successfully removed from aqueous solutions using dowex 50WX4-5/H+10 where Freundlich and Dubinin-Radushkevich adsorption isotherm models fit well their adsorption data. The present work aimed to investigate the efficiency of Amberlit- IR 120 H+ resin for the removal of pridynium salts having the same substituent but differ in the N-alkyl chain, from aqueous solution under different conditions.
Experimental Work
Chemicals
N-alkyl Pyridinium salts have been prepared and proven elsewhere.11 Their chemical structure formula and molecular weight are given in Table 1. These compounds are classified as 1:1 electrolytes where the organic part has the electron-donor-acceptor properties.12 Amberlite IR-120 resin (Functional group: -SO3H; Matrix: Styrene divinylbenzene), supplied by the Dow chemical company, was used. The physical form (beads) is represented in Fig. 1. Moreover, analytical grade reagent of hydrochloric acid 98% (BDH), Silver nitrate, AgNO3 (BDH) and sodium chloride, (Sigma-Aldrich) were used.
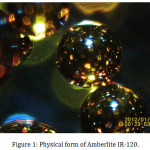 |
Figure 1: Physical form of Amberlite IR-120. Click here to View figure |
Methods
Activation of Amberlit-IR 120 H+ resin
The resin was initially activated with HCl (1 M) for 24 h; then it was washed with deionized water several times until all chloride ions were removed. To ensure that the solution is chloride ions free, Ag(NO3) solution (0.1 M) test was used. After that, the resin was dried at 50˚C in an electric oven and stored at room temperature until use.
The determination of the studied organic cations concentrations at equilibrium
The absorbance of various dilutions (stock solutions, 2.5×10⁻⁴ M) of the studied organic compounds were determined by spectrophotometric technique and was found to fit well Beer’s law equation (non-zero intercept)13:
Abs(λmax) = b + aC (7)
Where Abs(λmax) measures the absorbance (no units), a is a slop, b is the intercept, and c is the concentration (M) [14]. λmax was ranged from 306 to 390 nm. In order to identify Ce, Eq (7) can be rearranged as follows:
Ce= (Abs(λmax) – b) / a (8)
Adsorption of the studied organic compounds on Amberlite IR 120 H+ resin
Batch method was conducted to study the effect of resin dosage as follows: a certain amount of each studied organic compound was dissolved in 100 mL measuring flask to obtain a final concentration of 1×10⁻³ M. Then, every time a different amount of the resin (0.05, 0.1, 0.15, 0.25, 0.5 or 0.75g) was mixed with a solution of the studied compounds. After that, the solutions were stirred at a constant speed rate for 60 min at 30˚C. Finally, the solutions were separated from the resin after equilibrium and analyze by UV spectrophotometric technique. The steps were repeated using certain resin dosage (0.25 g) for studying the effect of contact time, initial concentrations, ionic strength and solution temperature by varying respectively the contact time (5 to 90 min), initial concentrations of the studied compounds, (2.5×10⁻⁴ to 1.5×10⁻³ M), NaCl concentration (0.05 to 1.0 M) and solution temperature (30-70˚C). All experiments were conducted at solution pH.
The amount of the cations adsorbed per unit mass, qe(mol.g-1) can be calculated as following:
![]()
Where Ci is the initial concentration, (mol.L-1 or M), m is the mass of the adsorbent (g) and Vis the volume of the solution (ml). The distribution coefficient (Kd, L.g-1) estimates the ability of the ion exchanger to remove certain ionic species from liquid medium.. It can be measured by the following formula:
![]()
The adsorption percentage can be determined (Ads%) according to the equation below:
![]()
Results and Discussion
Effect of resin dosage
The removal efficiency of the studied compounds (1×10⁻³ M) was investigated by varying the resin amount from 0.05 to 0.75 g at 30˚C and 60 min contact time (Fig.2-a). It is clear that the qe decreased with increasing the resin dose. The interpretation, in this case, is that increasing the resin amount caused agglomeration of the resin particles leading to a reduction in inter-particle distances. So that, the intersecting of the adsorption sites as a result of the overcapacity of the resin particles led to decrease qe. They also might be performed a screen on the outer layer of the particles covering the active sites from the adsorbate.15 As it is shown from Fig. 2-b, Kd increased dramatically as the adsorbent increased, to reach the highest value at 0.25 g of the resin, due to increasing the number of active adsorption sites and generating a greater surface area for a fixed adsorbate concentration with increasing the resin amount.16 Then, Kd declined with increase the adsorbent. The possible reason is that while the adsorbent concentration increased, some active sites still unsaturated during the adsorption process. As a result, more of free sites were formed.17 By all means, increasing active sites with increasing adsorbent more than the concentration of the adsorbate itself. Therefore, a further increase of the adsorbent will discharge to decrease the adsorption. It might also be contributed to overlapping the active sites leading to a decrease of the surface area and accumulation of the exchanger particles.18 Consequently, the selected amount of the resin for the remaining experiments was 0.25 g.
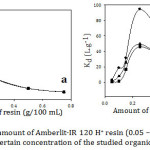 |
Figure 2: Effect of amount of Amberlit-IR 120 H+ resin (0.05 – 0.75g) on (a) qe and (b) Kd for a certain concentration of the studied organic compounds. |
Effect of the contact time between adsorbent and adsorbate
Figure 3 represents the effect of contact time (5- 80 mins) between the adsorbent and the adsorbate for the adsorption of organic compounds (1×10⁻³) from aqueous solution on Amberlite IR-120 H+ resin (0.25g) at 30˚C. It is evident that the adsorption efficiency increased dramatically with increase the contact time until 60 min because all the active sites of the resin surface were vacant at initial and the adsorbent concentration gradient was significantly high. Hence, the functional groups of the resin surface need more time to bind entirely with the vacant active sites, since each active site of the resin surface adsorbs only one molecule of the adsorbate, and to achieve a sufficient equilibrium between the amount of the organic cations adsorbed by the resin and the amount of the cations remaining in the solution.19 At 60 minutes contact time, it was achieved an ideal time of the maximum organic cations removal and reached the equilibrium completely. As a result, the contact time used in our adsorption studies was 60 min. However, after 60 min the adsorption became almost constant. The reason is that with further increase of the contact time, most of the active sites of the resin were occupied with the cations that cover the adsorbent surface. So that, the adsorption did not indicate a significant change in the limited active sites on the resin surface. The adsorption is illustrated to a fast process where approximately 80% of the adsorption efficiency took place at the beginning of 10 minutes.
 |
Figure 3: Effect of the contact time (5-80 min) for a certain concentration of the studied organic compounds on (a) Kd and (b) Ads% using Amberlit IR120 H+ resin. |
Effect of the Adsorbate Initial Concentration
The effect of the initial concentrations of the organic compounds solutions, in the range of 1×10⁻⁴ to 1.5×10⁻³ M at 30˚C for 60 min, for the adsorption on Amberlite IR-120 H+ resin was described at Fig 4. The Figures show a gradual increase of the adsorption efficiency with increasing the adsorbate amount as a result of increasing the adsorbate cations around the active sites of the resin.20 Consequently, the removal efficiency increased with increasing the adsorbate amount (Fig. 4-a). For certain, at low initial adsorbate concentrations, the ratio of an initial amount of organic cations to active sites of the resin was low. Hence, the removal efficiency of the cations was higher. On the other hand, at higher concentrations, the ratio of the cations and active sites was high. So that, the excess of the cations remained in the solution leading to a decline of the removal efficiency.21 By all means, at low concentration of adsorbate, the number of organic cations was insufficient for covering the adsorbent surface and forming a layer in contrast to the high concentration of adsorbate with an adequate amount of cations that formed a single layer on the resin surface.22
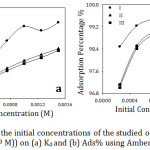 |
Figure 4: Effect of the initial concentrations of the studied organic compounds (2.5×10⁻⁴ to 1.5×10⁻³ M)) on (a) Kd and (b) Ads% using Amberlite IR-120 H+ resin. |
Effect of ionic strength
The effect of ionic strength on the adsorption of organic cations on 0.25 g of Amberlite-IR 120 H+ resin from aqueous solution was examined by using a variety of NaCl concentrations in the range from 0.05 to 1.0 M at 30˚C for 60 min. The experimental results (Fig 5) exhibit that, the adsorption decreased as NaCl concentrations increased. A possible implication is that there was a competition between Na+ and organic cations to be adsorbed on the resin surface. For example, at lower NaCl concentrations, the effect of Na+ cation was slight due to more function groups were available for organic cations and Na+ uptake. However, at higher NaCl concentrations, the competition between Na+ and organic cations for the available sites became more significant leading to a low organic cations removal. That might be attributed to the greater selectivity of anionic sulfate groups of the resin for Na+ cations than that for organic cations23 since Na+ ions are smaller in size in comparison to organic cations and hence the mobility of Na+ is higher than organic cations.24 Similar results represented by Wang.25 For more explanation, the electrostatic interaction plays an essential role in the ion exchange technique. Na+ cations coordinated with R– anions that hindered the electrostatic attraction between the organic cations and the anion parts of the resin. Furthermore, with increasing the ionic strength, the electrical double layer thickness surrounding the molecules decreased26 leading to reduce the electrostatic force between adsorbent surface and adsorbate.
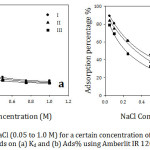 |
Figure 5: Effect of NaCl (0.05 to 1.0 M) for a certain concentration of the studied organic compounds on (a) Kd and (b) Ads% using Amberlit IR 120 H+ resin. |
Effect of Temperature
The effect of the solution temperature on the adsorption of organic cations on Amberlite-IR 120 H+ resin from aqueous solution was studied by varying the temperatures (30, 50 and 70˚C) at the constant initial concentration (1×10⁻³ M) and contact time (60 min). The experimental results proved that there was a slight decrease in the adsorption with increasing the temperature (Fig 6). The decrease in the adsorption indicates to an exothermic adsorption process which is favorable at lower temperatures. Therefore, the physical adsorption is predominated in this case. The reason behind the decrease in the adsorption of the organic compounds is the weakness of the adsorptive forces between the adsorbent surface and the organic cations and also between the adjacent ions of the adsorbed cations and the adsorbent surface. At higher temperatures, some active sites on the adsorbent surface destructed due to bond rupture and hence the surface might be reformatted.27 Generally speaking, the temperature has a small effect on the adsorption which decreased as temperature increased.
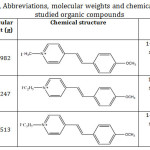 |
Table 1: Names, Abbreviations, molecular weights and chemical structures of the studied organic compounds. |
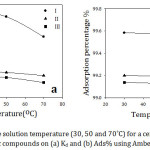 |
Figure 6: Effect of the solution temperature (30, 50 and 70˚C) for a certain concentration of the studied organic compounds on (a) Kd and (b) Ads% using Amberlit IR 120 H+ resin. |
Thermodynamic evaluation for the adsorption of the studied organic compounds on Amberlie IR 120 H+ resin
Thermodynamic parameters such as change in free energy ∆G˚ enthalpy change ∆H˚ and entropy change ∆S˚ for the adsorption of the studied organic compounds from aqueous solution on Amberlite IR 120 H+ resin were investigated at 30, 50 and 70˚C. The following equation determines the Gibbs free energy of adsorption ΔG based on the Kd value
ΔG° = – RT. In Kd (12)
∆S˚ and ∆H˚ values calculate from the slopes and intercepts of the straight lines of Fig. 7 respectively based on Van’t Hoff equation that given below.28
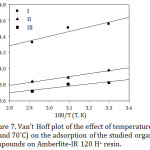 |
Figure 7: Van’t Hoff plot of the effect of temperature (30, 50 and 70˚C) on the adsorption of the studied organic compounds on Amberlite-IR 120 H+ resin. |
ln Kd = ΔS˚/R – ∆H˚/RT (13)
The thermodynamic parameters represented in Table 2. The negative values of ΔG° represent the feasibility and spontaneous nature of the adsorption process. As it is shown in the table, ∆G˚ values did not indicate a significant change with increasing the temperature. Generally speaking, the adsorption was physisorption since ΔG° were less than 20 kJ/ mol-1. However, the positive values of ΔS° suggest high affinity of the adsorbent to the adsorbate and prove that the randomness increased at the solid–liquid interface during adsorption process.1,29 This positive entropy as a result of the release of water molecules structures that were surrounded the organic cations upon their association. The reason behind the small positive values of entropy is that when the organic cations were adsorbed on the adsorbent surface, they became less free to move around than that in the solution.30 The entropy increased slightly with increasing the chain length. To an illustration, the aggregations of the organic molecules became tighter with increasing the alkyl chain length leading to more release of water molecules and higher entropy.31 In addition to that, ∆H˚ are negatively illustrating that the adsorption was exothermic processes. The negative value of ∆H˚ might be contributed to the direct ionic bond formation between the organic cations and the ionic sites of the adsorbent surface. Also, the reaction did not involve activation energy.30 One possible reason for the increase of the enthalpy negativity with decreasing the chain length is that as the electrostatic interactions increased, stronger bonds formed resulting in more energy released and hence more exothermic, large negative value and adsorption.
Table 2: Thermodynamic parameters of the adsorption of the studied organic compounds on Amberlite-IR 120 H+ resin at (30, 50 and 70˚C)
|
Organic compound |
∆H˚ (KJmol-1) |
ΔS˚ (Jmol-1K-1) |
ΔG˚(KJmol-1) |
||
|
30˚C |
50˚C |
70˚C |
|||
|
I |
-4.896 |
21.9 |
-11.488 |
-12.120 |
-12.355 |
|
II |
-3.059 |
23.0 |
-10.031 |
-10.613 |
-10.953 |
|
III |
– 2.269 |
24.4 |
-9.641 |
-10.229 |
-10.609 |
Over all, the adsorption is physical since the ∆H˚ values are less than 40 KJ mol-1. In general, the thermodynamic data proved that the adsorption decreased as the alkyl chain length increased as follows
Adsorption isotherm models for the studied organic compounds on Amberlite IR-120 H+ resin
Langmuir Freundlich, Temkin and D.R isotherm models were applied to the adsorption of the studied organic compounds, at a different initial concentration (2.5×10⁻⁴ to 1.5×10⁻³ M), from aqueous solution on Amberlite-IR 120 H+ resin at 30˚C. However, modeling of Langmuir for the adsorption system was unacceptable since it gave negative values for qm.
Freundlich isotherm model
Figure 8 illustrates that log qe against log Ce plots gave bilinear segments model based on the adsorbate initial concentrations. As it is shown at Table 3, the first part is following the experimental data since it gave the same order for the adsorption capacities of the studied organic compounds as following: I> II> III. However, an opposite order was obtained at the second part. The interpretation of that will be discussed in more detail later. Overall, the mean value of the adsorption capacity fits the experimental data and follows the same order, I> II>III. According to Table 3, n values for the studied organic compounds are less than one which refers to that the surface of the adsorbent is heterogeneous and is considered as S-type isotherm.32, 33
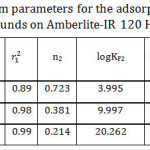 |
Table 3: Freundlich isotherm parameters for the adsorption of the studied organic compounds on Amberlite-IR 120 H+ resin. Click here to View table |
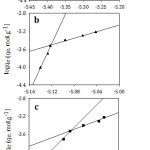 |
Figure 8: Freundlich isotherm model for the adsorption of (a; I), (b; II) and (c; III) on Amberlite-IR 120 H+ resin. |
Temkin Isotherm Model
Temkin model was applied by plotting qe versus ln Ce as shown in Fig 9. As it is seen, Temkin model for I and II represents two straight lines for the adsorption process indicating two different adsorption energies34 while Temkin model for III appeared in one straight line. The reason behind that also will be interpreted later. According to Table 4, B mean values decreased significantly with increasing the chain length of the organic compounds indicating a weakness of the interaction as the chain length increased. Both lines have the same trend in which the adsorption capacity decreased with increasing the chain length of the studied organic compounds. According to KT mean values, the organic compound I relieves the highest binding energy and thus highest adsorption capacity than others. That is to say, the adsorption capacity follows the order of I >II >III confirming the experimental data. Also, the correlation coefficients of Temkin model were maximum for all the studied compounds. Hence, the adsorption processes followed Temkin model satisfactorily.
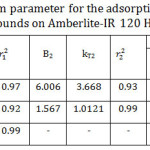 |
Table 4: Temkin isotherm parameter for the adsorption of the studied organic compounds on Amberlite-IR 120 H+ resin. |
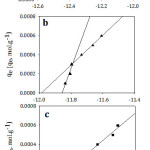 |
Figure 9: Temkin isotherm model for adsorption of (a; I), (b; II) and (c; III) on Amberlit- IR 120 H+ resin. Click here to View figure |
D.R isotherm model was applied as exhibited at Fig 10. Plotting ln Ce versus ε2, it was obtained two linear segments. As it is shown in Table 5, the maximum adsorption capacity has the order of I> II >III for the first line while the order is reversed for the second line. In general, the mean maximum adsorption capacity order corresponded well to the experimental data. It is clear that E2 > E1 for II and III and that means the required energy to remove one molecule from the bulk of the solution to the top of the adsorbent surface increased with increasing the adsorbate initial concentration. In addition to that the shortest alkyl chain length (I) has the lowest value of E and that might be contributed to the weakness of the hydrophobic effect for the studied compound I. To evaluate the nature of the interaction between the adsorbent and the adsorbate, mean free energies of sorption were calculated. The data illustrate that the E values were less than 8 indicating that physical adsorption played a crucial part in the adsorption process.35 Since the adsorption process is physical, it should be exothermic, and that is in agreement with the enthalpy values as represented at Table (2).
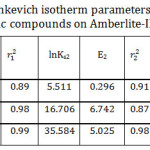 |
Table 5: Dubinin–Radushkevich isotherm parameters for the adsorption of the studied organic compounds on Amberlite-IR 120 H+ resin. Click here to View table |
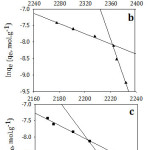 |
Figure 10: Dubinin–Radushkevich isotherm model for adsorption of (a; I), (b; II) and (c; III) on Amberlit- IR 120 H+ resin. |
Interpretation of the adsorption characteristics for the studied organic compounds on Amberlite-IR 120 H+ resin on the light of chain length effect
The evidence gathered from the isotherm models for the adsorption of some N-alkyl pyridinium salts from aqueous solution on Amberlite IR 120 H+ resin show that the models had two stages according to the initial adsorbate concentrations. At low concentrations, the organic cations were free to move around the adsorption interface where the active adsorption sites were more available. Hence, the adsorption was dominated by ion exchange reaction. In this case, van der Walls attractive forces are considered as the driving force for the ion exchange in addition to the electrostatic forces between the organic cations and the oppositely charged of the adsorbent surface.36 Furthermore, the alkyl chain tails of the organic compounds adsorbed parallel to the surface at the interface. Besides, this orientation of the alkyl chains might be contributed to inhibit the interactions between the chains of the organic compounds and reduce the hydrophobic interactions at this region.37,38 From the experimental data it can be observed that, the adsorptive amounts of the studied organic cations onto Amberlite IR 120 H+ resin decreased with increasing the alkyl chain length at low adsorbate concentrations due to the diminution of the electrostatic attractive forces between the studied organic cations and the adsorbent surface. That occurred as a result of the steric hindrance which associated with the binding of a large molecule on the active sites of the resin surface blocking the access to unoccupied active sites.39 However, at high equilibrium concentrations, the active adsorption sites became less available since the majority of the sites were occupied by the organic cations in order to neutralize the surface charge; so that, the electrostatic interaction became less. For this reason any further adsorption in this stage was a result of the hydrophobic interaction that was controlled by Van der Waals forces. Certainly, as the adsorbate amount increased in solutions, the adsorbent surface became hydrophobic due to the orientation of the alkyl chains perpendicular towards the bulk solution.37,38 The increase of hydrophobicity on the surface made the system unstable due to increase the system energy. In order to obtain a stable system, hydrophobic interactions took place between the tails of the organic compounds at the adsorbent surface, between the tails that existed in solution, and also between the tails and the adsorbent surface when adsorption carried out on hydrophobic sites. Further increased in the concentration generated aggregations of the organic cations on the adsorbent surface through van der Walls forces or hydrophobic binding. Consequently, the organic cations appeared to adsorb as multilayers.40 Based on the Freundlich and D.R isotherm models, increasing alkyl chain length increased the maximum amount adsorbed at saturation fundamentally due to increase the hydrophobic interaction. For more explanation, as the chains length increased, the hydrophobic interaction between alkyl groups became stronger and thus the organic compounds tend to gather away from aqueous medium to adsorb on the surface of the adsorbent.36 That because the organic cations with increasing alkyl chain length have a much greater driving force for the aggregation. In the regard to Temkin isotherm model as it mentioned before, that represents two straight lines for the adsorption process of I and II indicating two different adsorption energies. The first part (low initial concentration) involves high interaction energy in which the high electrostatic attractions were dominated. However, the second part (high initial concentration) includes lower interaction energy in which the weak Van-der Waals forces were dominated. As a result, the adsorption energy broke down into two parts.41 According to III compound, the steric hindrance weaken the electrostatic interaction in the first part in addition to the weak Van-der Waals forces at the second one; so that the adsorption energy for III appeared in one line since there was no difference in the adsorption energy between the two parts. In short, the alkyl chain length affect the adsorption isotherm leading to the appearance of bilinear adsorption models.
Scanning Electron Microscope (SEM) analysis of the resin
SEM images of Amberlite IR-120 H+ resin before and after its adsorption of the studied organic compounds, (1×10⁻³) from aqueous solution at 30˚C for 60 min, are shown in Fig. 11. As could be observed, there is an obvious change of the resin surface morphology proven the adsorption of the studied compounds onto the adsorbent. It is also clearly seen that the resin surface before contact was rough; however, the surface became smoother with increasing the chain length. The possible implication, for this case, is that physical sorption took more place with longer alkyl chain forming multilayers on the surface and making the surface smoother while it took less place with shorter alkyl chain where the ion exchange was dominated.
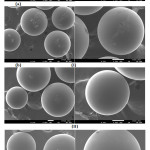 |
Figure 11: SEM of Amberlite IR 120 H+ resin(a) before and (b) after adsorption the studied organic compounds. |
Conclusion
The study proved the high capability of Amberlit-IR 120 H+ resin to remove some of the N-alkyl pyridinium salts from the aqueous medium under certain conditions. The results represent that the adsorption increased significantly with increasing the resin dosage, contact time, adsorbate concentration. However, adding NaCl to the organic solution or increasing the temperature of the solution decreased the adsorption. The thermodynamic data show that the adsorption is spontaneous, disordered and exothermic. Temkin model described the adsorption systems appropriately. The isotherm models break down the adsorption into two regions according to the adsorbate initial concentrations. The experimental data in overall indicate that the adsorption decreased with increasing the alkyl chain length at the low concentration where ion exchange reaction dominated the adsorption.
Acknowledgments
This study was supported by Physical chemistry, the Department of Chemistry, Science Faculty, King AbdulAziz University.
References
- Poulopoulos, S. G.; Inglezakis, V. J. Ads. Ion. Exch. Cat.: Des. Oper. Env. App. Elsevier. 2006, pp. 602.
- Nasef, M. M.; Ujang, Z. Ion. Exch. Tech. 2012, 1-39.
- The Dow Chemical Company, 2018 https://www.dow.com/webapps/include/GetDoc.aspx?filepath=liquidseps/pdfs/noreg/177-03048.pdf.
- Helfferich, F. Ion. Exch. 1995, pp. 624.
- Langmuir I. J. Am. Chem. Soc. 1918, 40, 1361-1403.
CrossRef - Freundlich, H.; Hatfield, H. S. Coll. Capl. Chem. 1926, pp. 916, 397-414.
- Temkin, M. I. Acta. phys. 1940, 12, 327-356.
- Dubinin, M. M.; Radushkevich, L. V. Dokl. Akad. Nauk. 1947, 55, 331-334.
- Özcan, A.; Öncü; E. M.; Özcan, A. S. Physico. Eng. Asp. 2006, 277, 90-97.
CrossRef - Noor, E. A.; Al-Solmi, F. M. J. Chem. 2011, 8.S1, S171-S188.
- Al-Ahmari J. M. Ph.D. Thesis at K. A. U. 2011, pp. 250, 75-76.
- Florkin, M.; Stotz, E. H. Bioenergetics.Elsevier.2014, 22.
- Vogel, A. I. Quan. Inorg. Ana; 3rd ed. 1961, pp. 1216.
- Miller, F. P.; Vandome, A. F.; McBrewster, J. Adv encr standard. 2009, pp. 110.CrossRef
- Pons, M. P.; Fuste, M. C. Appl. Micro. Biotech. 1993, 39, 661-665.
CrossRef - Rengaraj, S.; Joo, C. K.; Kim, Y.; Yi, J. J. Haz. Mat. 2003, 102, 257-275.
CrossRef - Yu, Z.; Qi, T.; Qu, J.; Wang, L.; Chu, J. J. Haz. Mat. 2009, 167, 406-412.
CrossRef - Mandal, S.; Sahu, M. K.; Patel, R. K. Wat. Reso. Ind. 2013, 4, 51-67.
CrossRef - Said, A.; Hakim, M. S.; Rohyami, Y. Int’l Confer. Chem. Bio. Env. Sci. 2014, 11-13.
- Ghorbani, F.; Younesi, H.; Ghasempouri, S. M.; Zinatizadeh, A. A.; Amini, M.; Daneshi, A. Chem. Eng. J. 2008, 145, 267-275
CrossRef - Radnia, H.; Ghoreyshi, A. A.; Younesi, H.; Najafpour, G. D. Des. Wat. Treat. 2012, 50, 348-359.
CrossRef - Tang, Y.; Wang, X.; Zhu, L. Poly. Bull. 2013, 70, 905-918.
CrossRef - Sharma, S.; Agarwal, G. P. J. Coll. Interf. Sci. 2001, 243, 61-72.
CrossRef - Hu, Y.; Guo, T.; Ye, X.; Li, Q.; Guo, M.; Liu, H.; Wu, Z. Chem. Eng. J. 2013, 228, 392-397.
CrossRef - Wang, S.; Dong, Y.; He, M.; Chen, L.; Yu, X. App. Cla. Sci. 2009, 43, 164-171.
CrossRef - Debye, P.; Hückel, E. Phys. Zeit. 1923, 24, 185-206.
- Akazdam, S.; Chafi, M.; Yassine, W.; Gourich, B. J. Mat. Env. Sci. 2017, 8, 2993-3012.
- Abou-Mesalam, M. M. Coll. Surf. 2003, 225, 85-94.
|CrossRef - Kumar, P. S.; Gayathri, R. J. Eng. Sci. Technol. 2009, 4, 381-399.
- Somasundaran, P.; Fuerstenau, D. W. Transactions. 1973, 254.
- Brandal, Ø. ; Hanneseth, A. M; Sjöblom, J. Coll. Poly. Sci. 2005, 284, 124-133.
CrossRef - Varshney, R.; Bhadauria, S.; Gaur, M. S. Water. 2011, 2, 142-151.
- Giles, C. H.; MacEwan, T. H.; Nakhwa, S. N.; Smith, D. J. Chem. Soc. Resu. 1960, 3973-3993.
- Maatar, W.; Alila, S.; Boufi, S. Ind. Crop. Prod. 2013, 49, 33-42.
CrossRef - Runping, H. A. N.; Pan, H. A. N.; Zhaohui, C. A. I.; Zhenhui, Z. H. A. O.; Mingsheng, T. A. N. G. J. Env. Sci. 2008, 20, 1035-1041.
CrossRef - Paria, S.; Yuet, P. K. Ind. Eng. Chem. Res. 2006, 45, 712-718.
CrossRef - Gupta, V. K.; Mittal, A.; Krishnan, L.; Mittal, J. J. Coll. Interf. Sci. 2006, 293, 16-26.
CrossRef - Somasundaran, P.; Zhang, L. J. Pet. Sci. Eng. 2006, 52, 198-212.
CrossRef - Hassan, S.; Duclaux, L.; Lévêque, J. M.; Reinert, L.; Farooq, A.; Yasin, T. J. Env. Mana. 2014, 144, 108-117.
CrossRef - Ersoy, B.; Çelik, M. S. Cla. Cla. Min. 2003, 51, 172-180.
CrossRef - Piccin, J. S.; Dotto, G. L.; Pinto, L. A. A. Braz. J. Chem. Eng. 2011, 28, 295-304.
CrossRef
Accepted on: May 20, 2018


![]()


