Validation of an Analytical Methodology for the Determination of Chloramphenicol Residues in Honey using UPLC-MS/MS
Syed Amir Ashraf1 and Z. R. Azaz Ahmad Azad2
1Department of Food Technology, Faculty of Engineering, JJT University, Jhunjhunu, Rajasthan, India.
2Department of Food Technology, FEIS, Hamdard University, New Delhi, India.
Corresponding Author E-mail: zrazad@gmail.com
DOI : http://dx.doi.org/10.13005/ojc/340214
Article Received on : October 04, 2017
Article Accepted on : January 25, 2018
The aim of present study was to develop and validate a simple, precise, accurate and sensitive method for the identification, validation and quantification of Chloramphenicol (CAP) residues in honey using ultra performance liquid chromatography mass spectrometry (UPLC-MS) coupled along with electron spray ionization (ESI). Separation of CAP was achieved by means of chromatographic column BEH C18 (100 mm x 2.1 mm, 1.7 μm) in gradient mode using water: acetonitrile as mobile phase. Validation of developed method was performed as per criteria outlined in European Commission Decision No 2002/657/EC. We found that, limit of quantification, decision limit and decision capability for CAP was 0.15 μg kg-1, 0.10μg kg-1 and 0.20 μg kg-1 respectively. The validated method showed adequate linearity and correlation coefficient was found to be more than 0.992. We found that, all the validation parameters were satisfactory and within the set limit of European Commission Decision 2002/657/EC.
KEYWORDS:Honey; Antibiotic Residues; Chloramphenicol; Method Validation; UPLC-MS/MS
Download this article as:| Copy the following to cite this article: Ashraf S. A, Azad Z. R. A. A. Validation of an Analytical Methodology for the Determination of Chloramphenicol Residues in Honey using UPLC-MS/MS. Orient J Chem 2018;34(2). |
| Copy the following to cite this URL: Ashraf S. A, Azad Z. R. A. A. Validation of an Analytical Methodology for the Determination of Chloramphenicol Residues in Honey using UPLC-MS/MS. Orient J Chem 2018;34(2). Available from: http://www.orientjchem.org/?p=43945 |
Introduction
Honey is a by-product of flower nectar and the upper aero-digestive tract of the honey bee (Apis mellifera), which is concentrated through a dehydration process inside the bee hive1. Since ancient times, honey has been used for food and medicine as evidenced in various Holy books such as Torah, Bible, Quran and various scientific literatures2,3. Honey is a complex biological matrix that contains a high concentration of various sugars and other important ingredients such as vitamins, protein, minerals, organic acids, antioxidant and enzymes4-6. The science and practice of bee keeping is known as apiculture. In apiculture, honeys are getting affected by various pathogenic microorganisms such as bacteria, fungi, endogenous and exogenous parasites causing honey bee infection7. Some of these microorganisms are mainly harmful and can make bee colonies breakdown. Melissococcus plutonius and Paenibacillus larvae a bacterial species causes severe brood diseases such as European foul brood and American foul brood disease respectively8. In order to prevent or treat such bacterial infections, beekeepers frequently administer a broad spectrum antibiotic such as chloramphenicol (CAP) to protect bee hives. However, administration or use of broad spectrum antibiotics may lead to contamination of honey 9,10. CAP is a broad-spectrum bacteriostatic antibiotic that exerts its effect by inhibiting bacterial protein synthesis. Research carried out on CAP shows that, it has several adverse effects on human beings such as bone marrow aplasia, aplastic anemia and gray baby syndrome 11, 12. Due to the potential harmful effects to human health, the use of CAP has been prohibited for the treatment of food-producing animals in several countries13. Presence of such antibiotic residue in honeys are unfavorable due to their potential toxicity or allergic reactions, that might be aggravated in sensitive persons as well as due to the facilitation of antibiotic resistance developed by causative pathogens4.
The European Union Reference Laboratories (EU-RLs) established recommended concentrations for the control of non-authorized substances such as CAP in honey. In this guidelines, recommended concentrations for honey is mentioned as tetracyclines (20 ppb), sulfonamides (50 ppb), streptomycin (40 ppb) and macrolides (tylosin and erythromycin, 20 ppb)7. However, in case of CAP, the EU has set Minimum Required Performance Limits (MRPLs) of 0.3 ppb14. Recently in December 2014, Food Safety and Standard Authority of India (FSSAI) regulation 2011 has been amended in regulation 2.3 of sub regulation 2.3.2 relating to antibiotics used for animal producing food under pharmacologically active substances as presented in Table 1.
Table 1: Tolerance levels (μg kg-1) for veterinary drugs used in honey as per Food Safety and Standards Authority of India
|
Classes |
Tolerance limit (μg kg-1) | Classes | Tolerance limit (μg kg-1) |
| Chloramphenicol | 0.3* | Streptomycin | 5.0* |
| Nitrofurans and its metabolite | 0.5* | Sulphonamides and its metabolite | 5.0* |
| Ampicillin | 5.0* | Erythromycin | 5.0* |
| Tetracycline | 5.0* | Tylosin |
5.0* |
*Limit of quantification on the basis of LC-MS/MS method.
Several methods have been developed and validated for the analysis of antibiotic residues in human food. But, the choice of method is always dependent on the objective of the analysis, availability and the required sensitivity for that particular analytes. The requirement for quantitative estimation at a very low concentration (μg kg-1) reinforces the need of an analytical technique that guarantees low Limit of detection (LODs) and is certain to identify and quantify residues 15. Chromatographic techniques coupled with mass spectrometry have become popular in recent years, most notably Ultra performance liquid chromatography–mass spectrometry (UPLC-MS/MS). UPLC-MS/MS have high speed of analysis, greater resolution, higher peak separation capacity and sensitivity which utilizes a novel technology called new generation of LC columns 16, 17.
The aim of our present study was to develop and validate an analytical developed methodology for the specific and sensitive determination of CAP in honey using UPLC-MS/MS. To enhance the precision and accuracy of the analytical method, the validation was done in compliant with European Community (EC) Decision 2002/657/EC. Finally, the method was applied for the quantification of CAP residues in different types of honey.
Materials and Methods
Chemicals and Reagents
CAP and Chloramphenicol-d5 were purchase from Sigma –Aldrich (St. Louis, MO, USA), Ammonium Acetate, Ethyl Acetate, Hexane, and CCL4 of high purity grade from Sigma-Aldrich (St. Luis, MO, USA). HPLC-grade water was obtained from Millipore (Darmstadt, Germany) Milli-Q system. LC–MS grade Acetonitrile was purchased from Merck Millipore. CAP standard was weighed 10 mg into 10 mL volumetric flask and dissolved with LC grade Acetonitrile. Concentration of stock standards was calculated considering their purity percentages. Moreover, Chloramphenicol-d5 was used as internal standards.
Sample Collection
Honey samples were purchased from the local markets of New Delhi and Gurgaon, India. Samples were stored at room temperature in the dark until analysis. Blank honey sample was checked for free from targeted antibiotics using the proposed method.
Chloramphenicol (CAP)
2 g honey sample weighed into a 50 mL centrifuge tubes. 2mL Milli-Q water with pH 3.3 was added and vortexes for 1 minute. 10mL ethyl acetate was added to the centrifuge tubes and centrifugation at 4500 rpm was performed for 3 times. After that, sample tube was evaporated to dryness at 40°C in N-Evaporator under gentle nitrogen stream. 1mL Milli-Q water and 1mL n-Hexane and CCl4 (50:50) were added to evaporated tubes. Subsequently, upper layer transferred and filtered into UPLC vials for analysis.
UPLC–MS/MS Analysis
UPLC–MS/MS (Waters Acquity Ultra Performance LC, Xevo TQ-S MS/MS, Waters Co., Milford, MA, USA) instrument was used to carry out this experiment. Which consists of a Waters Acquity Ultra Performance LC with a Waters column manager, binary system manager, sample manager coupled to a Waters XEVO TQD triple quadruple mass spectrometer equipped with electrospray ionization (ESI). An Acquity UPLC BEH C18column (1.7 μm X 2.1 mm X 100 mm) from Waters was used for the determination of CAP. LC parameter were established as mobile phase (A) Milli-Q water and (B) Acetonitrile [90:10], Injection flow 20μl, Flow rate 250μl/min, Column oven temp 40°C. Gradient program for CAP taking place with mobile phase A 90% and mobile phase B was 10 %, after 1.5 minutes mobile phase (A) becomes 10% and Mobile phase (B) becomes 90%, later on after 4.6 minutes mobile phase (A) becomes 90% and mobile phase (B) 10 % till 7 minutes. The operating parameters for the mass spectrometer were as follows: capillary voltage was 3.0 kV, source and desolvation temperatures for CAP were 150°C and 450°C, respectively. Data analysis and quantification were performed by using the Waters Mass Lynx software. The matrix-matched calibration method was used to quantify selected analytes.
Method validation
The UPLC–MS/MS method was validated according to 2002/657/EC guidelines. UPLC–MS/MS identification of antibiotic residues were verified during the course of the validation study by monitoring relative retention times, ion recognition, signal-to-noise ratio (S/N) and relative ion intensities. UPLC-MS/MS identification criteria were set out in the legislation and verified throughout the validation of the method. In this study, various validation parameters such as selectivity, linearity, recovery (accuracy), repeatability (precision), limit of quantification (LOQ), decision limit (CCα), detection capacity (CCβ), ruggedness were validated to evaluate the performance of the developed method.
Result and Discussion
The aim of this study was to develop and validate an accurate, rapid and cost effective method for the extraction, identification and quantification of CAP residues in honey sample using UPLC–MS/MS in negative electrospray ionization mode. Moreover, validation of method was performed according to guidelines outlined in European Commission Decision 2002/657/EC.
Method Development For Chloramphenicol Residue Analysis
In order to develop a method for the identification and quantification of CAP residue in honey, sample preparation and extraction were carried out using various organic solvent such as Ethyl acetate, Carbon tetrachloride and n-hexane. Moreover, separation of CAP and internal standard Chloramphenicol-d5 (CAP-d5) was achieved using aquity UPLC BEH C18 column by means of Milli-Q water and acetonitrile as mobile phase in gradient elution mode as mentioned in methodology section. Retention time for CAP and CAP-d5 were found to be 3.31 as presented in Fig.1. Blank samples were spiked with 0.15 μg kg-1 CAP standard solution and area for the spiked blank samples were presented out in Table 2. Previous study reported, evaluation of CAP using LC-MS/MS chromatography coupled with Shim-pack XR-ODS (75 mm x 2.0 mm, particle size: 2.2 mm). The results obtained in this study were in comparable with our results18.Similarly, our present study followed the existed method with certain modification in extraction procedure, mobile phase gradient elution and UPLC-MS/MS programming, which makes our method more appropriate for the analysis of CAP. Determination of CAP residue using Agilent 1100 liquid chromatograph mass spectrometry equipped with a binary pump and C18 Luna column (150 x 2 mm i.d., 5 mm) reported in previous studies. They uses deionize water and acetonitrile (80:20) as mobile phase in isocratic mode and the reported retention time was 6.7 minutes, which was comparatively higher than the developed method19. Few author reported methanol/water and 0.1% ammonium hydroxide as a mobile phase for the separation of CAP components using liquid chromatography and found that retention time for CAP and CAP-d5 was 9.920. However, we found that, aquity UPLC BEH C18 was best among the reported column as it reduces the separation time of the targeted analyte18,19. Based on previous reports, we found that, our developed method was an easy in sample preparation as well as restricting the use of solid phase extraction techniques have made sample preparation faster and cost effective.
However, application of mass spectrometry in UPLC permits evaluation of molecular mass of CAP in sequential manner in ESI regions. Triple quadruple system helps in ionization of targeted analytes in different ion ratios by primary mass selection and collision induced dissociation. Molecular separation and detection of analyte taking place in triple quadruple system. Based on multiple reactions monitoring (MRM) transition, optimized transition of CAP and CAP-d5 were presented in Table 3.
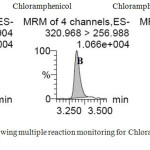 |
Figure 1: Chromatogram showing multiple reaction monitoring for Chloramphenicol (A & B) and Chloramphenicol-d5 (C) Click here to View figure |
Table 2: Optimized selectivity parameters for validated method of Chloramphenicol
| Compound 1 2 3 4 5 6 Mean SD % RSD | ||||||||||
| Chloramphenicol | RT | 3.31 | 3.31 | 3.31 | 3.31 | 3.31 | 3.31 | 3.31 | 0.001 | 0.04 |
| Area | 91 | 84 | 91 | 96 | 96 | 92 | 92 | 4.03 | 4.8 | |
SD: Standard Deviation
RSD: Relative standard deviation
Table 3: Optimized multiple reaction monitoring transition for Chloramphenicol
| Compound | Parent ion | Daughter ion | Cone Voltage | Dwell Time (Sec) | CollisionEnergy |
| Chloramphenicol | 320.97 | 151.90 | 30 | 0.025 | 14 |
| 193.98 | 30 | 0.025 | 10 | ||
| 256.99 | 30 | 0.025 | 10 | ||
| Chloramphenicol-d5 | 326.21 | 157.14 | 36 | 0.025 | 18 |
Method Validation
According to European Commission Decision 2002/657/EC, method validation was carried out for the determination of CAP residues in honey sample. All the validation parameters such as specificity, linearity, accuracy, precision, limit of quantification (LoQ), decision limits (CCα) and decision capability (CCβ) were evaluated. Values identified for all mentioned parameters were found to be within the guideline outlined in European Commission Decision 2002/657/EC.
Specificity
The method specificity was checked by preparing 7 different blank samples and injected into the UPLC chromatographic system. The analysis was performed and from the chromatogram & mass spectra, we found that, there were no interferences at the retention time of our interest of analytes as presented in Fig. 2 and the method was specific.
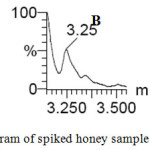 |
Figure 2: Specificity chromatogram of spiked honey sample (A) and blank sample (B, C) Click here to View figure |
Linearity
Response linearity was analyzed by creating calibration curve of the targeted analyte in the sample. To determine the relationship between concentration and response an adequate number of standards were evaluated. Sample spiked calibration curve constructed with eight different concentration ranges from 0.05 μg kg-1,0.15 μg kg-1,0.3 μg kg-1,0.45 μg kg-1,0.6 μg kg-1, 1.0 μg kg-1, 2.0 μg kg-1 and 5.0 μg kg-1 of the anlayte. We obtained a good linearity during the course of all the tested concentrations and corresponding correlation r2 was found to be 0.992.
Recovery
Recovery of an anlayte was obtained from the known concentration added to the sample matrix and recovered. To evaluate the recovery 7 blank honey samples were taken each spiked with CAP standard solution at 0.15 µg kg-1, 0.3 µg kg-1, 0.45 µg kg-1 and 0.6 µg kg-1. Recoveries of the spiked samples were presented in Table 4.
Table 4: Showing spiked concentration (µg kg-1) versus estimated concentration (µg kg-1)
| Sample | 0.15 | 0.3 | 0.45 | 0.6 |
| Sample 1 | 0.14 | 0.31 | 0.43 | 0.69 |
| Sample 2 | 0.15 | 0.24 | 0.42 | 0.66 |
| Sample 3 | 0.15 | 0.31 | 0.45 | 0.56 |
| Sample 4 | 0.14 | 0.33 | 0.46 | 0.64 |
| Sample 5 | 0.13 | 0.35 | 0.40 | 0.55 |
| Sample 6 | 0.15 | 0.24 | 0.43 | 0.70 |
| Sample 7 | 0.17 | 0.33 | 0.52 | 0.65 |
| Mean | 0.15 | 0.30 | 0.44 | 0.6 |
| SD | 0.01 | 0.05 | 0.04 | 0.06 |
| RSD % | 8.9 | 15.2 | 8.8 | 9.0 |
| Recovery % | 98.6 | 100.8 | 98.9 | 106.1 |
SD: Standard deviation RSD: Relative standard deviation
Repeatability (Precision)
Repeatability were evaluated by determining mean recovery and coefficient of variation of CAP in spiked samples using seven different concentration (0.15 µg kg-1, 0.30 µg kg-1, 0.45 µg kg-1 and 0.6 µg kg-1). During the course of analysis, each concentration was evaluated for 7 replicates as per the guidelines mentioned in European Commission decision. Same method was repeated in two other different days and coefficient of variation (CV) % and mean recovery (MR) % were calculated as shown in Table 5.
Table 5: showing different spiked concentration with % mean recovery and % coefficient of variation
| Analyte | 0.15 µg kg-1 | 0.3 µg kg-1 | 0.45 µg kg-1 | 0.6 µg kg-1 | ||||
| MR % | CV % | MR % | CV % | MR % | CV % | MR % | CV % | |
| Chloramphenicol | 98.1 | 7.9 | 98.4 | 10.3 | 98.6 | 9.3 | 102.5 | 9.0 |
MR- Mean recovery CV- Coefficient of variation
Limit of Quantification (LoQ)
LoQ was determined by taking seven blank samples spiked with 0.15 μg kg-1CAP standard solution and analysis was carried out three times. Recovery percentage and relative standard deviation were calculated as presented in Table 6. We found that, the percentage of recovery was in the range of 92- 104% and the percentage of relative standard deviation was 11%. On the basis of calculated values, we found that, the LoQ for our developed method was 0.15 μg kg-1. Which was satisfactory and acceptable as per the 2002/657/EC guidelines.
Table 6: Showing limit of quantification for chloramphenicol with spiked concentration
| Conc. Spiked (μg kg-1) | Conc. Recovered (μg kg-1) | Mean | RSD% | Recovery % | ||||||
| 1 | 2 | 3 | 4 | 5 | 6 | 7 | ||||
| 0.15 | 0.14 | 0.15 | 0.15 | 0.14 | 0.13 | 0.15 | 0.17 | 0.15 | 8.9 | 98.6 |
| 0.15 | 0.11 | 0.16 | 0.14 | 0.14 | 0.14 | 0.15 | 0.13 | 0.14 | 10.3 | 92.2 |
| 0.15 | 0.15 | 0.15 | 0.15 | 0.16 | 0.16 | 0.15 | 0.16 | 0.16 | 3.5 | 103.5 |
Decision limits (CCα), Decision capability (CCβ)
CCα and CCβ were determined by using blank honey sample spiked with different concentration of CAP standard solution (0.15, 0.3, 0.45, 0.6 μg kg-1). CCα and CCβ were calculated as presented in Table 7. CCα was measured as the lowest concentration of the CAP detected in sample with 1% chance of false positive decision. Moreover, CCβ was calculated as the smallest concentration of the CAP with a probability of 5% false negative decision. Our results were found to be in accordance with the 2002/657/EC.
Table 7: showing validation parameters for Chloramphenicol
| Compound | LoQ (μg kg-1) | Decision Limit (μg kg-1) | Detection Capability (μg kg-1) |
| Chloramphenicol | 0.15 | 0.10 | 0.20 |
Conclusion
A simple, sensitive, accurate and reliable method was developed for the identification, validation and quantification of Chloramphenicol (CAP) residues in honey. Identification of the targeted analyte was performed with tandem mass spectrometry using multiple reaction monitoring transitions, which revealed that, the fragmented ions were selective and sensitive for CAP and Cap-d5. In addition, use of chloramphenicol d5 as internal standards allowed an accurate and precise quantitation of CAP residues. Our studies showed that, the developed method meets the required sensitivities of 0.3 μg kg-1 as per the tolerance limit established by EC 2002/657/EC. Moreover, developed method was validated in accordance with European Commission Decision 2002/657/EC, which showed that, all the validation parameters were satisfactory and acceptable. In conclusion, the uniqueness of this method development was found to be less time consuming for CAP determination as well as elimination of solid phase extraction clean up procedure makes sample preparation faster and easy. The proposed UPLC–MS/MS method was found to be satisfactory for analysis of CAP in honey at μg kg-1 level.
Acknowledgements
We are thankful to the Department of Food technology, F.E.I.S., Hamdard University, New Delhi, for providing facilities to carrying out the present study. I especially want to thank Mr. Mohammad Moinuddin, for his cooperation during this study.
References
- Eteraf-Oskouei, T.; Najafi, M. Iran J. Basic Med. Sci. 2013, 16, 731-742.
- Ciulu, M.; Spano, N; Pilo, M. I.; Sanna, G. Molecules 2016, 21, 1-32..
CrossRef - Francis, A.; Cho, Y.; Johnson, D. W. Evid. Based Complement. Alternat. Med., 2015, 1-8.
- Da Silva, P. M.; Gauche, C.; Gonzaga, L. V.; Costa, A. C. O.; Fett, R. Food Chem. 2016, 196, 309–323.
CrossRef - Louppis, A. P.; Kontominas, M. G.; Papastephanou, C. Food Anal. Methods, 2017, 10, 3385-3397.
CrossRef - Rao, C. R. M.; Kumar, L.C.A.; Sekharan, C. B. International Research Journal of Biological Sciences, 2015, 4, 59-65.
- Pena, A.; Pelantova, N.; Lino, C. M.; Silveira, M. I. N.; Solich, P., J. Agric. Food Chem. 2005, 53, 3784-3788.
CrossRef - Hawari, K. E.; Mokh, S.; Doumyati, S.; Iskandarani, M. A.; Verdon, E. Food Addit. Contam., 2017, 34, 582-597.
CrossRef - Kivrak, I.; Kivrak, S.; Harmandar, M. Food Sci. Technol, Campinas, 2016, 36, 90-96.
CrossRef - Forti, A. F.; Campana, G.; Simonella, A.; Multari, M.; Scortichini, G. Anal. Chim. Acta 2015, 529, 257–263.
CrossRef - Guidi, L. R.; Silva, L. H. M.; Fernandes, C.; Engeseth, N. J.; Gloria, M. B. A. Scientia Chromatographica 2015, 7, 287-295.
CrossRef - Shi, X.; Song, S.; Sun, A.; Liu J.; Lia, D.; Chena, J. Analyst, 2012, 137, 3381-3389.
CrossRef - Cronly, M.; Behan, P,; Foley, B.; Martin, S.; Doyle, M.; Malone, E.; Regan, L. Food Addit. Contam. 2010, 27, 1233-1246.
CrossRef - 14. European Commission 2003/181/EC. Official J. of the European Union 2003, L71, 17-18
- Steiner, W. E.; English, W. A. J. Anal. Bioanal. Techniques, 2012, 3, 1-2.
- Jin, Y.; Zhang, J.; Zhao, W.; Zhang, W.; Wang, L.; Zhou, J.; Li, Y. Food Chem. 2017, 221, 1298–1307.
CrossRef - 17. Tamosiunas, V.; Padarauskas, A. Chromatographia 2008, 67, 783-788.
CrossRef - Kawano, S.; Hao, H.; Hashi, Y.; Lin, J. Chin. Chem. Lett., 2015, 26, 36–38.
CrossRef - Rodziewicz, L.; Zawadzka, I. APIACTA, 2007, 42, 27-30.
- Douny, C.; Widart, J.; Pauw, E.; Maghuin-Rogister, G.; Scippo, M. Food Anal. Methods, 2013,,6, 1458-1465.
CrossRef

This work is licensed under a Creative Commons Attribution 4.0 International License.
![]()
A New Edition of Web of Science
Journal Impact Factor
2022: 0.5
Five Year: 0.8
Journal is Indexed in

Cabells Whitelist
![]()


