Utilization of Natural Zeolite Clipnotilolit-Ca as a Support of ZnO Catalyst for Congo-Red Degradation and Congo-Red Waste Applications with Photolysis
Zilfa , Rahmayeni, Yeni Stiadi and Adril
Department of Chemistry, Faculty of Mathematic and Natural Science, Andalas University.
Corresponding Author E-mail: zilfa_58@yahoo.com
DOI : http://dx.doi.org/10.13005/ojc/340237
Article Received on : November 15, 2017
Article Accepted on : January 05, 2018
Studies on the degradation of Congo red compounds using ZnO / zeolite catalysts by photolysis have been done. Congo red compounds are dyes used for textile dyes whose wastes will be harmful to society. ZnO / zeolite is a simultaneous catalyst between degradation and adsorption. From the result of research of 10 mg/L Congo red got a percentage of degradation without catalyst 13.83%, 0.2 g ZnO / zeolite, 0.97%, 0.007 g ZnO, 58.86%, with irradiation time 60 minutes, and degradation of Congo red waste was, 52.68%. The result of degradation of Congo red waste was 52,68% with 60 minutes, irradiation time. The FTIR Congo red analysis shows a shift in the number of waves which means there has been degradation. While the characterization of ZnO/zeolite catalyst by FTIR, XRD, and SEM shows that there is no change of structure of ZnO /zeolite catalyst before and after degradation.
KEYWORDS:Congo Red; Degradation; Photocatalysis; ZnO/Zeolite
Download this article as:| Copy the following to cite this article: Zilfa Z, Rahmayeniv R, Stiadi Y, Adril A. Utilization of Natural Zeolite Clipnotilolit-Ca as a Support of ZnO Catalyst for Congo-Red Degradation and Congo-Red Waste Applications with Photolysis. Orient J Chem 2018;34(2). |
| Copy the following to cite this URL: Zilfa Z, Rahmayeniv R, Stiadi Y, Adril A. Utilization of Natural Zeolite Clipnotilolit-Ca as a Support of ZnO Catalyst for Congo-Red Degradation and Congo-Red Waste Applications with Photolysis. Orient J Chem 2018;34(2). Available from: http://www.orientjchem.org/?p=44435 |
Introduction
Zeolite is one of the many mineral resources contained in the earth of Indonesia whose utilization has not been maximized. In Indonesia, zeolite can be found in large quantities with almost pure form and low price. Natural zeolite has a pretty good potential in water and sewage treatment1-2. Natural zeolites are found in Indonesia such as Java and Sumatra. From the research that has been done is found zeolite type clinoptilolite-Ca in Lubuk Salasiah area, West Sumatera2-3.This zeolite has been used as an adsorbent material of some dyestuffs. In some articles, it is stated that zeolites can carry TiO2, CuO, and ZnO catalysts. This result can increase the percentage of degradation in processing organic waste, such as textile dyes and pesticides, so that simple compounds such as CO2 and H2O 3-5.
The rapid growth of the textile industry in Indonesia is making more and more industrial waste to be handled with special treatment. In the region of West Sumatra which is famous for its artwork weaving is one of the industries that use dyes as material dyes. Textile industry’s liquid waste is mainly produced from the coloring process (dyeing). Liquid waste generated from this process causes environmental pollution because it is discharged into aquatic bodies without first processing. The aquatic bodies are unable to degrade the dyestuff so that the watershed becomes colored and can not support the aquatic life system 5-7. Reactive dye is a dye that is widely used for textile dyeing. Textile dyes are one of the most bio-degraded pollutants, generally made of azo compounds and derivatives which are benzene groups. One of the most widely used azo dyes is Congo red. The dye is very soluble in water and can not be biologically degraded (recalcitrance). Azo compounds if too long in the environment will be a source of disease because it is carcinogenic and mutagenic, therefore it is necessary to find an effective method to describe the waste 3,8-9.
A way to overcome the waste of organic compounds can be done by degradation. Degradation is a method of breaking down harmful compounds into simple and harmless compounds such as CO2 and H2O 4. Degradation is processed using photolysis method. As for increasing the degradation result can be used ZnO / zeolite catalyst. To improve the ability of ZnO in degradation can be embedded in the zeolite 4-10.
Material and Methods
Materials
The materials used are dyes Congo Red, ZnO, Zeolite Clinoptilolite-Ca West Sumatera, NaCl, HCl, AgNO3, dan NaOH. Device used Spectrophotometer uv-vis, UV lamp 10 watts with λ = 365 nm, magnetic stirrer, dan furnace.
Experimental
ZnO/Zeolite Synthetic
Zeolites are activated by using HCl saturated with NaCl. Then 25 g of zeolite added aqua dest then slowly enter 1 g of ZnO while stirring. The result of the mixture was filtered and in the oven at a temperature of 100°C. The powder formed was crushed and saturated at 240 mesh. The sieve was calcined at 400°C for 24 hours.
Effect of Optimum Condition
Determination of Optimum Concentration of Congo Red
Created Congo red concentration of red 5, 10, 15, 20, and 25 mg / L then irradiated under UV lamp for 15 minutes. The radiation results were then measured using a UV-Vis spectrophotometer ( λ = 496 nm).
Determination of Effect of Degradation Time Without Catalyst Addition
20 mL Congo red 10 mg / L liquid was put into 5 tubes, then each tube was photolated with variations of 5, 15, 30, 45, 60, and 75 minutes under UV light. The degradation results were measured by a UV-Vis spectrophotometer.
Determination of Effect of Addition of Amount of ZnO / zeolite Catalyst
20 mL Congo red 10 mg / L liquid is put into 5 tubes. To the tube was added ZnO / zeolite catalyst as much as 0.04; 0.06; 0.12; 0.16; 0.2; and 0.24 g. Then it is photocolyzed during the optimum time of 60 minutes. Then centrifuged for 15 minutes, and the filtrate was measured with a UV-Vis spectrophotometer.
Determination of Time Effect After Addition of ZnO / zeolite Catalyst
20 mL Congo red 10 mg / L liquid is inserted into 5 tubes. Into the tube was added ZnO / zeolite catalyst with an optimum mass that is 0,2 g then do it photolysis with variation of time 5, 15, 30, 45, and 60 minutes. Then centrifuged for 15 minutes, and the filtrate was measured with a UV-Vis spectrophotometer.
Determination of Time Effect After Addition of ZnO Catalyst
20 mL Congo red 10 mg / L liquid is inserted into 5 tubes. Into the tube was added ZnO catalyst as much as 0.007 g ZnO (1/26 of 0.2 g ZnO / zeolite) then it was phototidized with variation of time 5, 15, 30, 45, and 60 minutes. Then centrifuged for 15 minutes, and the filtrate was measured with a UV-Vis spectrophotometer.
Determination of Time Effect After Addition of Zeolite Catalyst
20 mL Congo red 10 mg / L liquid is inserted into 5 tubes. To the tube was added zeolite catalyst as much as 0,192 g of zeolite (25/26 from 0,2 g ZnO / zeolite) then it was phototidized with variation of time 5, 15, 30, 45, and 60 minutes. Then centrifuged for 15 minutes, and the filtrate was measured with a UV-Vis spectrophotometer.
Result and Discussion
Effect Concentration Optimum Congo Red
20 mL of Congo red solution is photophysized with variations of concentrations of 5, 10, 15; 20; and 25 mg / L for 15 min obtained percentage of degradation in Fig 1.
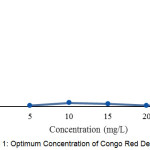 |
Figure 1: Optimum Concentration of Congo Red Degradation |
Fig 1, shows that the higher concentration percent degradation is greater, but the concentration of very large percentage of degradation decreases. This is due to the large concentration degraded with time for 15 minutes the ability of UV rays to photolysis progressively smaller. Here the largest percentage of degradation obtained at a concentration of 10 mg / L with a time of irradiation of 15 minutes was 3.907%.
Determination of Effect of Degradation Without Catalyst Addition
The degradation of congo red compound to 10 mg / L of 20 mL with UV light was done with time variation 5; 15; 30; 45; 60; and 75 minutes. Photolysis is a process of breaking water molecules into OH and H + radicals, where OH radicals will play a role to attack the clusters present in Congo red compounds 8,11 The more OH radicals formed the greater the percentage of degradation. The result of degradation can be seen in fig 2.
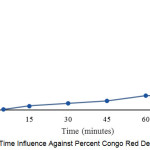 |
Figure 2: Time Influence Against Percent Congo Red Degradation Click here to View figure |
Fig. 2, shows that the longer the degradation percentage of photolysis increases, the longer the irradiation time of OH radical formation becomes greater, so the ability to attack the clusters present in the Congo red compounds is greater. From the result of research got percentage degradation 14,539% with time irradiation 60 minutes.
Determination of Effect of ZnO / Zeolite Catalyst on Congo Red Degradation Presentation
The influence of degradation time without a catalyst has not been able to produce perfect degradation, therefore it is necessary to add a catalyst called photocatalysis. The catalyst used herein is ZnO / zeolite which is expected to be degraded more and more. The result of degradation can be seen in Fig 3.
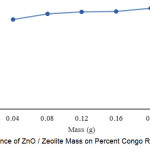 |
Figure 3: Influence of ZnO / Zeolite Mass on Percent Congo Red Degradation |
Photolysis accompanied by a catalyst is called by photocatalysis. Here there will be a process of phototransformation between the irradiation with the catalyst. This will result in OH through the oxidation of the surface of the hydroxide anion and the absorption of molecules of organic compounds on the semiconductor surface. ZnO / zeolite is a supported catalyst between ZnO and zeolite, here shows the occurrence of a simultaneous degradation process with absorption. ZnO is a catalyst and zeolite as an adsorbent 8-12. Figure 3 shows 10 mg / L of Congo red compound as much as 20 mL. For 60 minutes showed a percent increase in degradation proportional to the addition of the catalyst. Where the largest percentage of degradation in mass 0.2 g ZnO / zeolite percent degradation 97.16%.
Comparison of Congo Red degradation results using ZnO / Zeolite, ZnO, zeolite, and no catalyst
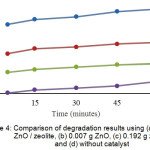 |
Figure 4: Comparison of degradation results using (a) 0.2 g ZnO / zeolite, (b) 0.007 g ZnO, (c) 0.192 g zeolite and (d) without catalyst Click here to View figure |
Fig. 4, shows the comparison of Congo red degradation results using 0.2 g of ZnO / zeolite, 0.007 g ZnO, 0.192 g of zeolite, and without catalyst. From the degradation results, it can be seen that ZnO support with zeolite can increase the percentage of degradation very significantly. This is due to the occurrence of photolysis and adsorption, and also zeolite is expanding the surface of ZnO so that the ability of ZnO to multiply the formation of OH radical is greater. For the use of ZnO / zeolite percent degradation obtained 97,16%, ZnO 58,86%, zeolite 34,75% and without catalyst 13,829% during 60 minute irradiation time.
Determination of degradation percentage Congo red without UV and with UV light
The use of ZnO / zeolite as a degradation of congo red compounds is also carried out in an atmosphere of UV light and without UV light. Can be seen in figure 5.
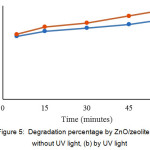 |
Figure 5: Degradation percentage by ZnO/zeolite (a) without UV light, (b) by UV light Click here to View figure |
Fig. 5, shows that congo red is more degraded by the use of ZnO / zeolite and is affected by UV light. This is due to the presence of UV rays the formation of OH radicals more and more, while the effect of ZnO / zeolite is the occurrence of synergy between degradation and absorption. ZnO / zeolite use without UV light is a synergy between degradation and absorption alone and is not aided by UV rays to increase OH radicals.
Determination of degradation percentage of Congo red waste application with ZnO/zeolite addition
The optimum condition of Congo red degradation was applied to Congo red waste simulation. 20 x 20 cm white cotton cloth dipped into 25 mg / L Congo red in 200 mL solution. The remaining dye of the Congo red solution was analyzed and degraded using the optimum conditions. The results of degradation can be seen in Figure 6.
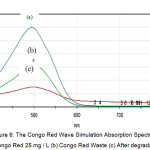 |
Figure 6: The Congo Red Wave Simulation Absorption Spectrum (a) Congo Red 25 mg / L (b) Congo Red Waste (c) After degradation Click here to View figure |
Fig. 6, shows that the remains of the congo red solution are 11.57 mg / L (b), whereas (a) is the initial congo red solution prior to dyeing of 25 mg / L. The rest of the solution was degraded where the degradation percentage was 52.68%. This states that ZnO / zeolite can be used to degrade congo red waste.
Analysis of functional groups of congo red degradation results by FTIR
Congo red was analyzed with standard FTIR, which was degraded without catalyst, with zeolite, ZnO, ZnO / zeolite and congo red waste applications shown in Fig.7.
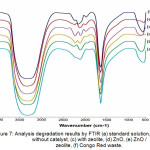 |
Figure 7: Analysis degradation results by FTIR (a) standard solution, (b) without catalyst, (c) with zeolite, (d) ZnO, (e) ZnO / zeolite, (f) Congo Red waste. |
Fig. 7, shows that the congo red solution can be degraded using zeolite, ZnO, and ZnO / zeolite catalysts. Compared to the above three catalysts it turns out that ZnO / zeolite produces many new clusters which are evidenced by the number of new peaks appearing, from the peak absorption at 3500 cm-1 wave number is the OH stretching model, the wave number 1700 cm-1 is C = O Aromatic. From the spectrum can also be seen in the number 1500 -2500 cm-1 showing the occurrence of more peak shifts in the use of ZnO / zeolite catalysts, and the application of Congo Red waste.
Characterization of the Catalyst Before and After Degradation by FTIR
The ZnO / zeolite catalyst used as a congo red compound is characterized by FTIR, either before degradation or after degradation can be seen in Fig. 8.
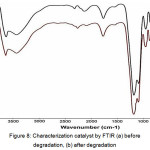 |
Figure 8: Characterization catalyst by FTIR (a) before degradation, (b) after degradation Click here to View figure |
Fig. 8 shows that ZnO / zeolite catalysts used before and after degradation did not undergo structural changes. The mechanical and chemical mixtures in van derr wals formation of Zn-O-Si are unconjugated catalysts so that when photocatalytic degradation is done at a time the catalyst will escape the environment (Malinoskwa, et al., 2003).
Characterization of Catalysts Before and After XRD Degradation
The ZnO, zeolite, and ZnO / zeolite catalysts prior to degradation and ZnO / zeolite after degradation were characterized by XRD can be seen in Figure 9.
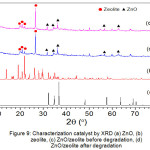 |
Figure 9: Characterization catalyst by XRD (a) ZnO, (b) zeolite, (c) ZnO/zeolite before degradation, (d) ZnO/zeolite after degradation |
Fig. 9, shows that the formation of a ZnO/zeolite clinoptilolite catalyst is the result of supporting zeolite into ZnO. Figure a shows the spectrum of ZnO located at 2θ 20-30 and the zeolite spectrum in figure b 20 – 40. Figure c is the result of ZnO support with zeolite clinoptilolite which is the catalyst used prior to degradation. Figure d is a ZnO/zeolite spectrum that has been used as a degradation of Congo red compounds. It turns out the ZnO/zeolite structure has not changed before and after degradation. This shows that ZnO/zeolite can be used as a catalyst in the degradation of Congo red compounds.
Photo of SEM Catalyst Before and After Degradation
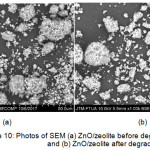 |
Figure 10: Photos of SEM (a) ZnO/zeolite before degradation and (b) ZnO/zeolite after degradation Click here to View figure |
SEM images of ZnO/zeolite before and after degradation are performed to look at homogeneity and to see the pores of the catalyst. From the picture, we can see that the structure is very homogeneous and this is due to the bonding between Zn-O-Si causing regular pores. From the SEM photo, we can see that there is no change in ZnO/zeolite structure before and after degradation.
Conclusion
The natural zeolite of West Sumatra Clipnotilolit-Ca type can be used as ZnO support. The result of degradation of Congo red compound using ZnO / zeolite of 0.2 gram is 97,17%, ZnO 0,007 g is 58,86%, zeolite 0,192 g is 34,75%, and without catalyst that is 13,829% with irradiation time 60 minute. The result of degradation of Congo red waste was 52,68% with 60 minute irradiation time. The FTIR Congo red analysis shows a shift in wave numbers which means degradation. While the characterization of ZnO / zeolite catalyst by FTIR, XRD, and SEM shows that there is no change of structure of ZnO / zeolite catalyst before and after degradation.
Acknowledgments
Acknowledgments to LPPM and Dean of Faculty of Mathematics and Natural Sciences of Andalas University which has funded this research with DIPA Faculty fund.
Reference
- Markani, M., Nasrollahi, M., and Ravanbakhsh. M., Environmental Health Engineering and Manajemen Journal., 2015, 2,107-22.
- Zilfa, Rahmayeni, Septiani, U., Jamarun, N., Lucky, M., J. Der Pharmacia Lettre., 2017, 9, 1-10.
- Nagarjuna, R., Roy, S., Ganesan, R., Microporous and Mesoporous., 2015, 211, 1-8.
CrossRef - Ahmed, L.M., Tawfeeq, F.T., Mariam, H., Al-Ameer,A., Al-Hussein, K., Athaab,A.R., Jurnal of Geoscience and Enviroment Protection., 2016, 4, 34-44.
CrossRef - Attia, A.J., Kadhim, S.H., and Hussein,F., E-Journal Of Chemistry.,, 2008, 5, 219-223.
CrossRef - Sekdar, S., Pattanayeh, S., Ghoral, T.K., Advanced Materials Proseeding., 2017, 2,107-112.
CrossRef - Alahiane, S., Sennaoui, A., Qourzal, S., Dinne, M., Sabbane, A., Journal Of Materials And Environmental Sciences., 2017, 8, 3556-3563.
- Hong, R.Y., Li,J.H., Chen, L.L., Liu,D.Q., Li, H., Zhenf, Y., Ding, J., Chemical Engineering Journal., 2009, 189,426-432.
- Elaziouti, Laouedji, N., and Ahmed, B., Journal Of Chemical Engineering And Process Technology., 2011, 2, 2157-7048.
- Fatimah, I., Sugiharto, E., Wijaya, K., Tahir, I., and Kamalia. Indonesian Journal Of Chemistry., 2006, 6, 8-42.
- Mohavedi, M., Mahjoub, A.R., Daizi, S.J., Journal Of The Iranian Chemical Society., 2009, 6, 575-577.
- Ebrahimifard, Reza., Journal Key Engineering Material. University Teheran, Iran., 2010,471-473.
- Krueta, V., Ninsoti, H., Watchakum, N., Inchisingvorn, B., Pookmane, P., and Phanichphant, S., Enggineering Journal., 2012, 16, 92-99.

This work is licensed under a Creative Commons Attribution 4.0 International License.
![]()
A New Edition of Web of Science
Journal Impact Factor
2022: 0.5
Five Year: 0.8
Journal is Indexed in

Cabells Whitelist
![]()


