Synthesis of Co, Mo, Co-Mo and Mo-Co Catalysts, Supported on Mesoporous Silica-Alumina for Hydrocracking of α-Cellulose pyrolysis Oil
Muhammad Fajar Marsuki, Wega Trisunaryanti , Iip Izul Falah and Karna Wijaya
Department of Chemistry, Faculty of Mathematics and Natural Sciences, Universitas Gadjah Mada Sekip Utara Bulaksumur, Yogyakarta, 55281, Indonesia.
Corresponding Author E-mail: wegats@ugm.ac.id
DOI : http://dx.doi.org/10.13005/ojc/340245
Article Received on : December 19, 2017
Article Accepted on : January 15, 2018
Mesoporous silica alumina (MSA) catalysts supported Co, Mo, CoMo and MoCo metals were synthesized in this work. The MSA catalysts were characterized by FTIR spectrometer, AAS, TEM, SAA and acidity test (pyridine adsorption). Their catalytic activity were investigated on hydrocracking of α-cellulose pyrolysis oil. The MSA presented BET specific surface area of 52.01 m2/g, total pore volume of 0.64 cm3/g and pore diameter of 3.80 nm based on BJH desorption method. The results showed that hydrocracking of α-cellulose pyrolysis oil using Co/MSA, Mo/MSA, CoMo/MSA and MoCo/MSA catalysts was selective for acetic acid, 1-hydroxy-2-propanone and 2-furancarboxyldehide production. The highest amount of liquid product was obtained by using CoMo/MSA catalyst about 82.13 wt.%.
KEYWORDS:Silica Alumina; Mesoporous; Catalysts; Hydrocracking; α-Cellulose
Download this article as:| Copy the following to cite this article: Marsuki M. F, Trisunaryanti W, Falah I. I, Wijaya K. Synthesis of Co, Mo, Co-Mo and Mo-Co Catalysts, Supported on Mesoporous Silica-Alumina for Hydrocracking of α-Cellulose pyrolysis Oil. Orient J Chem 2018;34(2). |
| Copy the following to cite this URL: Marsuki M. F, Trisunaryanti W, Falah I. I, Wijaya K. Synthesis of Co, Mo, Co-Mo and Mo-Co Catalysts, Supported on Mesoporous Silica-Alumina for Hydrocracking of α-Cellulose pyrolysis Oil. Orient J Chem 2018;34(2). Available from: http://www.orientjchem.org/?p=44631 |
Introduction
Waste management is a great challenge to be solved in environmental technology. Waste processing by combustion will produce CO2 emissions and cause air pollution. Conversion of waste into useful materials has become a concern to current researchers. The most studied waste conversion is conversion of biomass waste into useful materials such as bio-ethanol, bio-diesel, crude oil and others.
Biomass waste contains cellulose, hemicellulose and lignin. The biomass wastes can be converted into high-value chemicals. Production of chemicals such as food addictive, drugs, surfactants, organic solvents or fuels from biomass requires several conversion steps [1-4]. A way to convert biomass is through pyrolysis. Pyrolysis of biomass will produce tar, gaseous and liquid products (biomass pyrolysis oil). The biomass pyrolysis oil can be used for various purpose [5-8].
The biomass pyrolysis oil contains many oxidized organic components. Liquid product obtained from biomass pyrolysis need to be upgraded. A way to upgrade the quality of biomass pyrolysis oil is hydrocracking on the liquid products using catalyst. Noble metal such as platinum (Pt) and palladium (Pd) can be used as catalyst in hydrocracking processes [9-12]. However, the use of noble metals as catalyst is inefficient due to the cost of the noble metals. It makes metals on periods IV and V to be studied as catalyst. Bimetal catalysts from period IV and V had great activity for cracking hydrocarbon copounds (almost same with noble metals) [13-17].
The use of pure metal as catalyst in hydrocracking is ineffective because of the small metal surface area and possibility of sintering. These problems can be solved by supporting the metal in a porous material. Porous material provide high the surface area that cause the metals homogeneously distribute on the surface, thus prevent sintering and agglomeration of metals, therefore increase the catalyst active sites [18-20]. Mesoporous support was more effective to accommodate high molecule weight and big molecule shape of feed fill inside the pores compare to that of microporous material [21]. Mesoporous supports such as SBA-15 and MCM-41 had been studied as a good mesoporous support of catalysts from period IV and V in hydrocracking of biomass [22-24].
Synthetic mesoporous materials are expensive and not easy to find them in the market. These synthetic materials can be replaced by the material made from natural resources. One of natural resources that can be used to synthesize mesoporous materials is lapindo mud that had occoured since 2006 in Sidoarjo, East Java. The lapindo mudflow sweped up to 180,000 m3 of mud per day and contained a lot of silica and alumina [26-27]. This shows the potential of lapindo mud as a natural source in synthesizing mesoporous alumina silica. Mesoporous fabrication requires a template to regulate pore size during synthesis. The template are usually organic compounds like CTAB, HMI, and gelatin. The use of gelatin as a template in the synthesis of mesoporous silica alumina is still rare [28-29]. Gelatin is generally sourced from bone and skin of cow or pig [30-32]. However, religious reasons and mad cow disease make people begin to use marine animals as a source of gelatin [34-39]. Catfish that produced a lot of waste bone in the processing into food has not been widely utilized. Catfish bone waste can be used as a source of gelatin in the synthesis of mesoporous silica alumina.
In present study, the MSA was synthesized using silica and alumina extracted from Lapindo mud using gelatin extracted from catfish bone as a template. The MSA was impregnated with Co, Mo, CoMo, and MoCo metals. The catalysts were characterized and their activity were studied in hydrocracking process of α-cellulose pyrolysis oil. The results were discussed as followed
Experimental
Materials
Catfish bone was collected from Tegalrejo Village, Central Java, Indonesia. Lapindo mud was collected from Sidoarjo Regency, East Java, Indonesia. Sodium hydroxide was purchased from VWR Chemicals. α-cellulose was purchased from Sigma-Aldrich. Acetic acid, pyridine, cobalt nitrate hexahydrate and ammonium heptamolybdate tetrahydrate were purchased from Merck.
Synthesis of Mesoporous Silica Alumina
Silica (SiO2) and alumina (Al2O3) was extracted from lapindo mud using 6 M NaOH and 6 M HCl solution at 90°C, respectively. Catfish bone was prepared by soaking it in 0,1 NaOH solution for 24 h and 1 M HCl solution for 1 h. Gelatin was extracted from the catfish bone using demineralized water at 80°C. Catfish bone gelatin was dissolved in demineralized water at 40°C and stirred for 30 min. The gelatin solution was then added with alumina and stirred for 30 min. On the other glass container, silica was added with demineralized water and stirred for 30 min. The mixture of silica was then added with 1 M CH3COOH solution until the pH 4. The mixture of silica was added into mixture of gelatin and alumina and stirred for 24 h. The formed gel solution was moved into autoclave and hydrothermally treated at 100°C for 24 h. The final product was filtered, washed with demineralized water, dried at 50°C over a night and calcined at 50040°C for 5 h for removing of gelatin. The material was analyzed FTIR spectrometer, AAS, TEM, SAA and acidity test (pyridine adsorption).
Impregnation of Co and Mo on Mesoporous Silica Alumina
Cobalt (Co) and molybdenum (Mo) metals were impregnated onto the MSA by wet impregnation method using Co(NO3)2.6H2O and (NH4)6Mo7O24·4H2O salt solution and stirred for 24 h. The mixture was dried at 70°C for over a night. The catalyst was flowed by N2 gas and calcined at 500°C for 3 h. The catalyst was then flowed by H2 gas and heated at 450°C for 3 h. Mo metal was impregnated onto the MSA followed by Co metal produced CoMo/MSA catalyst and vice versa for MoCo/MSA catalyst. The catalysts were characterized by AAS, FTIR spectrometer and acidity test (pyridine adsorption).
Hydrocracking of α-Cellulose Pyrolysis Oil
α-cellulose was heated at 600°C for 4 h under N2 gas stream to produce α-cellulose pyrolysis oil. The liquid product obtained from pyrolysis of α-cellulose was hydrocracked at 600°C for 2 h in a semi-batch stainless steel reactor (id: 4.5 cm, od: 4.8 cm, length: 30 cm) using catalysts synthesized in this study. Catalyst/α-cellulose pyrolysis oil ratio was 1/30. The liquid product from pyrolysis of α-cellulose and hydrocracking of α-cellulose pyrolysis oil were analyzed by GC-MS.
Acidity Test
The acidity of the MSA and catalysts were determined by flowing the pyridine vapor into the sample at vacuum condition for 24 h at room temperature. The acidity value of the MSA and catalysts were calculated using the following equation:

Instrumentation
The functional groups of all sample were determined using fourier transform infrared spectroscopy (FTIR, Shimadzu Prestige-21) equipped with data station in the range of 400-400 cm-1 with a KBr disc technique. Surface area analyzer (SAA, Quantachrome NovaWin Series) was used to determine the surface parameters (surface area, pore volume, and pore diameter) of the MSA. The determination was based on physical adsorption of N2 gas at batch temperature of 77.3 K. The MSA was degassed at 300°C for 3 h. The pore image was taken using transmission electron microscope (TEM, JEOL JEM-1400) at 120 kV accelerating voltage. The liquid produced by hydrocracking of waste lubricant was analyzed using gas chromatography-mass spectrometry (GC-MS, Shimadzu QP2010S) with a column length of 30 m, diameter of 0.25 mm, thickness of 0.25 µm, temperature of 60-310°C, Helium gas as carrier gas, and acceleration voltage of 70 Ev.
Results and Discussion
Characterization of Mesoporous Silica Alumina
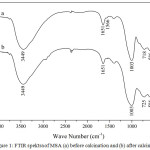 |
Figure 1: FTIR spektra of MSA (a) before calcination and (b) after calcination Click here to View figure |
Fig.1 showed FTIR spectra of MSA before and after calcination. Before calcination (see Fig.1a), FTIR spectra of MSA had absorption peak at 3449 cm-1 which corresponded to stretching vibration of O-H. FTIR spectra of MSA had also absorption peak at 1003 cm-1 which corresponded to asymmetric stretching vibration of T-O (T = Si or Al). Absorption peak at 718 cm-1 that appeared on FTIR spectra of MSA corresponded to symmetric stretching vibration of T-O. FTIR spectra of MSA had absorption peak at 586 cm-1 which corresponded to double ring vibration. Absorption peak at 424 cm-1 corresponded to bending vibration of T-O [40-42]. After calcination, absorption peaks which corresponded to symmetric stretching vibration of T-O and bending vibration of T-O on FTIR spectra of MSA (see Fig.1b) were shifted to 725 cm-1 and 455 cm-1, respectively.
Table 1: Properties of MSA
|
Properties |
Value |
|
Si/Al Ratio (AAS) |
0.69 |
|
Acidity Value (Pyridine Adsorption) |
4.82 mmol/g |
|
Surface Area (BET Method) |
52.01 m2/g |
|
Volume Total |
0.64 cm3/g |
|
Pore Diameter (BJH Desorption Method) |
3.80 nm |
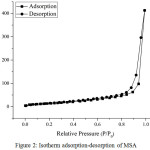 |
Figure 2: Isotherm adsorption-desorption of MSA |
AAS analysis results in Table 1 showed that the real Si/Al ratios of MSA was 0.69. The acidity of MSA was determined by introducing pyridine vapor on MSA at vacuum condition for 24 h. Increasing of MSA weight was used to measure their acidity value. Table 1 showed acidity (total acid amount using pyridine adsorption) of the MSA about 4.82 mmol/g. N2 adsorption-desorption isotherm of MSA was shown in Fig.2. The MSA showed type IV isotherm that indicated formation of mesoporous on the MSA.
Fig.3 showed TEM micrograph of the MSA. TEM result indicated that the MSA had a wormhole-like pore structure. This result was similar to those of the TEM micrograph of MSA that were synthesized on previous work [28-29,43].The pore size of MSA was not uniform because the gelatin used as template in synthesis of MSA had a wide moleculer weight distribution range.
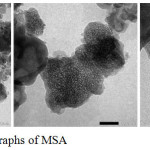 |
Figure 3: TEM micrographs of MSA
|
Characterization of Catalysts
Table 2: AAS and acidity test results of MSA
| Catalyst | Acidity Value (mmol/g) | Co (%) | Mo (%) |
| Co/MSA | 15.46 | 1.66 | 0 |
| Mo/MSA | 15.61 | 0 | 1.77 |
| CoMo/MSA | 16.58 | 2.12 | 1.65 |
| MoCo/MSA | 17.28 | 1.53 | 1.88 |
The metal content and acidity of metal supported-MSA catalysts were shown in Table 2. The Co/MSA contained 1.66% of Co metal. This result was almost equal to the MoCo/MSA that contained 1.53% of Co metal. However, the CoMo/MSA had more Co metal (2.12%) than the others. The Mo/MSA contained 1.77% of Mo metal. The amount of impregnated Mo metal in CoMo/MSA and MoCo/MSA was 1.65% and 1.88%, respectively. The amount of Co and Mo metals impregnated onto the MSA was less than 2% (initially amount of metal impregnated onto the MSA). Co and Mo salts could not be fully impregnated into MSA pore because Co and Mo metal salts also had interaction with the solvent. The interaction between salt and MSA could be resisted by interaction between salt and the solvent.
The acidity of MSA after impregnated with Co and Mo metals increased up to three times (more than 15 mmol/g) of the initial acidity of MSA (4.82 mmol/g). The acidity value of catalysts were shown in Table 2. Co and Mo metals had empty d-orbitals which could be Lewis acid site. The empty d-orbitals on Co and Mo metals could accept free electron pair of nitrogen atoms on pyridine ring compound [13]. This caused the acidity value of MSA increased significantly after impregnation of Co and Mo metals. The increasing of acidity of the catalyst was expected to increase their activity in hydrocracking of α-cellulose pyrolysis oil.
Acitivity of Catalysts
α-cellulose pyrolysis oil was physically dark brown and thick. Pyrolysis conducted in this research succeeded in converting α-cellulose into liquid product as much as 40.68%. α-cellulosic pyrolysis oil contained furan, ketones, alcohols, aldehydes and carboxylic acids. Five main components of the α-cellulose pyrolysis oil were 2-furankarboxyldehide (32.13%), 1-acetyloxy-2-butanone (10.73%), acetic acid (10.23%), 1-hydroxy-2-propanone (8.60%) and 2-hydroxy-3-methyl-2-cyclopenten-1-one (8.26%).
Table 3: Contents of α-cellulose pyrolysis oil.
| Yield (%) | Compound | |
| 0.51 | 2-hydroxy-3-methyl-1,4-naphthalenedione | C11H8O3 |
| 0.19 | acetaldehyde | C2H4O |
| 4.23 | acetone | C3H6O |
| 1.03 | acetic acid ethenyl ester | C4H6O2 |
| 1.59 | formic acid | CH2O2 |
| 2.16 | 2-butanone | C4H8O |
| 10.23 | acetic acid | C2H4O2 |
| 8.6 | 1-hydroxy-2-propanone | C3H6O2 |
| 2.86 | propanoic acid | C3H6O2 |
| 1.31 | methyl oxirane | C3H6O |
| 2.99 | butanoic acid | C4H8O2 |
| 32.13 | 2-furancarboxyldehide | C5H5O2 |
| 0.65 | 1-acetyloxy-2-propanone | C5H8O3 |
| 0.55 | 2-methyl-2-cyclopenten-1-one | C6H8O |
| 1.01 | 1-(2-furanyl)-ethanone | C6H6O2 |
| 0.16 | 1,2-butanolide | C4H6O2 |
| 10.73 | 1-acetyloxy-2-butanone | C6H10O3 |
| 7.92 | 5-methyl-2-furancarboxyldehide | C6H6O2 |
| 1.52 | 3-methyl-2-cyclopenten-1-one | C6H8O |
| 8.26 | 2-hydroxy-3-methyl-2-cyclopenten-1-one | C6H8O2 |
| 1.36 | 2,2-dimethyl-butanoic acid | C6H12O2 |
Hydrocracking of α-cellulose pyrolysis oil was carried out with and without (thermal hydrocracking) catalysts. Hydrocracking without catalyst was carried out to prove that the catalysts synthesized in this study had catalytic activity in the hydrocracking of α-cellulose pyrolysis oil. Thermal hydrocracking of α-cellulose pyrolysis oil resulted lowest liquid product conversion and it was dominated by the gas product as shown in Fig.4. High temperatures cause homolysis toward organic compound. The homolysis of organic compound formed free radical that could bind free radical of hydrogen to form short chain carbon compound. In addition, the radical compound could also bind other radical compound to form a short chain carbon compound. The short chain carbon compound would tend to be in the gas phase [30-31,44]. The hydrocracking of α-cellulose pyrolysis oil using the catalyst produced greater liquid product conversion than that of the thermal hydrocracking. The utilization of catalysts in the hydrocracking of α-cellulose pyrolysis oil increased the liquid product and decreased the gas product. This result indicated that the synthesized catalysts showed activity as expected.
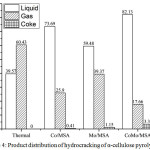 |
Figure 4: Product distribution of hydrocracking of α-cellulose pyrolysis oil |
The highest total conversion of α-cellulose pyrolysis oil was obtained from the hydrocracking using Co/MSA catalyst and the lowest total conversion was obtained from the hydrocracking using Mo/MSA catalyst. This phenomenon occured because all of 4d-orbitals on Mo metal had been filled with unpaired electrons making it was difficult to bind the hydrogen radicals produced from homolysis of hydrogen gas. However, Co metal had only three half-filled 3d-orbitals making it was easier to bind hydrogen radicals from homolysis of hydrogen gas than Mo metal.
The amount of liquid product obtained from hydrocracking using CoMo/MSA and MoCo/MSA catalysts was higher than Co/MSA and Mo/MSA catalysts. This phenomenon was caused by the synergetic effect between Co and Mo metals. Mo metal had previously been explained that it was difficult to bind hydrogen radical in hydrocracking reaction. It made the Mo metal had lower activity than Co metal. However, the use of Mo metal as a promoter could increase the activity of Co metal. It made the catalytic activity of CoMo/MSA and MoCo/MSA higher than Co/MSA and Mo/MSA.
The Co metal had a smaller atomic radius (2 Å) compared to Mo metal (2.17 Å). If Co metal was previously impregnated into the MSA, the Mo metal would coat the entire surface of the Co metal. It made only a half of the Co metal that could interact with the reactants. However, if the metal Mo is previously impregnated onto the MSA, Co metal would only coat a half of the surface of Mo metal. That means all of Co and Mo metals could interact with the reactants. The activity of catalyst would be greater, if all of Co metal could interact with the reactants. This explanation corresponded with the fact that the CoMo/MSA had higher total conversion of α-cellulose pyrolysis oil than MoCo/MSA in this study.
Table 4: Contents of liquid product from hydrocracking of α-cellulose pyrolysis oil
|
Catalyst |
Yield (wt.%) |
|||
|
1,2-ethanadiol (C2H6O2) |
acetic acid (C2H4O2) |
1-hydroxy-2-propanone (C3H6O2) |
2-furancarboxyldehide (C5H5O2) |
|
|
Thermal |
19.13 |
7.04 |
4.70 |
1.99 |
|
Co/MSA |
– |
32.57 |
12.34 |
9.54 |
|
Mo/MSA |
– |
16.09 |
11.10 |
14.89 |
|
CoMo/MSA |
– |
24.37 |
13.19 |
17.62 |
|
MoCo/MSA |
– |
16.32 |
15.49 |
6.66 |
The liquid product obtained from hydrocracking of α-cellulose pyrolysis oil was physically yellow and dilute. It was different from the α-cellulose pyrolysis oil which was dark brown and thick. The most components produced by the thermal hydrocracking was 1,2-ethanediol. The result was different from the hydrocracking of α-cellulose pyrolysis oil using the catalysts. The use of the catalysts in hydrocracking of α-cellulose pyrolysis oil made the liquid product did not contain 1,2-ethanediol, but contained acetic acid, 1-hydroxy-2-propanone and 2-furancarboxyldehide as the main compounds. The result proved that the catalysts synthesized in this study had activity in hydrocracking of α-cellulose pyrolysis oil.
Conclusion
The MSA synthesized in this study presented BET specific surface area of 52.01 m2/g, total pore volume of 0.64 cm3/g and pore diameter of 3.80 nm based on BJH desorption method. Acidity of MSA increased up to three times of the initial acidity after impregnation of Co and Mo metals. Hydrocracking of α-cellulose pyrolysis oil produced highest amount of liquid product by using CoMo/MSA catalyst, about 82.13 wt.%. Main compounds obtained from hydrocracking using the catalysts were acetic acid, 1-hydroxy-2-propanone and 2-furancarboxyldehide.
Acknowledgement
This research was conducted under the research grant of PUPT 2017 Universitas Gadjah Mada. The authors therefore thank to the Indonesian Ministry of Research, Technology, and Higher Education for the financial support (Contract number: 2454/UN1.P.III/DIT-LIT/LT/2017).
Refrences
- Klass, D. L. J. Environ. Qual.2004, 1, 193–212.
- Maschio, G.; Koufopanos, C.; Lucchesi, A.Bioresour. Technol.1992, 42, 219–231.
CrossRef - Collard, F. X.; Blin, J. Renew. Sustain. Energy Rev.2014, 38, 594–608.
CrossRef - Stefanidis, S. D.; Kalogiannis, K. G.; Iliopoulou, E. F.; Michailof, C. M.; Pilavachi, P. A.; Lappas, A. A. J. Anal. Appl. Pyrolysis.2014, 105, 143–150.
CrossRef - Sallevelt, J. L. H. P.; Pozarlik, A. K.; Brem, G. Energy Convers. Manag.2016, 127, 504–514.
CrossRef - Van De Beld, B.; Holle, E.; Florijn, J. Appl. Energy.2013, 102, 190–197.
CrossRef - Han, Y.; Stankovikj, F.; Garcia-Perez, M. Fuel Process. Technol.2017, 159, 328–339.
CrossRef - Krutof, A.; Hawboldt, K. Renew. Sustain. Energy Rev.2016, 59, 406–419.
CrossRef - Regali, F.; Boutonnet, M.; Järås, S. Catal. Today.2013, 214, 12–18.
CrossRef - Gutierrez, A.; Arandes, J. M.; Castano, P.; Olazar, M.; Bilbao, J. E.Energy and Fuels.2012, 26, 5897–5904.
CrossRef - Gutiérrez, A.; Arandes, J. M.; Castaño, P.; Olazar, M.; Bilbao, J. Fuel.2012, 94, 504–515.
CrossRef - Grilc, M.; Likozar, B.; Levec, J. Appl. Catal. B Environ.2014, 150, 275–287.
CrossRef - Sriningsih, W.; Saerodji, M. G.; Trisunaryanti, W.; Triyono; Armunanto, R.; Falah, I. I. Procedia Environ. Sci.2014, 20, 215–224.
CrossRef - Upare, D. P.; Park, S.; Kim, M. S.; Jeon, Y. P.; Kim, J.; Lee, D.; Lee, J.; Chang, H.; Choi, S.; Choi, W.; Park, Y. K.; Lee, C. W. J. Ind. Eng. Chem.2017, 46, 356–363.
CrossRef - Kadarwati, S.; Hu, X.; Gunawan, R.; Westerhof, R.; Gholizadeh, M.; Hasan, M. D. M.; Li, C. Z. Fuel Process. Technol.2017, 155, 261–268.
CrossRef - Nava, R.; Pawelec, B.; Castaño, P.; Álvarez-Galván, M. C.; Loricera, C. V.; Fierro, J. L. G. Appl. Catal. B Environ.2009, 92, 154–167.
CrossRef - Chen, W.; Mauge, F.; Van Gestel, J.; Nie, H.; Li, D.; Long, X. J. Catal.2013, 304, 47–62.
CrossRef - Muthu Kumaran, G.; Garg, S.; Soni, K.; Kumar, M.; Gupta, J. K.; Sharma, L. D.; Rama Rao, K. S.; Murali Dhar, G. Microporous Mesoporous Mater.2008, 114, 103–109.
CrossRef - Opalka, S. M.; Zhu, T. Microporous Mesoporous Mater.2016, 222, 256–270.
CrossRef - Lang, N.; Tuel, A. Microporous Mesoporous Mater.2005, 77, 147–157.
CrossRef - Meynen, V.; Cool, P.; Vansant, E. F. Microporous Mesoporous Mater.2009, 125, 170–223.
CrossRef - Lu, M.; Liu, X.; Li, Y.; Nie, Y.; Lu, X.; Deng, D.; Xie, Q.; Ji, J. J. Renew. Sustain. Energy.2016, 8, 1–12.
CrossRef - Khoshbin, R.; Karimzadeh, R. Adv. Powder Technol.2017, 28, 973–982.
CrossRef - Looi, P. Y.; Mohamed, A. R.; Tye, C. T. Chem. Eng. J.2012, 181, 717–724.
CrossRef - Twaiq, F. A.; Mohamed, A. R.; Bhatia, S. Microporous Mesoporous Mater.2003, 64, 95–107.
CrossRef - Abidin, H. Z.; Davies, R. J.; Kusuma, M. A.; Andreas, H.; Deguchi, T. Environ. Geol.2009, 57, 833–844.
CrossRef - Jalil, A. A.; Triwahyono, S.; Adam, S. H.; Rahim, N. D.; Aziz, M. A. A.; Hairom, N. H. H.; Razali, N. A. M.; Abidin, M. A. Z.; Mohamadiah, M. K. A. J. Hazard. Mater.2010, 181, 755–762.
CrossRef - Masykuroh, A.; Trisunaryanti, W.; Falah, I. I.; Sutarno.Int. J. ChemTech Res.2016, 9, 598–606.
- Trisunaryanti, W.; Lisna, P. S.; Kartini, I.; Sutarno; Falah, I. I.; Triyono.Asian J. Chem.2016, 28, 996–1000.
CrossRef - Pongsendana, M.; Trisunaryanti, W.; Artanti, F. W.; Falah, I. I.; Sutarno.Korean J. Chem. Eng.2017, 34, 1–6.
- Trisunaryanti, W.; Fallah, I. I.; Ningtyas, A.; Swasdika, F.; Ratna, D. A. Int. J. ChemTech Res.2016, 9, 96–103.
- Ulfa, M.; Trisunaryanti, W.; Falah, I. I.; Kartini, I. IOSR J. Appl. Chem.2015, 8, 57–63.
- Benjakul, S.; Oungbho, K.; Visessanguan, W.; Thiansilakul, Y.; Roytrakul, S. Food Chem.2009, 116, 445–451.
CrossRef - Wangtueai, S.; Noomhorm, A. LWT – Food Sci. Technol.2009, 42, 825–834.
- Al-Saidi, G. S.; Al-Alawi, A.; Rahman, M. S.; Guizani, N. Int. Food Res. J.2012, 19, 1167–1173.
- Tabarestani, H. S.; Maghsoudlou, Y.; Motamedzadegan, A.; Sadeghi Mahoonak, A. R. Bioresour. Technol.2010, 101, 6207–6214.
CrossRef - Karim, A. A.; Bhat, R. Food Hydrocoll.2009, 23, 563–576.
CrossRef - Nagarajan, M.; Benjakul, S.; Prodpran, T.; Songtipya, P.; Kishimura, H. Food Hydrocoll.2012, 29, 389–397.
CrossRef - Sinthusamran, S.; Benjakul, S.; Kishimura, H. Food Chem.2014, 152, 276–284.
CrossRef - Al Mubarok, M. A. S.; As Silmi, N. A.; Trisunaryanti, W.; Sutarno.Int. J. Acad. Sci. Res.2014, 2, 26–30.
- Xu, B.; Yang, Y.; Xu, Y.; Han, B.; Wang, Y.; Liu, X.; Yan, Z. Microporous Mesoporous Mater.2017, 238, 84–89.
CrossRef - Robson, H.; Lillerud, K. P. Verified Syntheses of Zeolitic Materials. Elsevier, Amsterdam 2001.
- Nurmalasari; Trisunaryanti, W.; Sutarno; Falah, I. I. Int. J. ChemTech Res.2016, 9, 607–614.
- Salim, I.; Trisunaryanti, W.; Triyono; Arryanto, Y. Int. J. ChemTech Res.2016, 9, 492–500.

This work is licensed under a Creative Commons Attribution 4.0 International License.
![]()
A New Edition of Web of Science
Journal Impact Factor
2022: 0.5
Five Year: 0.8
Journal is Indexed in

Cabells Whitelist
![]()


