Synthesis and Characteristics of the Magnetic Properties of Fe3O4–(CTAB-montmorillonite) Composites, based on Variation in Fe3+/Fe2+ Concentrations
Sri Hilma Siregar1, Karna Wijaya2 , Eko Sri Kunarti2 and Akhmad Syoufian2
1Department of Chemistry, Faculty of Mathematics and Natural Science, University Muhammadiyah Riau, Pekanbaru, Indonesia.
2Department of Chemistry, Faculty of Mathematics and Natural Science, Gadjah Mada University, Yogyakarta, 55281, Indonesia.
Corresponding Author E-mail: karnawijaya@ugm.ac.id
DOI : http://dx.doi.org/10.13005/ojc/340213
Article Received on : January 01, 2018
Article Accepted on : March 01, 2018
This research aims to determine characteristics of the magnetic properties of Fe3O4- (CTAB-Mt) composites and the effect of variation in Fe3+/Fe2+ concentrations on the characteristics of Fe3O4- (CTAB-Montmorillonite) composites. Fe3O4- (CTAB-Montmorillonite) composites were synthesized using an “in situ” co-precipitation method. The synthesis was carried out by mixing FeCl3·6H2O and FeSO4·7H2O (in different concentrations) with a mole ratio of Fe3+ to Fe2+ by 2:1, which was then mixed into the CTAB-montmorillonite suspension. This mixture was stirred using a magnetic stirrer at 3500 rpm for 30 minutes at a temperature of 85°C, then the ammonia solution 25% was added. reaction lasted for 24 hours. The resulting composites were characterized using XRD, BET, and VSM to measure the magnetic properties of the materials. Results of the XRD data analysis showed that the values of d(311) is equal to 2.5686 Å and d(220) is equal to 2.947 Å, which are the characteristics of the materials known as magnetite. Based on the VSM data obtained, the magnetic saturation (Ms) values for samples of different concentrations were as follows: SH01=14.0 emu/gram, SH02= 29.0 emu/gram, SH03= 28.9 emu/gram, SH04= 45.2 emu/gram, and SH05= 64.1 emu/gram.
KEYWORDS:Montmorillonite; Fe3O4-(CTAB-Mt); Magnetite
Download this article as:| Copy the following to cite this article: Siregar S. H, Wijaya K, Kunarti E. S, Syoufian A. Synthesis and Characteristics of the Magnetic Properties of Fe3O4–(CTAB-montmorillonite) Composites, based on Variation in Fe3+/Fe2+ Concentrations. Orient J Chem 2018;34(2). |
| Copy the following to cite this URL: Siregar S. H, Wijaya K, Kunarti E. S, Syoufian A. Synthesis and Characteristics of the Magnetic Properties of Fe3O4–(CTAB-montmorillonite) Composites, based on Variation in Fe3+/Fe2+ Concentrations. Orient J Chem 2018;34(2). Available from: http://www.orientjchem.org/?p=44740 |
Introduction
In recent years, the application of magnetic composite materials to overcome environmental problems is one problem that has attracted much attention from researchers. One of the materials currently being developed is magnetite (Fe3O4) which has advantages due to its crystalline properties and its magnetism, making it easier to regenerate [1,2]. Magnetite synthesis in nanometer scale has been done by various methods, such as by ways of sol-gel reactions, chemical solutions, sonochemistry, and co-precipitation [3,4]. Magnetite nanoparticles are materials that have a number of advantages such as superparamagnetism, high magnetic saturation, a good anisotropy contribution, and biocompatibility. In addition to their magnetic properties, magnetic materials can be utilized in various applications such as in photo catalysis, biological applications, biomedicine, metal separation, and absorbents [5,6].
Various studies have reported that unmodified magnetite nanoparticles have low thermal stability and low water solubility, and may react backward to form FeOOH at the intermediate phases [7]. The main composition of bentonite is mineral montmorillonite which has ion exchange properties. These materials are best used as an adsorbent to adsorb various water contaminants in the liquid waste. The presence of a negative charge in the montmorillonite crystalline interlayer, which is balanced by the presence of cations within its interlayer space, enables the binding of positively charged contaminant species such as organic and inorganic cations of metals [8,9]. The advantages of the use of these materials as an adsorbent are that they have a high surface area, are easy to obtain and not expensive, and have fairly good stability [10]. However, the disadvantage of the use of montmorillonite as an adsorbent is that it forms colloids/suspensions in liquid. This will pose a problem when recollecting montmorillonite particles after absorbing contaminants. In large-scale volumes of waste, separation by filtration and centrifugation takes time and costs a lot [11,12].
Clay of the smectite class is characterized by octahedral alumina and tetrahedral silicates with a ratio of 2:1. The substitution of Al3+ in the octahedral sheet with Mg2+ results in a negative layer charge that is compensated by hydrated cations absorbed in the interlamellar space. These cations can easily be substituted by others presenting in a solution [13]. Pillared interlayered clay includes a new family of clay based on two-dimensional materials and is used in absorption and catalysis. Clay pillaring with inorganic polycations results in the production of thermally stable rigid cross-linked materials with a large surface area, a particular porous texture, and acidity. The properties of pillared clay are determined by several factors such as preparation conditions of the polycations, the method of intercalation, and washing and drying steps [14]. By utilizing the characteristic properties of montmorillonite,solving the montmorillonite problem as an adsorbent, and modifying montmorillonite by combining the magnetite particles (iron oxides) with montmorillonite, there will be a chance of generating new materials which have two main properties, i.e.cationic exchangers derived from montmorillonite and responses to the external magnetic field due to the presence of magnetite particles in the montmorillonite interlayer. The first property is used to adsorb contaminants while the second one is used to recover the distributed composites in the liquid using permanent magnetic bars.
In this research, the Fe3O4-(CTAB-Mt) composites were synthesized using the “in situ” co-precipitation method. The research scope was variation in the concentration of the precursors, i.e. Fe3+ and Fe2+, with a mole ratio of 2:1. The manufacture of these composites is intended to improve the quality of the adsorbents so as to simplify the separation process. The Fe3O4-(CTAB-Mt) composites were characterized by FT-IR, XRD, BET, SEM-Mapping, and VSM.
Materials and Methods
Materials
CTAB-montmorillonite was derived from the results of previous studies. The chemicals used in this study were FeCl3·6 H2O, FeSO4·7H2O, NH4OH 25% (w/v). All chemicals used were of analytical reagent grade, obtained from the Merck Company. Double-ionized water was used in all experiments.
Synthesis of Fe3O4-(CTAB-Mt)
Montmorillonite-CTAB magnetic synthesis was done using the “in situ” co-precipitation method. As many as 5 g of Bentonite-CTAB was dissolved in 500 mL of aquabidest. The solution was stirred for 24 hours until it formed a homogeneous suspension. As many as 250 mL of a solution consisting of FeSO4·7H2O and FeCl3·6H2O was prepared with variation in the concentrations of Fe3+ and Fe2+ and then mixed into a bentonite-CTAB suspension. Afterwards, they were stirred at 3500 rpm for 30 minutes at a temperature of 85°C. As many as 25 mL of NH4OH was added slowly to the mixture above until it reached pH 10 to 11 and stirred for 2 hours more. The bentonite-CTAB magnetite composites generated were washed using hot aquabidest and then separated using the decantation method using an external magnet. Subsequently, they weredried at a temperature of 80 °C for 3 hours. The results obtained were analyzed using FT-IR to determine the functional group, XRD to determine crystallinity, and BET and VSM to determine the magnetic properties of the materials.
Results and Discussions
Synthesis of Fe3O4-(CTAB-Mt)
The Fe3O4-(CTAB-Montmorillonite) composites were synthesized using intercalation of metal polycations and intercalation of agents into the interlayers of CTAB-Mt silicates. CTAB-Mt materials were first synthesized by Siregar [15] in previous studies. These intercalated metal polycations replaced cations, exchanged interlayers, and, with calcination of iron polycations, changed into an oxide that supported the interlayers of CTAB-Mt silicates. Iron oxides enter the space between the sheets of CTAB-Mt through an ion exchange process or are deposited on a negatively charged CTAB-Mt surface. Ions with a higher charge tend to replace ions with a lower charge. Fe3+ contains more cations in the space between the CTAB-Mt sheets (Na+, K+, Ca2+, and Mg2+), thus Fe3+ can replace the cation’s cations. Fe2+ may experience ion exchange or attach to negatively charged CTAB-Mt surfaces. Fe3+ and Fe2+ then form Fe(OH)2 and Fe(OH)3 when NH4OH is added. After the treatment, Fe(OH)2 and Fe(OH)3 are hydrated in iron oxides (Fe3O4) to produce composites that have magnetic properties.
Generally, the interpretation of infrared spectra CTAB-Mt and Fe3O4-(CTAB-Mt) does not differ significantly (see Fig.1). The resulting characteristics show that infrared spectra can hardly provide a clear indication of the presence of iron oxides as a pillar within CTAB-Mt interlayers. The presence of magnetite nanoparticles is indicated by the absorption bands at 586.36 and 462.92 cm−1. These bands are attributed to FeO stretches of bulk magnetite and the shifting of the band of the FeO bond of bulk magnetite to a higher wavenumber, respectively. The OH (water-free) stretching vibration band and bending vibration peak appear at 3432.30 and 1635.64 cm−1 in Fe3O4-(CTAB-Mt), respectively. These indicate that Fe3O4 nanoparticles in the montmorillonite interlayer successfully.
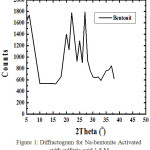 |
Figure 1: IR spectra of CTAB-Mt (a) and Fe3O4-(CTAB-Mt) (b). |
The XRD patterns of CTAB-Mt and Fe3O4-(CTAB-Mt) are shown in Fig.2. Based on the results of previous research [15], there is a shift in the angle by 2θ or more to the right (i.e. ranging from 4.61 to 4.96°) as a result of the formation of Fe3O4 in the intercross of CTAB-Mt silicates, which indicates that the intercalation process is successful. The Fe3O4-(CTAB-Mt) composites show wider and less sharp reflections. This happens due to the delamination of the silicates’ layer structure because of the intercalation process of complex metal cations. The Fe3O4-(CTAB-Mt) composites show additional diffraction peak positions at 2θ = 30.0, 35.3, 43.0, 53.4, 56.9, and 62.5° corresponding to the (220), (311), (4 0), (422), (511), and (440) planes of Fe3O4 in a cubic phase, respectively. It is clear that only the phase of Fe3O4 is detectable [16]. The Fe3O4 peaks formed on the XRD curve are of very high intensity, while the peak characteristic of CTAB-Mt is reduced in intensity. This indicates the entry of iron oxides into CTAB-Mt layers. These data show good agreement with the standard data for the Fe3O4 structure (JCPDS card file No. 3-863).
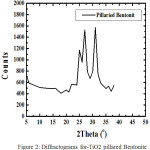 |
Figure 2: XRD patterns of CTAB-Mt (a) and Fe3O4-(CTAB-Mt) (b). |
The typical SEM images of CTAB-Mt and Fe3O4-(CTAB-Mt) are demonstrated in Fig. 3. Very fine microparticles can be observed with a diameter of 0.1 μm in the SEM of Fe3O4-(CTAB-Mt) composites. The presence of these fine particles leads to an increase in the porosity and the surface area of the modified CTAB-Mt. It can be seen from this figure that CTAB-Mt has large particles and a smooth non-porous surface (Fig.3a), but after intercalation by polymeric inorganic cations, those particles become loose and there are more stripped, loose, and curly sliced layers. The image shows the regular crystal structure and even distribution of diameters found in synthesized Fe3O4 nanoparticles. The micrographs of composite materials have a lot of particles covered, which suggest the presence of synthesized Fe3O4 particles covering the surfaces of Mt [17].
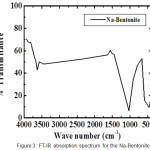 |
Figure 3: SEM images and iron mapping of CTAB-Mt (a) and Fe3O4-(CTAB-Mt) (b). |
The EDX analysis of the prepared adsorbents was carried out to determine their elemental compositions. Table 1 shows the EDX spectrum and elemental compositions of CTAB-Mt and Fe3O4-(CTAB-Mt). The EDX spectrum of CTAB-Mt shows that the percentages of the mass of MgO, Al2O3, and SiO2 (i.e. by2.19, 13.64, and 54.59 respectively) were the highest, while other elements like FeO were present in minute quantities (2.85 %). The EDX spectrum of Fe3O4-(CTAB-Mt) shows the highest percentage of the mass of FeO (37.09) coupled with minute quantities of MgO. Al2O3. SiO2 (i.e. by 1.04, 6.05, and 24.73respectively). The highest percentage of iron in the EDX spectrum of Fe3O4-(CTAB-Mt) resulted from magnetic nanoparticles. Thus the EDX spectrum of Fe3O4-(CTAB-Mt) confirms that CTAB-Mt was successfully loaded by magnetite nanoparticles [18]. Consequently, the FeO mapping of Fe3O4-(CTAB-Mt) clearly indicates good distribution of magnetite (blue dot) in Fe3O4-(CTAB-Mt) (Fig.3b).
The characteristics of the structure and components of Fe3O4-(CTAB-Mt) based on variation in the concentration of its precursors.
Results of the XRD pattern analysis for Fe3O4-(CTAB-montmorillonite) composites on variation in the precursor concentration can be seen in Fig. 4. Based on the XRD pattern of Fe3O4, it is indicated that iron oxidesare composed of spinel structures whose characteristic peaksoccur at 2θ, 30,32° (200), 35,82° (311), 42.90° (400), 54.18° (422), 56.98° (511), and 62.98° (440) and are appropriate for standard cards (Ref Code Fe3O4: 96-900-5840). Based on the XRD spectrum pattern, it can be concluded that if the concentration is higher, thenthe peak intensity typical of Fe3O4 will also be higher. For example, in the precursor concentration of (Fe2+/Fe3+) 0.025: 0.5 mg/L, the peak intensity at 311 is 65,while in a high concentration of 0.2: 0.4 mg/L, the peak intensity at 311 is 197. The Fe3O4 composites prepared with a precursor concentration of 0.1: 0.2 mg/L (SH04) and 0.2: 0.4 mg/L (SH05), except for compositeswith lower precursor concentrations such as samples SH04 and SH05, have the peaks at the same diffraction angle as Fe3O4 nanoparticles (JCPDS). If Fe3O4 is a nanoparticle, it forms magnetite which is successfully combined with montmorillonite and the resulting composites produce a magnet. This was evidenced by bringing the composites closer to the magnetic field, the composites thathave magnetic properties will stick to the magnet. Based on this simple magnetism test, it is revealed that there werethree composites that had magnetic properties, i.e. Composites in the samples SH04 and SH05. While composites in the samples SH03, SH01, and SH02 showed very weak magnetic properties.
Table 1: Elemental composition of CTAB-Mt and Fe3O4-(CTAB-Mt) samples determined by EDX.
| Samples | Element | Mass % | Compound | Mass % |
| CTAB-Mt | Mg | 1.32 | MgO | 2.19 |
| Al | 7.22 | Al2O3 | 13.64 | |
| Si | 25.52 | SiO2 | 54.59 | |
| K | 1.12 | K2O | 1.35 | |
| Ca | 0.89 | CaO | 1.25 | |
| Fe | 2.22 | FeO | 2.85 | |
| Fe3O4-(CTAB-Mt) | Mg | 0.63 | MgO | 1.04 |
| Al | 3,20 | Al2O3 | 6.05 | |
| Si | 11.56 | SiO2 | 24.73 | |
| S | 0.96 | SO3 | 2.4 | |
| K | 0.55 | K2O | 0.66 | |
| Fe | 28.83 | FeO | 37.09 |
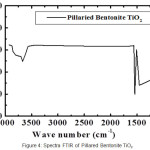 |
Figure 4: The XRD analysis of Samples SH02 (a), SH01 (b), SH03(c), SH04 (d), and SH05 (e). |
The similarity between samples SH04 and SH05 with Fe3O4 nanoparticles is evident in Fig. 4 through a straight line connecting the peaks of the diffraction results. This indicates that samples SH04 and SH05 contain magnetite. The peaks in other composite diffraction patterns areless strong compared to those of composites in the samples SH04 and SH05.
The N2adsorption-desorption of the Fe3O4-(CTAB-Mt) composite desorption, as determined in type IV and hysteresis loop of this isotherm type, was H3 in the classification of IUPAC, as shown in Fig. 5, and this clearly indicates that Fe3O4-(CTAB-Mt) represents a mesoporous feature. According to Fig. 5, the specific surface area, the total pore volume, and the average pore diameter were obtained and shown in Table 2. Composites showed significant increases in terms of their BET surface area, pore volume, and average size compared with CTAB-Mt and the success of Fe3O4-(CTAB-Mt) was evident from increased interlayer spacing [19]. The majority of the pores were macropores for the CTAB-Mt and mesoporous for Fe3O4-(CTAB-Mt).
Based on Table 2, the BET surface area of CTAB-Mt was 0.000 m2/g, as proposed by Parolo etal.[20], in organoclays with a surfactant loading exceeding 1.5 CEC of bentonite, the molecules are highly intercalated in the clay mineral interlayer space as well as in the interparticle pores, which leads to a decreased surface area and pore volume. Hence, the clay layers are almost completely enclosed and the pores are enlarged by the loaded surfactant molecules. This is consistent with the report of Kiransan et al. [21] that a value greater than 1.0 will reduce the increase of d-spacing. This is probably due to an excessive surfactant concentration, which causes the surfactant to be arranged laterally in a monolayer in bentonite. The average pore diameter of CTAB-Mt decreased slightly and most pore diameterdranged from 19.010 to 21.00Å. However, after modification with Fe3O4, the mesopore volume decreased evidently and there was an increase in the proportion of porediameters. Thus, the enlargement of the BET surface area could be mainly attributed to the increase in the pore diameter and the BET surface area in the proportion of smaller mesopores.
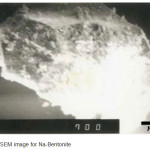 |
Figure 5: The N2 adsorption-desorption curve of Fe3O4-(CTAB-Mt). |
Table 2: The BET surface area and micropore structure parameters.
| Samples | BET surface (m2/g) | Average Poe diameter (Å) | Total pore volume (cm3/g) |
| CTAB-Mt | 0.000 | 19.010 | 0.874 |
| Fe3O4-(CTAB-Mt) | 64.806 | 46.596 | 0.247 |
Measurement using VSM was done by giving a magnetic field up to 1 Tesla. The magnetic moment generated by the sample as a result of the addition of a magnetic field signifies the magnetic properties of the materials. The greater the magnetic moment of a material is, the greater the magnetism is. The analysis of magnetic properties was carried out using a VSM (Vibrating Sample Magnetometer), particularly Oxford VSM 1.2H and it was undertaken in the Magnetic-Composite Materials-PTBIN-BATAN field. The magnetic hysteresis cycles of composites are shown in Fig. 6. The magnetic hysteresis cycle of Fe3O4-(CTAB-Mt) composite properties belongs to a soft magnetbecause the hysteresis cycle has a backward sequence which is almost symmetric when subjected to a magnetic field or when a magnetic field is removed. The data and coerciveness (Hc) are shown in Table 3. Based on the data, sample A has the greatest magnetic strength compared to other composites (B, C, D, and E). It can be concluded that precursor concentrations greatly affect the magnetic properties of the composites. The higher the precursor concentration is, the higher the magnetic properties of the composites are.
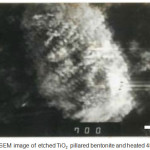 |
Figure 6: Magnetization curves of Samples SH05 (a), SH04 (b), SH03 (c), SH01 (d), and SH02 (e) with variation in the concentration of precursors (Fe2+/Fe3+).
|
Table 3: Dependence of Ms, Mc, and Hc on the content of Fe3O4 in Fe3O4-(CTAB-Mt).
| Samples | Mr (emu/g) | Ms (emu/g) | Hc (Tesla) |
| Sample SH05 | 17.9 | 64.1 | 0.0161 |
| Sample SH04 | 11 | 45.2 | 0.0198 |
| Sample SH03 | 9.12 | 28.9 | 0.0191 |
| Sample SH01 | 9.83 | 14 | 0.0194 |
| Sample SH02 | 4.93 | 29 | 0.0259 |
Conclusions
The Fe3O4-(CTAB-Mt) composites have been synthesized using the“in situ” co-precipitation method and characterized by XRD, BET, VSM, and SEM-EDX-mapping. Based on the research findings, the resulting Fe3O4-(CTAB-Mt) composites are blackish brown in color and have strong magnetic properties. The best characters of the composite are obtained from the ration of precursor consentrations(Fe2+/Fe3+) by 0.2: 0.4 mg/L. The greater the variation in the concentration of the precursors in the manufacture of Fe3O4-(CTAB-Mt) composites is, the higher the value of the resulting coercive field (Hc) is, thus the magnetic properties will also be greater.
Acknowledgments
The Authors are grateful to UMRI & UGM for admission and facilities to conduct the research, and Kemenristek DIKTI Grant for financial support through Penelitian Disertasi Doktor 2018.
References
- Masindi, V.; Gitari, M.W.; Tutu, H.; De-Beer, M. J. WaterProcess Eng., 2017, 15, 2-17.
- Lou, Z.; Zhou, Z.; Zhang, W.; Zhang, X.; Hu, X.; Liu, P.; Zhang, H. J. Taiwan Chem. Eng.,2015, 49, 199-205.
CrossRef - Wan, D.; Li, W.; Wang, G.; Chen, K.; Lu, L.; Hu, Q. Appl. Surf. Sci.,2015, 349, 988-996.
CrossRef - Guz, L.; Curutchet, G.; Sanchez, R.M.T.; Candal, R.; J. Environ. Chem. Eng., 2014, 2, 2344-2351.
CrossRef - Chen, D.; Li, W.; Wu, Y.; Zhu, Q.; Lu, Z.; Du, G.; J. Chem. Eng.,2013, 221, 8-15.
CrossRef - Hao, X.; Liu, H.; Zhang, G.; Zou, H.; Zhang, Y.; Zhou, M.; Gu, Y. Appl. Clay Sci., 2012, 55, 177-180.
CrossRef - Chen, H.; Li, Y.; Wang, S.; Zhou, Y. Appl. Surf. Sci.,2017, 402, 384-391.
CrossRef - Chang, J.; Ma, J.; Ma, Q.; Zhang, D.; Qiao, N.; Hu, M.; Ma, H.; Appl. Clay Sci.,2016, 110, 132-140.
CrossRef - Wu, H.; Xie, H.; He, G.; Guan, Y.; Zhang, Y. Appl. Clay Sci.,2016, 119, 161-169.
CrossRef - Yan, L.; Li, S.; Yu, H.; Shan, R.; Du, B.; Liu, T. Powder Technol.,2016, 301, 632-640.
CrossRef - Lv, G.; Li, Z.; Jiang, W. T.; Chang, P. H.; Liao, L. Mater. Chem. Phys., 2015,162, 417- 424.
CrossRef - Lian, L.; Cao, X.; Wu, Y.; Sun, D.; Lou, D. Appl. Surf. Sci.,2014, 289, 245-251.
CrossRef - Fatimah, I.; Narsito, Karna, W.; Indo. J. Chem. 2009,9, 1, 16-12.
- Suseno, A.; Wijaya, K.; Trisunaryanti, W.; Roto, Priyono. Int. J. Chem. Tech. Res.,2017, 10, 2, 40-44.
- Siregar, S.H.; Wijaya, K.; Kunarti, E.S.; Syoufian, A.; Suyanta. Asian J. Chem., 2018, 30,1 25-28.
- Wu, L.; Ye, Y.; Liu, F.; Tan, C.; Liu, H.; Wang, S.; Wang, J.; Yi, W.; Wu, W. Appl. Clay Sci., 2013, 83-84, 405-414.
CrossRef - Martins, M.G.; Martins, D.O.T.A.; de Carvalho, B. L.C.; Mercante, L.A.; Soriano, S.; Andruh, M.; Vieira, M. D.; Vaz, M.G.F. J. Solid State Chem.,2015, 228, 99-104.
CrossRef - Ishaq, M.; Sultan, S.; Ahmad, I.; Ullah, H.; Yaseen, M.; Amir, A. J. Saudi Chem. Soc.,2016, 21, 2, 43-151.
- Zhang, H.; Liang, X.; Yang, C.; Niu, C.; Wang, J.; Su, X.; J. Alloys Compd.,2016, 688, 1019-1027.
CrossRef - Parolo, M. E.; Pettinari, G. R.; Musso, T.B.; María P. Sánchez-Izquierdo, Fernández, L.G. Appl. Surf. Sci., 2014, 320, 356–363.
CrossRef - Kiransan, M.; Soltani, R.D.C.; Hassani, A.; Karaca, S. J.Taiwan. Inst. Chem. Eng.,2014, 45, 2565-2577.
CrossRef

This work is licensed under a Creative Commons Attribution 4.0 International License.
![]()
A New Edition of Web of Science
Journal Impact Factor
2022: 0.5
Five Year: 0.8
Journal is Indexed in

Cabells Whitelist
![]()


