Study on the Effect of Deposition Parameters on Characteristics of Electrochemically Synthesized Polyaniline and Poly O-Toluidine
Monimul Huque1, Golam Haider2 , Shah Rokonuzzaman2 and Aksaruzzaman Nuri2
1Department of Chemistry, BUET, Dhaka-1000, Bangladesh.
2Conservation Laboratory, Bangladesh National Museum, Shahbag, Dhaka-1000, Bangladesh.
Coressponding Author E-mail: drgolamhaider1960@gmail.com
DOI : http://dx.doi.org/10.13005/ojc/340221
Article Received on : October 17, 2017
Article Accepted on : January 20, 2018
Polyaniline and poly o-toluidine were electrochemically synthesized form their respective monomers. Electro polymerization was carried out galvanostatically using two vertical platinum sheets as anode and cathode respectively at three different current densities viz. 5, 10 and 15 mA/cm2. From the electrical conductivity data, UV-visible spectra, DTA and TGA it is found that both the polymers have maximum electrical conductivity, minimum band gap energy and higher thermal stability when the polymerization is carried out at 10 mA/cm2. It is thus concluded that there exists an optimum deposition rate for the electrode position of conducting polymer.
KEYWORDS:Polyaniline; Poly o-Toluidine; Oxidation; DTA-TGA and UV-visible Spectra
Download this article as:| Copy the following to cite this article: Huque M, Haider G, Rokonuzzaman S, Nuri A. Study on the Effect of Deposition Parameters on Characteristics of Electrochemically Synthesized Polyaniline and Poly O-Toluidine. Orient J Chem 2018;34(2). |
| Copy the following to cite this URL: Huque M, Haider G, Rokonuzzaman S, Nuri A. Study on the Effect of Deposition Parameters on Characteristics of Electrochemically Synthesized Polyaniline and Poly O-Toluidine. Orient J Chem 2018;34(2). Available from: http://www.orientjchem.org/?p=44107 |
Introduction
Following the successful synthesis of polyacetylene by Shirakawa et all1 in 1974 and its subsequent doping2 in 1977 conducting polymers become the attractive organic substances which show their potentiality as the replacement of traditional inorganic semiconductors, metals and super conductors. Organic polymers offer potential alternatives to inorganic materials because of their diversity, ease of fabrication and low cost. Furthermore, using organic polymeric materials the electronic and optical properties of a device can be controlled by designing the appropriate molecular structure prior to its fabrication. The research in molecular electronics is now concerned with the design and synthesis of new synthetic molecular materials and their evaluation and application in the electronics industry. In order to be useful for electronics application, the material must not only possess excellent optical, electronic and mechanical properties but also it should be solution or melt processible with high environmental stability. Keeping all these constrain in mind, chemists from all over the world are paying attention to conducting polymers. Among the several conducting polymers polyaniline (PANI) is being studied more and more and in recent years has been the centre of considerable scientific interest. During the last few years good number of authors has studied the products of chemical and electrochemical oxidation of aniline and its derivatives3-17. The results and interpretations are not without uncertainty and thus subject of much controversy.
The fundamental questions that arise concern the polymerization mechanism, the structure of the material in its oxidation states, the redox mechanism, the electronic and ionic conduction mechanism, the role of the doping ions, residual water, stability in open air etc. With regard to physico-chemical and electrochemical behavior the interpretation of the effect of different parameters particularly the polymerization condition is very important.
In a recent study18 the polymerization of aniline by chemical oxidation is reported to take place through oxidation to radical cation and subsequent addition of radical cation to oligomer. The energy band gap is affected by solvent, amount of oxidant used for polymerization and the temperature at which the polymerization is carried out. In that study it is reported that polymer prepared at 00C, 1:1.15 monomer oxidant ratio and in strongly acidic medium, has the lowest band gap and maximum electrical conductivity. In this paper we report the experimental results on the effect of different parameter particularly the current density and the substituted methyl group in the benzene ring on the characteristic properties of electro-chemically synthesized polyaniline.
Experimentals
The monomeric solution was prepared by dissolving 20 ml of aniline and 100 ml of H2So4 in each litre of distilled water. 20 g of activated charcoal was added to the solution and it was boiled for 15 minutes. The solution was then decanted and filtered to get a colourless solution which was subsequently used for electrochemical polymerization.
Electrochemical polymerization was carried out in a rectangular Perspex cell of 20cm length, 14 cm breath and 14 cm depth containing about 2 litres of aniline solution. Two platinum sheets each of 13 cm length and 12 cm width were placed vertically inside the cell and were used as anode and cathode. A constant current power source Kenwood (Model PD 3-10) was used to deposit polyaniline at the anode under galvanostatic condition. Deposition was carried out for about six minutes after which the anode was taken out of the cell and polyaniline was scrapped out of the anode by using a Perspex knife. Deposition was carried out several times to collect enough material for subsequent investigation. The sample was then washed thoroughly with distilled water to get rid of any free sulphate. After washing, the sample was dried in a vacuum oven at 60oC for about 20-hours. It was then stored in a desiccators. Following this procedure polyaniline and poly o-toluidine samples were prepared using three different current densities viz. 5, 10 and 15 mA/cm2. The temperature of the deposition bath was varied between 5-30oC.
For conductivity measurement, the polymer samples were pressed into pellets of 6mm diameter and 2mm thickness under a pressure of 330 kgf/cm2. Conductivity was then measured using the two probe method.
UV visible spectroscopy carried out employing a Hitachi double beam spectrophotometer (Model No 200-10). For UV-visible spectroscopy polymer samples were dissolved in DMF. Experiments were conducted using a scan rate of 2 nm/min. DTA and TGA of the samples were carried out by using Rigaku DTA/TGA apparatus at a scan rate of 10oC/min. The tests were done in air using 5mg samples.
Results and Discussion
Electronically conductive PANI is the simple 1, 4 coupling products of monomeric aniline molecule. This coupling reaction dominated in acidic media at pH 0-1 and initiated through the use of a strong oxidizing agent (e.g. ammonium persulpate) or at moderately high oxidation potential9. Totally reduced polyaniline structure i.e leucoemeraldine oxidation state is obtained at pH values ≥ 10. This structure of the individual molecules is changed via a protoemeraldine and/or emeraldine structure if the pH value is lowered to values between2-5. On further lowering of pH values the PANI Chain becomes protonated or oxidized. Similarly by changing other parameters of polymerization the structure and properties of palyaniline are changed which are reflected in the electrical conductivity, UV-visible spectra and thermogravimetric analysis of the polymers.
Electrical Conductivity
With respect to PANI the electrical conductivity is concerned with the nature of charge carriers, the way in which these carriers affect the conductivity and the nature of intermolecular arrangement and its effect on conduction properties of the material. The results of electrical conductivity obtained in this study are presented in Table 1. It is evident from the table that in general the electrical conductivity of the polymers polyaniline and poly o-toluidine, increases with the decrease of temperature. Maximum conductivity is observed at 9°C for both the samples. On further lowering temperature, the conductivity of polyaniline decreases. This may be due to the difficulty of the deposition of polymer on the electrode at lower temperature. In the case of poly o-toluidine the deposition did not take place at all lower temperature (5°C). Similar results are reported by F. Lux9 for chemical (Oxidation) synthesis of polyaniline. According to him polymerization reaction does not take place below-10°C.
Table 1: Electrical conductivity of polyaniline and poly o-toluidine at different temperatures [Current densities 10 mA/cm2. Deposition 6 min and bath composition 20% v/v]
|
Temperature |
Conductivity in Ω-1 cm-1 |
|
|
polyaniline |
o- toluidine |
|
|
room ~25 oC |
1.838 × 10⁻³ |
5.16 × 10⁻⁴ |
|
18 oC |
7.96 × 10⁻³ |
5.32× 10⁻⁴ |
|
9 oC |
1.14 × 10⁻² |
3.65× 10⁻³ |
|
5 oC |
8.48 × 10⁻³ |
– |
Table 2 shows the results of electrical conductivity of polyaniline and poly o-toluidine at different current densities. It is observed from the table that polymers prepared at the current density of 10 mA/cm2 have the highest conductivity. Similar results were reported by Gupta et all18, in the case of chemically synthesized polyaniline and poly o-toluidine where they found 1:1.15 as the optimum monomer oxidant ratio. It seems that probably at lower current density (5mA/ cm2) polymerization does not take place to a desired degree. Consequently the product has lower conjugation and conductivity is less than the expected value. In the case of higher current density (15mA/ cm2), the formation of intermediate radical cation predominates over the polymerization. Therefore, the product may contain low molecular weight oligomer which is evident from the colour changes of the bath solution (pinkish colour). From these observation it may be said that there might be an optimum current density (10mA/ cm2 in the case of PANI and poly o-toluidine) at which the polymer deposition will be better than any other values of current density.
Table 2: Electrical conductivity of polyaniline and poly o-toluidine at different current densities [Temperature 25oC bath composition is 20% v/v monomer].
|
current density (mA/ cm2) |
Conductivity in Ω-1 cm-1 |
|
|
polyaniline |
o-toluidine |
|
|
5 |
2.14 × 10⁻⁴ |
2.79 × 10⁻⁴ |
|
10 |
1.838 × 10⁻³ |
5.16× 10⁻⁴ |
|
15 |
4.595 × 10⁻⁵ |
6.03× 10⁻⁵ |
UV-visible Absorption Spectra
A typical UV-visible spectrum obtained in this study is shown in Fig 1. It is observed that there are two absorption peaks in the spectrum. One at around 300 nm and other at above 500 nm. The absorption band at around 300 nm corresponds to the π→π* (valence band to conduction band) transition and the absorption band at above 500 nm is associated with the charge transfer from benzenoid ring to quinoid ring structure.
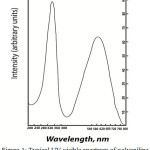 |
Figure 1: Typical UV-visible spectrum of polyaniline (Deposition current density 10 mA/cm2, 9oC). |
The results of UV-visible spectra analysis are presented in Table 3. It is evident from the table that in the case of polyaniline the absorption band appears at 350 nm at 5 mA/ cm2 current density and a bathochromic shift is observed with the increase of current density from 5mA /cm2 to 10 mA/cm2. However at higher current density (15 mA/ cm2) no further shift is found. This may be due to the increase in the rate of deposition with the increase in current density. At higher deposition rate the polymer might have longer conjugation which is supported by the conductivity value also.
Table 3: UV-visible absorption peaks (nm) of polyaniline and poly o-toluidine in DMF at different current density. [Temperature: Room temperature.]
|
current density mA/cm2 |
Polyaniline |
o- toluidine |
||||
|
π→π* band gap, nm |
Exciton nm |
Conductivity in Ω-1 cm-1 |
π→π* band gap, nm |
Exciton nm |
Conductivity in Ω-1 cm-1 |
|
|
5 |
350(3.54ev) |
535(2.32ev) |
2.14 × 10⁻⁴ |
315(3.94ev) |
600(2.07ev) |
2.79 × 10⁻⁴ |
|
10 |
360(3.44ev) |
590(2.32ev) |
1.883× 10⁻³ |
320(3.90ev) |
600(2.07ev) |
5.16× 10⁻⁴ |
|
15 |
396(3.44ev) |
550(2.32ev) |
4.595 × 10⁻⁵ |
360(3.44ev) |
600(2.07ev) |
6.03× 10⁻⁵ |
It is also observed from the Table-3 that band gap transition increases in energy with replacement of hydrogen atom by the bulky methyl group in the benzene ring. The methyl group in the benzene ring increases the torsion angle which makes the blue shift in the absorption band. Similar results are also reported by Ahmed et al17and Gupta et al19 in the case of chemically synthesized samples.
A typical DTA and TGA curve of electrochemically prepared polyaniline are shown in Fig.-2. The TGA curve shows an initial mass loss at temperature below 100oC. This is due to the loss of moisture from the sample. After the loss of moisture, weight remains almost constant up to about 500oC, about which a rapid loss of weight takes place. The weight loss at higher temperatures is due to the thermal decomposition of polyaniline which loses CH4 and eventually N2 as temperature is increased. The degradation of polyaniline was found to follow a single sigmoidal path. Similar behavior has also been observed in the case of chemically prepared polyaniline20.
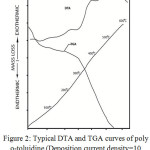 |
Figure 2: Typical DTA and TGA curves of poly o-toluidine (Deposition current density=10 mA/cm2, current density 5mA/cm2 =9oC). |
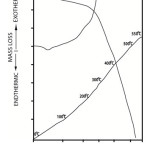 |
Figure 3: Typical DTA and TGA curves of poly o-toluidine (Deposition current density=5 mA/cm2, temperature 25oC). |
The DTA curve of polyaniline shows small endothermic peak at below 100oC. This endothermic peaks corresponds with the initial mass loss indicated by TGA and is due to the removal of absorbed water from the polymer21. The curve then shows an exothermic peak at around (225oC). This is thought to be due to crystallization. Upon further increase of temperature the DTA curve shows a sudden jump followed by couples of exothermic peaks. These sudden jump and exothermic peaks are linked to rapid oxidational degradation of polyaniline. The sudden rise in DTA curve corresponds with the rapid mass loss of the sample as indicated by the TGA curve. The DTA and TGA curves of poly o-toluidine is shown in Fig.3. The curve is found to show characteristics similar to that of polyaniline (Fig.2). This indicates that similar degradation process is operative in both polyaniline and poly o-toluidine samples.
The activation energy for thermal degradation of polyaniline and poly o-toluidine was determined following the sharp Wentworth method and assuming reaction order equal to one22
![Figure 4: A typical plot of log [dc/dt/(1-c)] versus 1/T, thermal degradation of polyaniline 5mA/cm2and 25oC).](http://www.orientjchem.org/wp-content/uploads/2018/04/Vol34No2_Stu_Mon_fig4-150x150.jpg) |
Figure 4: A typical plot of log [dc/dt /(1-c)] versus 1/T, thermal degradation of polyaniline 5mA/cm2and 25oC). |
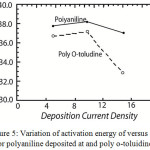 |
Figure 5: Variation of activation energy of versus 1/T for polyaniline deposited at and poly o-toluidine. |
Figure 4 shows typical log
versus 1/T curve, the slope of which gives the activation energy (where c is the fraction decomposed at time t and T is temperature). The activation energy for the thermal degradation of polyaniline obtained at various deposition current densities is shown graphically in Fig.5. It is seen that in the case of both polyaniline and poly o-toluidine activation energy tends to have a higher value at intermediate current density viz 10mA/cm2. It is further seen that the activation energy for polyaniline is always higher than that of poly o-toluidine.
Conclusion
Among the three deposition current densities investigated (5, 10 and 15mA/cm2) the current density of 10mA/cm2 is found to yield highest conductivity in both polyaniline and poly o-toluidine. Band gap energy calculated from UV-visible spectra supports this result. Activation energy calculated from TGA curves further show that polyaniline deposited at 10mA/cm2 possesses the highest thermal stability in air. It is therefore concluded that for the electrodeposition of conducting polymer, there exists an optimum deposition current density at which best are results are obtained and this optimum current density is found to be 10mA/cm2 in the present study.
References
- It, T; Shirakawa, H; Ikeda, S. J. Polym Sci., Polym, Chem. Ed. 1974, 12, 11.
CrossRef - Chiang, C.K.; Fincder, C.R.; Park, Y.; Heeger, W. A. J.; Shirakawa, H.; Luis, E.J.; Gau, S.C.; Mac Diarmid, A.J. Phys. Rev. Lett. 1977, 39,1098.
CrossRef - Genies, E. M.; Boyle, A.; Apkowski M.; Tjintavis, C. Synth. Met. 1990, 36, 139.
CrossRef - Ginder, J.M.; Epstein, A.J.; Physical Rev. 1990, 41, 15, 10674.
- Umare, S.S.; Huque, M.M.; Gupta M.C.; Viswanath, S.G.; Macromolecular Reports.1995, A32 (Supply.3), 281.
- Takakubo, M. Synth Met.1989, 33,19.
CrossRef - Ahmed, N.; Feng, P.; Schursky, H.; Shah, S.; Ind. J. Chem, Sec A. August. 1993, 679.
- Travers, J. P.; Genoud, F.; Menardo, C.; Nechtschein, M.; Synth Met. 1990, 35, 59. 9.
- Lux, F.; Polymer. 1994, 35.14, 2915.
- Wang, Z.M.; Javadi, H.H.S.; Phys. Rev. 1990, 42, 8, 5411.
- Wei, Y.; Focke, W.W.; Wnek, G.E.; Ray, A.; Mac Diarmid, A.G.J.; Phys. Chem. 1989, 93, 495.
CrossRef - Yue, J.; Wang, Z.H.; Cromack, K.R.; Epstein A. j.; Mac Diarmid, A. j.; J. Am. chem. Soc. 1991, 113, 2665.
- Macinnes, D. JR.; Lionel. Funt, B.; Synth. Met. 1988, 25, 235.
CrossRef - Neoh, K.G.; Pun, M.Y.; Kang, E.T.; Tan, K.L.; Synth. Met. 1995, 75, 209.
CrossRef - Avlyanov, J.K.; Jose Fowiez, J.Y.; Mac Diarmid, A.G.; Synth. Met. 1995, 73, 205.
CrossRef - Zhang, A.Q.; Cui, C.Q.; Lee, J.Y.; Synth. Met. 1995, 72, 217.
CrossRef - Wei, X.; Epstein, A.J.; Synth. Met. 1995, 74, 123.
CrossRef - Umare, S.S.; Huque, M.M.; Gupta, M.C.; Viswanath, S.G.; Macromolecular Reports. 1996, A33 (Suppls 7&8), 381.
- Gupta, M.C.; Umare, S.S.; Macromolecular Reports. 1991, 5.
- Warhadpande, S.V.; Radiation Effects on Conducting Organic Polymers. 1991, Ph.D.Thesis, Nagpur University, India.
- Wendlandt, W.W. M.; Thermal Analysis. 1986, John Wiley and Sons, NY.
- Sharp, J.H.; Wentworth, S.A.; Anal. Chem. 1969, 41, 2060.
CrossRef

This work is licensed under a Creative Commons Attribution 4.0 International License.
![]()
A New Edition of Web of Science
Journal Impact Factor
2022: 0.5
Five Year: 0.8
Journal is Indexed in

Cabells Whitelist
![]()


