Sequential Injection at Valve Mixing (SI-VM) for Determination of Albumin-Creatinine Ratio in Urine
Akhmad Sabarudin
Department of Chemistry, Faculty of Science, Brawijaya University, Jl Veteran 65154, Malang, Indonesia.
Corresponding Author E-mail: sabarjpn@gmail.com
DOI : http://dx.doi.org/10.13005/ojc/340215
Article Received on : January 24, 2018
Article Accepted on : February 25, 2018
Measurement of the albumin-creatinine ratio (ACR) as a medical index of renal failure is imperative to identify individuals at high risk of kidney disease. The present study is aimed to develop albumin and creatinine measurement method by sequential injection at valve mixing (SI-VM) for the determination of urinary ACR. The laboratory-made SI-VM system consists of a syringe pump, 8-port selection valve, RGB-LED detector, and holding coil. This system was controlled by a computer using a home-made software prepared by the Visual Basic program. The detection of albumin was based on dye-binding of methyl orange, while the Jaffe reaction was applied for the creatinine detection. Both albumin and creatinine were simultaneously and automatically measured using SI-VM, and the absorbance was recorded at 530 nm. Some parameters affected sensitivity, precision, and accuracy of the method, which includes pH of methyl orange, the volume of albumin, the concentration of NaOH, NaOH-picric acid ratio, and flow rate to detector were studied in detail. The proposed method was successfully applied to the determination of ACR in urine samples with satisfied results. Additionally, a rapid, sensitive, and accurate determination of ACR could be attributed to the SI-VM method.
KEYWORDS:Albumin; Creatinine; Dye-Binding; Jaffe Reaction; Sequential Injection
Download this article as:| Copy the following to cite this article: Sabarudin A. Sequential Injection at Valve Mixing (SI-VM) for Determination of Albumin-Creatinine Ratio in Urine. Orient J Chem 2018;34(2). |
| Copy the following to cite this URL: Sabarudin A. Sequential Injection at Valve Mixing (SI-VM) for Determination of Albumin-Creatinine Ratio in Urine. Orient J Chem 2018;34(2). Available from: http://www.orientjchem.org/?p=44703 |
Introduction
Kidney disease is increasing every year due to a large number of patients with diabetes and hypertension as a contributor to renal failure.1-3 Proteinuria, especially albuminuria, is the main indicator of kidney disease, wherein the albumin is present in the urine. Albuminuria is defined as urinary albumin excretion with levels of more than 200 mg/min or 300 mg/g creatinine. Albumin and creatinine is an important indicator for albuminuria and widely known as an early marker of diabetes, kidney disease, and hypertension.4-6 Detection of microalbuminuria is imperative to identify individuals at high risk of kidney disease. One of the methods commonly used to detect microalbuminuria and has been recommended by the National Kidney Foundation is albumin-creatinine ratio (ACR) measurement in a random urine specimen. ACR measurement is a precise and accurate test for kidney disease, also less likely to experience errors caused by the inaccuracy of urine collection method and variation in 24-hour urinary protein excretion.7-9
Siangproh and co-worker10 reported the determination of albumin-creatinine ratio (ACR) using spectrophotometric sequential injection analysis (SIA). Albumin was detected based on the dye-binding reaction. Various types of dyes such as methyl orange, bromocresol green, bromocresol purple, bromophenol blue, and tetrabromophenol blue wee used as the color-forming reagent. Furthermore, the determination of creatinine was based on the reaction between picric acid and creatinine in the alkaline conditions to form a red-orange compound (Jaffe reaction). In this method, reagents and sample were drawn sequentially to form a stacked zone, and the mixing of all solution occurred through dispersion. Accordingly, improvement of the reaction system between reagent and sample is necessary to increase the sensitivity of the method.
In this study, a method for ACR determination using SIA was developed by addition of the mixing tip at the selection valve of the SIA system (SI-VM), in which albumin and creatinine were measured by a dye-binding method with methyl orange and Jaffe reaction, respectively. The mixing tip was used to homogenize the reaction between sample and reagent so that a stacked zone could be avoided. The resulting sample-reagent complex was then detected automatically using the Red-Green-Blue (RGB) LED colorimeter.
Experimental
Reagent
All chemicals used were of pure analytical grade unless stated otherwise. Bovine serum albumin (BSA) was used as albumin standard in this work. BSA, creatinine, picric acid, methyl orange (MO), sodium hydroxide (NaOH), and ethanol were purchased from Sigma-Aldrich (Singapore). Hydrochloric acid (HCl) 37% was obtained Smart Lab (Indonesia).
A stock solution (100 mg/L) of BSA and creatinine were prepared by dissolving 10 mg of each BSA and creatinine in 100 mL of distilled water. NaOH (10 g), picric acid (0.344 g), and MO (0.1 g) were dissolved in 100 mL of distilled water to obtain a stock solution of NaOH 10% (w/v), picric acid (0.015M), and MO 0.1% (w/v), respectively. Working solution of each reagent was prepared daily by accurate dilution with distilled water. HCl was used to adjust pH of MO solution.
Instrumentation and Measurement Procedure
Figure 1a showed the laboratory-made sequential injection at valve mixing (SI-VM) manifold utilized in this study. The system was constructed by a syringe pump (SP; Hamilton, Reno, Nevada, USA) with the volume of 2500 mL, 8-port selection valve (SL; Hamilton, Reno, Nevada, USA), and RGB-LED detector. All flow lines and holding coil (HC) were made of PTFE tubing with an inner diameter of 0.75 mm and 1.8 mm, respectively. The SI-VM system was controlled by a computer using home-made software written with the Visual Basic program.
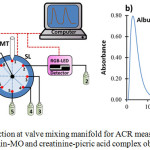 |
Figure 1: Sequential injection at valve mixing manifold for ACR measurement (a) and the peak profile of albumin-MO and creatinine-picric acid complex obtained by SI-VM (b). |
SP: syringe pump, HC: holding coil, MT: mixing tip, SL: 8-port selection valve, 1: water, 2: waste, 3: creatinine sample, 4: picric acid, 5: NaOH, 6: albumin sample, 7: MO, 8: waste
The protocol for measurement of ACR ratio using SI-VM could be divided into 2 steps, which is performed sequentially and automatically (fully controlled by a computer), as the following procedures: (a) albumin determination step; SP is set to aspirate 75mL of the albumin samples via the port 6 of SL and 50 mL of MO solution (0.005%, w/v) through the port 7 of SL into HC at the flow rate of 50 mL/s. Then, the zone of albumin-MO was dispensed to the mixing tip (MT) via the port 1 of SL and left for 10s to allow a complete reaction between reagent and sample. Afterward, the reaction product was flowed towards the RGB-LED detector via the port 2 of SL to record its absorbance and peak profile at 530 nm, (b) creatinine determination step; SP is set to aspirate 15mL of the creatinine samples, 85mL of picric acid (0.015M), and 15mL of NaOH (0.5%, w/v) into HC via the ports 3,4, and 5, respectively. This sample-reagent zone was then dispensed into MT via port 1 and left for 5s. After a complete reaction, the product was sent to the detector via the port 2. The absorbance, as well as the peak profile, was monitored at 530 nm. The peak profile of ACR measurement through simultaneous determination of albumin and creatinine was displayed in Fig.1b.
Calibration Curve and Sample Preparation
The calibration curve was constructed under optimum measurement condition using standard solution in the range of 0-10 mg/L for albumin and 0-50 mg/L for creatinine. Calibration data was evaluated by linear regression analysis, while the limit of detection was calculated by signal to noise ratio method (S/N = 3). Urine samples were diluted 50 times with distilled water prior to the measurement by SI-VM.
Result and Discussion
Parameter Optimizations
Sensitivity, precision, and accuracy are important analytical information for the development of ACR measurement by the SI-VM method. Therefore, some parameters affected the proposed method such as pH of the solution, the volume of albumin, the concentration of NaOH, NaOH/picric acid ratio, and flow rate to the detector was gently investigated.
pH has a significant influence on the species formation of MO and albumin when reaction proceeds, hence it also affects the complex formation of MO-albumin as indicated by its absorbance at 530 nm. Effect of pH was studied in the range of 3 to 6 as displayed in Fig. 2a. It was found that the highest absorbance was achieved at pH 5. This result indicates that the formation of MO-albumin complex is preferable in albumin’s isoelectric point due to the stable electrostatic interaction. Therefore, pH 5 was selected for the MO-albumin complex formation in a further experiment.
The volume of albumin is one of the parameters that influence the absorbance of MO-albumin complex since it corresponds to a number of samples that react with the reagent. Albumin volume was optimized in the range of 50 to 150 μL at intervals of 25 μL. As given in Fig. 2b, the highest absorbance was produced when albumin volume was 75 μL. Therefore, a sample volume of 75 μL was chosen for albumin determination.
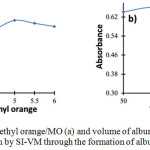 |
Figure 2: Effects of pH of methyl orange/MO (a) and volume of albumin (b) for the determination of albumin by SI-VM through the formation of albumin-MO complex |
The concentration of NaOH is very important to provide an alkaline environment for the formation of the creatinine-picric acid complex. NaOH concentration was tested in the range of 0.05% to 4.5% (w/v). According to the results showed in Fig. 3a, NaOH concentration of 0.5% reached a maximum absorbance of the creatinine-picric acid complex. The absorbance decreased along with the increasing NaOH concentration due to the formation of sodium picric precipitate under high alkaline condition [4]. Therefore, NaOH concentration of 0.5% was selected for creatinine determination throughout the experiment.
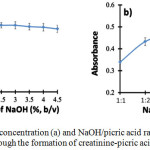 |
Figure 3: Effects of NaOH concentration (a) and NaOH/picric acid ratio (b) for the determination of creatinine by SI-VM through the formation of creatinine-picric acid complex |
NaOH-picric acid ratio relates to the composition of picric acid and NaOH for the optimum formation of the creatinine-picric acid complex. Picric acid acts as a forming agent of the complex formation. Accordingly, the picric acid should present in sufficient amount in order to react completely with all existing creatinine. The NaOH-picric acid ratio was investigated in the range of 1:1 to 1:6. It was found that the highest absorbance was obtained when the ratio of NaOH-picric acid was 1:5 as shown in Fig. 3b. Then, this ratio was chosen as the optimum composition for creatinine determination.
A slow flow rate of reaction products to the detector can cause dispersion in carrier solution; hence the absorbance will decrease, indicating less sensitivity of the method. However, the high flow rate can also lead to the decreasing sensitivity because not all of the products can be detected thoroughly by the detector. Therefore, this parameter should be carefully investigated to obtain the optimum flow rate towards the detector. The optimum flow rate for the determination of both MO-albumin and creatinine-picric acid complex was found to be 50 mL/s, which provides nearly symmetrical absorption peak profile, small broadening and tailing peaks, and also considerably fast detection time.
Analytical Properties of Merits
The calibration curve for albumin showed a good linearity in the concentration range of 0 – 10 mg/L, which was indicated by a correlation coefficient of 0.9884. Excellent linearity with a correlation coefficient of 0.999 could be attributed to the calibration curve of creatinine in the concentration range of 0 – 50 mg/L. The relative standard deviations (n = 5) of albumin and creatinine at a 2 ppm level were in the range of 0.4 – 3.2%, showing excellent reproducibility of the proposed method. Limit of detections as determined by the signal to noise ratio for albumin and creatinine were found to be 0.098 mg/L and 2.40 mg/L, respectively. The sample throughput was 90 samples for 1h, showing the excellent performance of the proposed method.
Application of SI-VM to Determination of ACR in Urine Samples
In this work, urine samples were diluted 50 times with distilled water prior to the ACR levels measurement to reduce such interferences of other substances existing in samples. Table 1 demonstrated the analytical results of ACR measurement using the SI-VM method from 6 urine samples. ACR level in a human body will vary depend on gender, weight, and nutrition intake. According to Joint National Committee and National Kidney Foundation, normal urinary ACR level is under 300 mg/g creatinine and will be diagnosed as microalbuminuria or at high risk of kidney disease if the urinary ACR level is above 30 mg/g. From the results shown in Table 1, urine B, C, E, and F were in normal range, while urine A and D were slightly above normal level, which indicates microalbuminuria. ACR measurement should be performed 2-3 times for 3-6 months to confirm the accuracy of diagnosis.
Table 1: Analytical results for the determination of ACR levels in urine samples (n=3)
|
Sample |
[albumin], mg/L |
[creatinine], g/L |
ACR, mg/g |
|
Urine A |
0.718 ± 0.004 |
0.022 ± 0.004 |
32.64 |
|
Urine B |
0.451 ± 0.012 |
0.027 ± 0.008 |
16.70 |
|
Urine C |
0.592 ± 0.008 |
0.025 ± 0.005 |
23.68 |
|
Urine D |
0.767 ± 0.014 |
0.024 ± 0.005 |
31.95 |
|
Urine E |
0.556 ± 0.006 |
0.025 ± 0.009 |
22.24 |
|
Urine F |
0.604 ± 0.007 |
0.026 ± 0.004 |
23.23 |
Conclusion
SI-VM allows a rapid, simple, automatic, and sensitive method for ACR determination. This method can be considered as an alternative technique in a clinical laboratory for early diagnosis of microalbuminuria.
References
- Van Buren, P.N.; Toto, R. Adv. Chronic Kidney Dis. 2011, 18, 28-4.
CrossRef - Mohart, V. Cor et Vasa 2013, 4, e397-e402
CrossRef - Shiba, N.; Shimokawa, H.; J. Cardiol. 2011, 57, 8-17
CrossRef - Ratanawimarnwong, N.; Ponhong, K.; Teshima, N.; Nacapricha, D.; Grudpan, K.; Sakai, T.; Motomizu, S. Talanta 2012, 96, 50-54.
CrossRef - Mctaggart, M.P.; Price, C.P.; Pinnock, R.G.; Stevens, P.E.; Newall, R.G.; Lamb, E.J. Am. J. Kidney Dis. 2012, 60, 787-794.
CrossRef - Florvall, G.; Basu, S.; Helmersson, J.; Larsson, A. Anal. Chem. Insights 2008, 3, 69-74
CrossRef - Sandilands, E. A.; Dhaun, N.; Dear, J.W.; Webb, D.J. Br. J. Clin. Pharmacol. 2013, 76, 504-515.
CrossRef - Guy, M; Borzomato, J.K.; Newall, R.G.; Kalra, P.A.; Price, C. P. Ann. ClinBiochem. 2009, 46, 468-476
CrossRef - Younes, N.; Cleary, P.A.; Steffes, M.W.; de Boer, I.H.; Molitch, M.E; Rutledge, B.N.; Lachin, J.M.; Dahms, W. Clin. J. Am. Soc. Nephrol. 2010, 5, 1235–1242.
CrossRef - Siangproh, W.; Teshima, N.; Sakai, T.; Katoh, S.; Chailapakul, O. Talanta 2009, 79, 1111-1117.
CrossRef

This work is licensed under a Creative Commons Attribution 4.0 International License.
![]()
A New Edition of Web of Science
Journal Impact Factor
2022: 0.5
Five Year: 0.8
Journal is Indexed in

Cabells Whitelist
![]()


