Resistant in Alkaline Media Core-shell Photocatalyst of Fe(TiO2/ Al2O3) for Degradation of Water Pollutant
Amir Hossein Haghighaty and Shahram Moradi Dehaghi
Department of Chemistry, Islamic Azad University Tehran North Branch, Tehran, Iran.
Corresponding Author E-mail: shm_moradi@iau-tnb.ac.ir
DOI : http://dx.doi.org/10.13005/ojc/340256
Article Received on : December 31, 2017
Article Accepted on : January 20, 2018
In this research, initially after preparing γ-alumina and Fe(III) doped γ-alumina prepared by the sol-gel method, the initial calcination of the sols was carried out for 3 h at 300°C and the obtained pulverized solid crystals were added into two sol-gel containers consisting of titanium tetra iso-propoxide (TTiP) and Fe(III) doped TTiP . After homogenization, the new sol was for 24 h and calcinated for 4 h at 600°C. After the process of washing and purification, the core-shells were prepared and characterized. The photocatalytic properties were compared to those of the pure TiO2, which had been prepared by the sol-gel method. Some of the properties of these new synthesized particles include increased effective surface area of TiO2 intake feed, increased activity of photocatalytic properties in terms of the alkaline pH, and enhanced strength of the core shell particles in the process of mechanical separation during the reactivation steps up to 10 times of recovery. Photocatalytic activity was examined by degradation of methylen blue. Doping Fe (III) in the core of γ-alumina, increased the mechanical stability while doping Fe (III) in the TiO2 shell decreased the time of degradation and increased the stability of the catalyst in an alkaline solution to a pH of about 12.
KEYWORDS:Core-Shell; TiO2/γ-Al2O3; Photocatalyst; Sol-Gel; Dopant; Composite
Download this article as:| Copy the following to cite this article: Haghighaty A. H, Dehaghi S. M. Resistant in Alkaline Media Core-shell Photocatalyst of Fe(TiO2/ Al2O3) for Degradation of Water Pollutant. Orient J Chem 2018;34(2). |
| Copy the following to cite this URL: Haghighaty A. H, Dehaghi S. M. Resistant in Alkaline Media Core-shell Photocatalyst of Fe(TiO2/ Al2O3) for Degradation of Water Pollutant. Orient J Chem 2018;34(2). Available from: http://www.orientjchem.org/?p=44676 |
Introduction
Core-shell composite construction of TiO2/Al2O3 has been highly regarded by researchers in recent years. The alumina core was coated with titanium dioxide in the photocatalytic industry by this technique in order to increase the mechanical strength of the composite and enhancing the productivity by reducing catalyst consumption [1, 2, 3, 4, 5 and 6].
This core-shell structure demonstrates high resistance to thermal shock, high chemical resistance, low electrical and thermal conductivities, high heat capacity and many other desirable properties [1, 3, 4, 5, 7, 8, 9, 10, and 11].
Doped metal ions in the core or shell can change physical and chemical properties in the final core shell composite [7, 9, 10, 11, and 12].
γ-Al2O3 and TiO2 have been produced by various methods, such as sol-gel, co-precipitation, and hydrothermal treatment. Doping metals can play important roles in the structural properties of the composite, especially in the porous structure [8, 12, 13, 14, 15, 16 and 17].
In the previous investigation team, we considered the sol-gel method to produce gamma alumina, but instead of full calcination, gamma alumina nanoparticles were dried at a temperature of 300ºC and then grinded. Alumina powder was added as a core to the titanium tetra iso-propoxide sol-gel. The new sol-gel was uniformed by a homogenizer and heated in two steps: first by applying thermal shock at 350ºC for 20 minutes and then by calcinating at 500ºC for 5 h to prepare the TiO2/ γ-Al2O3 core shell [13, 15 and18].
In the later stages the core shell composites of Fe/TiO2/γ-Al2O3 and TiO2//Fe/γ-Al2O3 were prepared by separately adding iron ions as a dopant into the alumina and titanium sol-gel alumina and titanium,. The structure and morphology of each core-shell structure and photocatalytic activity were studied.
Materials and Methods
Materials used in this research were titanium tetra-isopropoxide (TTiP), 95%, Aluminum Nitrate 9H2O 99.5%, Ammonium Bicarbonate 99%, 1-Hexadecanaminium, N,N,N-tri methyl bromide 99%, Absolute Ethanol, Nitric Acid 65 %, Ferric Nitrate 99%, Methylen Blue (MB) , and Hydroxypropyl Cellulose (HPC), 99% which were purchased from Merck Chemical Company.
Preparation of Nanocomposites
All used nanocomposite powders in this study were prepared using sol-gel process according to the following procedure.
Preparation of γ-Al2O3 (A)
For 0.0003 mole of 1-Hexadecanaminium, N,N,N-tri methyl bromide was added to 20 ml solution containing 0.06 mole of Al (NO3)3,9H2O and homogenized by stirring. An aqueous solution of NH4 NO3 (10% )was added drop wise to this solution while stirring at room temperature, then this sol was aged for 24 h to obtain a gel. The gel was dried in an oven at 80ºC for 5 h, and calcinated at 300ºC afterwards. Finally, the solid product was pulverized [19].
Preparation of the Nanocatalyst TiO2 Sample (T)
Two solutions containing nitric acid and TTiP were separately prepared in ethanol and then slowly mixed together. The mixture was stirred until the homogenized sol was formed. The sol was kept for 48 h at room temperature for the preparation of gel then it was dried for 3 h at 120ºC and calcinated in a furnace at 500ºC for 5 h.
Preparation of γ-Al2O3 //TiO2 (TA)
The comminuted alumina powder obtained from the mentioned γ-Al2O3procedures was added to the prepared sol of TTiP/nitric acid in ethanol and homogenized for 1h at 24000 rpm. After preparation of the uniform sol, it was kept and aged for 48 h at room temperature until the gel formed; then it was dried for 4 h in an oven at 120ºC and calcinated for 5 h at 500ºC.
Preparation of γ-Al2O3 //TiO2/Fe (FTA)
2.5 ml of Fe (NO3)39H2O (0.001 molL-1) solution, was added to 50 ml TTiP Sol and stirred for 30 minutes. The comminuted alumina powder was added slowly to the Fe/TTiP sol and homogenized with a powerful homogenizer at 24000 rpm for 1h; then it was aged at room temperature for 48 h to form a uniform gel. The obtained gel was dried at 120 ºC for 3 h and then calcinated in a furnace at 500ºC for 5 h.
Preparation of γ-Al2O3 /Fe // TiO2 (TFA)
For the preparation of certain moles of Fe/Al2O3 certain amounts of Fe (NO3)3, 9H2O was added to the sol of Al (NO3)3,9H2O, as described earlier separately. The same method was used for the powders of Fe/Al2O3 calcinated at 300ºC for 3 h. Then the powder was pulverized and added to the sol of TTiP. The method was applied for TiO2 nanoparticles and then homogenized for 1h and aged for 24 h at room temperature, subsequently; it was dried in an oven at 120ºC. Finally, it was calcinated in an electrical furnace at 500ºC for 5 h.
Based on the aforementioned procedures, eventually we synthesized four samples including pure TiO2 (T), TiO2 on γ-alumina substrate (TiO2//-Al2O3 (TA)), Fe doped in TiO2 and coated on γ-alumina substrate (Fe/TiO2//-Al2O3 (FTA)) and TiO2 coated on Fe doped in the γ-alumina substrate (TiO2 //Fe/-Al2O3 (TFA)).
Photocatalysis Activity
To examine the activity of photo catalysts, degradation of MB solution under ultraviolet radiation (two 8W, UVc Osram lamp) was measured. Some parameters such as catalyst weight, pH and concentration of the pollutant were considered in order to check and compare the photo catalyst activity; then efficient conditions were obtained for each catalyst.
Photocatalyst Weight
Initially in stable conditions, 50 ml of the solution containing a concentration of 5 ppm MB with a pH~7 was prepared and the amounts of 0.02, 0.06, and 0.08 g of each prepared catalysts were added to the reaction media, separately. In specific times the concentration of the catalyst was selected at this level. Pollutant was measured by the UV-Vis spectrophotometer (Cary UV-Vis 100) and the most effective weight of the catalyst was selected at this level.
pH
Optimum amounts of each catalyst were added to 50 ml of the MB solution in three containers with the pH of 2, 4, 7, 9, and 12 separately. The alteration of the concentration of pollutants versus time was analyzed by the UV-Vis spectrophotometer. Based on this method, each catalyst showed its own unique performance in various pH levels.
Concentration of Pollutant
After specifying the suitable weight and pH for each catalyst, we investigated the degradation power of the catalysts. In the optimum condition of weight and pH, for each catalyst, the rate of the degradation of MB in several concentrations was monitored by the UV-Vis spectrophotometer.
Multiple Reaction Monitoring Liquid chromatography Mass Spectrometer (MRM LC-MS) of pollutant
MRM LC-MS is a targeted Liquid chromatography and mass spectrometer approach that has been used to confirm the reduction and degradation of MB.
Results and Discussion
Characterization of the Photocatalysts
XRD
The XRD results were carried out to identify the samples with a SCIFERT- 3003 PTS X-ray diffractometer with CuKα radiation from 20 to 70 (2θ) at room temperature. The results included phase analysis, crystallite size, and the major’s peaks analyzed and presented in Table 1. Based on the XRD results in Figure 1, g-alumina and TiO2 were prepared with good quality. In the TA composite in which g-alumina had been integratedly covered by layering TiO2, the prominent peaks of g-alumina and TiO2 were clearly visible and recognizable. The low concentration of iron ions in the FTA and TFA composites and overlapping of Iron peaks with TiO2 peaks led to subtle changes in the XRD pattern of g-alumina and TiO2. So they could hardly have a trace in the XRD pattern. That is why elemental analysis (EDAX) was performed to confirm the presence of iron ions.
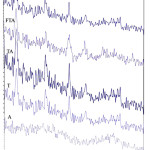 |
Figure 1: The shows XRD pattern of the samples A, T, TA, FTA, and TFA. |
Table 1: Shows the results obtained by instrumental techniques of A, T, TA, FTA and TFA.
|
Analysis Results |
A |
T |
TA |
FTA |
TFA |
|
Crystal phase |
g-Alumina (Al2O3) |
TiO2 (anatase) |
TiO2 (anatase) + Al2TiO5 |
TiO2 (anatase)+Fe2Ti3O9 |
TiO2 (anatase)+ Al3Ti0.75Fe0.25 |
|
FE-SEM Average particle size (nm) |
27 |
35 |
36 |
40 |
42 |
|
*XRD Major peak (2θᵒ) |
32.41 (108) 32.436.96 (217) 36.945.06 (317) 45.1 | TiO2:25.81 (101)25.8 | TiO2:25.42 (110)25.43Al2TiO5:33.71 (203) 33.7 | TiO2:25.28 (101)25.3Fe2Ti3O9:54.32 (102)54.33Fe2.25Ti0.75O4: 61.625(404)61.6 | TiO2:25.28 (101)25.3Al3Ti0.75Fe0.25:39.56 (111) 39.6 |
|
Crystal size Sherrer equation (nm) |
24.21 |
32.73 |
34.7 |
36.38 |
38.3 |
|
(*XRD: Observed peak( hkl)Standard peak) |
|||||
|
BET Specific surface area (m2/g) |
190 |
185 |
168 |
215 |
190 |
|
Band gap Eg (eV) λ (nm) |
9 (137.7) |
3.02 (410.59) |
2.96 (418.91) |
2.94 (350.28) |
3.54 (430.55) |
|
TEM Average particle size (nm) |
20 |
30 |
33 |
34 |
34 |
|
EDAX (W %) |
O(28.97), Al(71.03) |
O(25.76), Ti(74.24) |
O(46.6), Ti(47.9) Al(5.5) |
O(50.16) Al(33.9) Ti(14.69) Fe(1.05) |
O(49.44) Al(2.25) Ti(47.54) Fe(0.79) |
Elemental Analysis (EDAX)
Table 1 shows the quantitative analysis of Al, Ti, O and Fe as elements on these nano composites. As the results of elemental analysis reveals the weight of Al in the core was lower than the weight of titanium oxide on the shell, which represented the small nucleation of γ-alumina in the process of the construction of core-shell composites of TA, FTA and TFA. On the other hand, the presence of iron ion dopants in the structure of γ-alumina and TiO2 was confirmed.
Transmission Electron Microscopy (TEM)
The nanostructure of the samples was observed by TEM (EM 208, Philips); the results are shown in Figure 2. As the results reveal, the formation of the composite core shell leads to an increase in the size of spherical particles in uniform distribution of the composite. The average particle size obtained by the TEM is presented in Table 1.
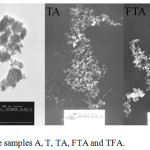 |
Figure 2: TEM images of the samples A, T, TA, FTA and TFA. |
Field Emission Scanning Electron Microscopy (FE-SEM)
Surface morphology and particle size of the synthesized nanophotocatalyst were characterized by FE-SEM (model zeiss). The results are presented in Figure 3 and table1. According to these results, particle size was increased by overlaying the thin layer of TiO2 on the g– alumina core without any change in the original spherical shape. Particle size obtained by FE-SEM is presented in Table 1.
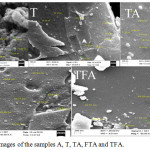 |
Figure 3: FE-SEM images of the samples A, T, TA, FTA and TFA. |
FTIR
FT-IR spectra of the A, T, TA, FTA and TFA nanocomposite are shown in Figure 4 in the wave range number of 4000 to 400 cm-1 by Thermo Nikolet Nexus 870 FTIR spectrometer. This figure also presents the re-appearance bending and stretching frequency for each bond.
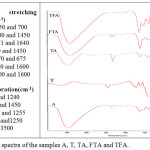 |
Figure 4: FTIR spectra of the samples A, T, TA, FTA and TFA. |
Photocatalytic activities of photocatalysts
Photocatalytic activity of T, TA, FTA, TFA nano photocatalyst for the degradation of MB solution at λ=664 nm under UV irradiation was investigated. The concentration of MB solutions was detected by a UV-Vis spectrometer. The degradation time of all catalysts was presented at five pH values (2, 4, 7, 9 and 12). The total degradation time for all experiments was confirmed by MRM LC-MS (Agilent model) and TOC analysis.
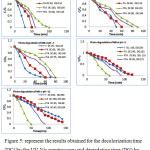 |
Figure 5: represent the results obtained for the decolorization time (DC) by the UV-Vis spectroscopy and degradation time (DG) by MRM LC-MS and TOC techniques for all photo catalysts. |
Based on the results obtained from the decolorization and degradation process at different pH levels, the catalysts T, TA, and TFA which had TiO2 shells, had much better activities in acidic conditions. In the neutral media, the TA catalyst showed a better performance as compared to T. The important fact to consider in this analysis was the deactivation of the catalysts T, TA and to a less extent TFA, in the alkaline media. FTA catalysts demonstrated high performance levels in the alkaline media; other catalysts which had a TiO2 shell could not show any prominent performance in these conditions. From the beginning to the final degradation step, the samples were analyzed by the UV-Vis spectrophotometer and measured in 10 minutes intervals to the decolorization step.
In the process of decolorization, the absorption levels of the sample were decreased in the visible region of 664 nm. This was a sign of the degradation and breakage of the molecule and disconnection of the resonance pathways of the electron π in the structure of MB. Consequently the UV absorption spectrum at the 250 – 290 nm range began to grow which was due to the presence of the pieces of aromatic rings. These pieces of aromatic rings were the results of the breakage within the MB structure. The UV irradiation process resulted in the decreased absorption to a point where absorption was zero. This could be considered as the final degradation point and a TOC was prepared from the sample at this point. The affirmation of degradation time was based on TOC results, presented in Figure 5.
In order to check the decolorization and degradation process we could consider the concentration of the MB sample in 3 time sequences including the initial step, the decolorization step (removal of the absorbed bond at the visible spectrum of 664nm), and the final degradation step (removal of the absorption at the UV range of 250-290nm) by MRM LC MS. As shown in Figure 6, we reviewed the concentration and the criteria peaks of MB were monitored at the LC chromatogram in the retention time of 9.3 and in MS at the peaks of 252 and 268. The diminution trend and the removal of MB were considered and the TOC and UV-Vis results were confirmed. According to the results brought in Table 1, this decreasing trend under the peak of the LC chromatogram and at the peak of MS could be clearly seen [20].
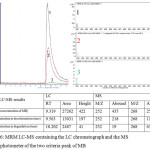 |
Figure 6: MRM LC-MS containing the LC chromatograph and the MS spectrophotometer of the two criteria peak of MB |
The Recyclability Test (under UV-light for 120 min, the concentration of MB 10 ppm)
All photocatalysts (T, TA, FTA and TFA) could be recyclable for the photodegradation of the MB aqueous solution under UV irradiation. The catalyst, after being used, could be recyclabe by 3 methods; in the first method, pickling was done in 0.1 N of the HCl solution for 30 minutes and filtered. Then it was allowed to get dried in the air and heat, treated for 12 h at 120ºC, to remove the volatile compounds. In the second method, alkaline was etched in 0.1 N of the NaOH solution for 30 minutes and filtered, and then it was allowed to get dried in the air and heat, treated for 12 h at 120ºC. In the third method, it was calcinated in a furnace at 500ºC for 4 h. After comparing the results, FTA was found to have high recyclability in the thermal recovery condition.
Table 2: Number of recycling times(*) and photo degradation percentage in comparison with the first degradation percentage at the optimum condition (0.05g photocatalyst, 50ml MB solution 10 ppm, pH~7)
|
|
Photocatalyst |
|
|
|
|
recovery condition |
T |
TA |
FTA |
TFA |
|
Acidic etching |
||||
|
Number of recycling |
3 |
3 |
5 |
3 |
|
Average recovery percent |
80, 40, 13 |
71, 35, 17 |
82, 75,64, 49, 28 |
74, 38, 16 |
|
Alkaline etching |
||||
|
Number of recycling |
3 |
3 |
6 |
3 |
|
Average recovery percent |
95, 70, 20 |
82, 65, 10 |
90, 80, 75, 60, 35, 22 |
71, 64, 29 |
|
Thermal |
||||
|
Number of recycling |
6 |
6 |
10 |
5 |
|
Average recovery percent |
80, 75, 60, 30, 25, 10 |
85, 80, 72, 60, 30, 18 |
88, 84, 80, 70, 64, 5, 48,40, 36,19 |
79, 70, 55,25, 14 |
Conclusions
Based on the obtained results we can review the achievements of this research on several subjects.
Considering that the photocatalytic reaction of TiO2 occurs on a surface, the amount of catalyst usage drastically decreases by layering TiO2 with a stratified thickness of 10 nm in the presence of the TA catalyst compared to the T catalyst.
The method of processing in core-shell catalysts was based on the incomplete calcination of γ-alumina in the initial stage followed by layering TTiP on the catalyst in a sol-gel media as the second stage and a final calcination process. The 3 phases were layered on top of each other. γ-alumina was the central core and the layers consist of Al2TiO5 in the middle layer and TiO2 as the outer layer (shell) which was formed in the anatase phase. These 3 layers had a very strong mechanical resistance and had not undergone any deformity in strenuous, acidic, alkalin and thermal conditions; other particles had nearly kept their equality.
The doping procedure of iron in the outer layer causes an increase in the performance of the catalyst in alkaline media and when T, TA, and TFA catalysts reach their minimum performance levels, the FTA catalyst shows a very high performance.
The core-shell catalyst samples of TA, TFA and FTA showed a high mechanical resistance in recycling levels compared to the T catalyst. The catalyst sample of FTA had the highest recyclability up to more than 10 times.
In conclusion, the ultimate outcome of this project was synthesis of FTA core-shell photocatalyst with a high mechanical resistance in alkaline media, in conditions at which TiO2 was practically inactive. Considering the other catalysts, being economically cost effective due to reduced TiO2 consumption per grams of catalyst and having high mechanical resistance in chemical reactions were the other outcomes of this research.
Conflict of Interest
All the rights of this article are related to the authors and there is no conflict of interest.
Refrence
- Celik, E.; Keskin, I.; Kayatekin, I.; AK Azem, F.; O¨zkan, E. Materials Characterization 2007, 58,349–357.
CrossRef - Karunakaran, C.; Magasan, P.; Gomathisankar, P.; Vinayagamoorthy, P. Superlattices and Microstructures 2015, 83,659-667.
CrossRef - Lee, S. W.; Paraguay-Delgado, F.; Arizabalo, R.D.; Gómez, R.; Rodríguez-González, V. Materials Letters 2013, 107, 10–13.
CrossRef - Mohammadi, M.R. Mater Sci Semicon Proc. 2014, 27,711–718.
CrossRef - Yang, M.; Long, J.; Qiu, K.; Liu, S. J. Sol-Gel Sci Technol 2015, volume 75 issue 2, 475-480.
CrossRef - Yao, L. H.; Li, Y. X. ; Zhao, J.; Ji, W. J. Au, C. T. Catalysis Today 2010, 158, 401–408.
CrossRef - Fang, Q. and Liang, X. RSC Advances 2012, 2, 5370-5375.
CrossRef - Vetrivel, V.; Rajendran, K.; Kalaiselvi, V. International Journal of Chem Tech Research 2015, vol.7, No.3, 1090-1097.
- Khleel, A.; Nawaz, M.; Al-Hadrami, S.; Greish, Y.; Tareq, S. Microporous and Mesoporous Materials 2013, 168, 7-14.
CrossRef - Tang, W. J.; Fu, Z.Y.; Zhang, J.Y.; Wang, W.M.; Wang, H.; Wang, Y.C.; Zhang, Q.J. Powder Technology 2006, 167,117–123.
CrossRef - Xu, Z.; Zhao, H.; Wei, Y.; Zheng, C. Combustion and Flame 2015, 162, 8, 3030-3045.
CrossRef - Wilson Anku, W.; Bonsu Oppong, S. O.; Shukla, S. K.; Govender, P. P. Acta Chim. Slov. 2016, 63, 380-391.
CrossRef - Moradi, S.; Aberomand- Azar, P.; Raeis-Farshid, S.; Abedini- Khorrami, S.; Givianrad, M.H. J.Saudi Chem Soci 2016, volume 20 issue 4, 373-378.
CrossRef - Moradi Dehaghi, S.; Mobtaker, H.G.; Ahmadi, S.J. and Aberomand Azar, P. Fersenius Enviromental Bulletin 2012, volume 21No 12b, 1-7.
- Nozari, M.; Moradi Dehaghi, S. Fresenius Enviromental Bulletin 2015, 24(108), 3505-3514.
- Song, H.; Gong, J.; Lin Song, H..; Li, F.; Zhang, J.; Guang Chen, Y. Catalysis Communications 2016, 85, 1-4.
CrossRef - Vargas, A.; Montoya, J.A.; Maldonado, C.; Hernadez-perez, I.; Acosta, D. R.; Morales, J. Microporous and Mesoporous Materials 2004, 74,1-10.
CrossRef - Khodadadi, B.; sabeti, M.; Nahri-Niknafs, B.; Moradi-Dehaghi, S.; Aberomand Azar, P.; Raeis-Farshid, S. Bulgarian Chemical Communications 2014, volume 46, Number 3, 624-628.
- Wang, S.; Li, X.; Wang, S.; Li, Y.; Zhai, Y. Materials-Letters 2008, 62, 3552-3554.
CrossRef - Rauf, M.A.; Meetani, M.A.; Khleel, A.; Ahmed, A. Chemical Engineering Journal 2010, 157, 373–378.
CrossRef

This work is licensed under a Creative Commons Attribution 4.0 International License.
![]()
A New Edition of Web of Science
Journal Impact Factor
2022: 0.5
Five Year: 0.8
Journal is Indexed in

Cabells Whitelist
![]()


