Removal of Ammonia Nitrogen NH-N and Hexavalent Chromium (VI) From Wastewater Using Agricultural Waste Activated Carbon
Iqbal Khalaf Erabee1,2
1Department of Civil Engineering, University of Thi-Qar, Iraq.
2Department of Civil Engineering, University Putra Malaysia, 43400 UPM Serdang, Selangor, Malaysia.
Corresponding Author E-mail: iqbalkhalaf77@gmail.com
DOI : http://dx.doi.org/10.13005/ojc/340254
Article Received on : January 04, 2018
Article Accepted on : February 28, 2018
Highly porosity characterized activated carbon (AC) was achieved using agricultural waste as raw material used as adsorbent to treat wastewater through removal of ammonia nitrogen (NH-N) and hexavalent chromium (Cr (VI). The preparation method of AC included using zinc chloride as activation agent. Characterizations of the porosities of AC preparations were performed using N2 adsorption-desorption to ascertain surface area and pore volume. Existing groups on the AC surfaces were resolved using Fourier Transform Infrared Spectroscopy (FTIR) analyses. Scanning electron microscopic (SEM) was used to asses AC morphologies. Maximal surface areas of AC preparations were discovered to be 1190.41 m2/g at activation temperatures of 700oC. Adsorption isotherm was analyzed using two models Langmuir and Freundlich. The kinetic study was represented through Pseudo first order and pseudo second order.
KEYWORDS:Activated Carbon; Agricultural Waste; Adsorption; Wastewater
Download this article as:| Copy the following to cite this article: Erabee I. K. Removal of Ammonia Nitrogen NH-N and Hexavalent Chromium (VI) From Wastewater Using Agricultural Waste Activated Carbon. Orient J Chem 2018;34(2). |
| Copy the following to cite this URL: Erabee I. K. Removal of Ammonia Nitrogen NH-N and Hexavalent Chromium (VI) From Wastewater Using Agricultural Waste Activated Carbon. Orient J Chem 2018;34(2). Available from: http://www.orientjchem.org/?p=44828 |
Introduction
Environmental conservation protection takes a great consideration over the years in all all over world, especially the protection of water from pollution. One of the most toxic pollutants in wastewater which affect human healthy is the high concentration of hexavalent chromium and ammonia nitrogen. Previous studies showed that high concentration of ammonia nitrogen is inhibit the biological degradation by the microorganis1,2. Hexavalent form of chromium is toxic and is suspected to be carcinogenic. It affects the kidney and liver and causes dermatitis, diarrhea3. For these reasons, its important to treat wastewater effluent before discharging it to environmenta. Various technologies have been investigated for treatment of wastewater including physical and chemical methods, ion exchange, electrochemical treatment (Erabee et al., 2017a). Membrane separation and AC adsorption4. Adsorption onto AC has several advantages over other water treatment methods, primarily as a very simple technology and more efficient in removing high molecular weight compounds from aqueous matrix (Erabee et al., 2017b). Nowadays, good source for AC preparation is agricultural material because of low cost and availability5 (Erabee et al., 2017c). The most widely used precursor for production of AC is jute and coconut fibre6, apricot stone7, coconut husk8, and rice husk9. This study aimed to treat sample of wastewater by producing low cost adsorbent with high porosity for removal of ammonia nitrogen and hexavalent chromium. Also, to study the equilibrium and kinetic mechanism of NH-N and Cr (VI) adsorption onto the prepared activated carbon, and to identify characteristics of prepared activated carbon including functional groups and surface area.
Experimental
Analysis of Sample Solution
The waste water that used in this study was collected from Mini STP (Sewage Treatment Plant) at faculty of engineering in University Putra Malaysia (UPM) which is located at Selangor state in Malaysia. The sample of wastewater is followed by laboratory testing in order to evaluate levels of organic and inorganic contaminates based on the Examination of Water and Wastewater methods. Table (1) shows the parameters limits of sample and effluent of Standard B which stated in the Sewage and Industrial Effluents Regulations 1979 by Department of Environmental Malaysia.
The measuring of PH, TDS, salinity and electrical conductivity were made using Tracer Pocket tester (Code:1766, LaMotte, Taiwan). TSS of the sample was determined by pouring a well-mixed sample (20 ml) through a pre weighted filter paper that was mounted on a vacuum filtration apparatus. A standard laboratory procedure was used to measure COD and BOD of sample. In testing the turbidity a multi-detector optical turbid meter was used. For measuring NH-N and heavy metals a multi-detector optical colorimeter (Hach DR/890 Colorimeter).
Table 1: Initial characteristics of raw wastewater sample
| Parameters | Unit | Value | Malaysian Standards* |
| pH | – | 7.11 | 5.5 – 9.0 |
| TDS | ppm | 270 | – |
| TSS | mg/L | 1050 | 100 |
| Salinity | ppm | 330 | – |
| Turbidity | NTU | 276 | – |
| Electric conductivity | μS/cm | 688 | – |
| COD | mg/L | 470 | 100 |
| BOD | mg/L | 135 | 50 |
| NH₃-N | mg/L | 65 | |
| Zn | mg/L | 0.1 | 1.0 |
| Cr (VI) | mg/L | 70 | 0.05 |
| Mn | mg/L | 0.1 | 1.0 |
*Sewage and Industrial Effluents (Standards B), 1979, DOE Malaysia.
Preparation of AC
Garden waste, which is the small branching of trees, collected from the agricultural waste of UPM gardens. These garden waste is used as a raw material for the AC preparation. Washed and cleaned raw materials were crushed and grinded to small particles (0.3-0.6 mm) and dried in at 100°C for 24 h 10 g of the dried sample was carbonized at 300°C for 4 h using electric tubular furnace at a rate of 10°C/min. and under continuous 100 ml/min. N2 flow. After carbonization, the sample was mixed with chemical activation agent of ZnCl2 at impregnation ratio of 1.5/1 (weight of ZnCl2/ weight of precursor, w/w) for 12 h, then dried heated at activation temperatures of 700°C. Holding time at final temperature was 1 hours. Hot distilled water was used for washing the resulted sample after cooling until neutral PH. The sample was dried at 100°C for 24 h and stored in desiccator.
Characterization of Activated Carbon
SEM analysis was used to indicate textural morphology of prepared AC. Chemical functional groups of activated carbon were identify using Fourier transform infrared spectroscopy (FTIR) in the scanning range of 400-4000 cm-1. The surface properties was characterized with Micrometrics ASAP 2020, using adsorption of N at 77 k.
Batch Adsorption study
In this test, different adsorbent doses (1, 2, 3, 4 and 5 g/L) of AC prepared from garden waste (AC-GW) were mixed with 100 mL volume of electrolyzed leachate sample. Incubation of the conical flasks was at room temperature, then agitated at 200 rpm using a mechanical shaker (Orbital Shaker, 100-240 VAC, HS4010A), Different retention times at 30, 60, 90, 120, 180, 240, 300, and 360 min. respectively, were employed.
The following formula is used to evaluate the removal efficiencies10.
Where C0 initial concentration, Ce concentration at time t.
Ascertainment of AC’s sorption capacity was done by calculating using following equation.
Where m adsorbent mass and V volume of leachate sample.
Adsorption Equilibrium Isotherms
Equilibrium adsorption study was analysed using two models Langmuir and Freundlich as follows.
Where KL (L/mg) and qm (mg/g) are represent energy of adsorption and adsorption capacity, respectively. The constant qm and KL are characteristics of the Langmuir equation which can be determined from the slope and intercept of the plot Ce/qe against Ce. The equilibrium parameter RL can be found from the following equation:
Unfavourable adsorption was assumed when RL>1, while linear adsorption at RL =1, favourable (0< RL<1), and irreversible when RL= 0.
Adsorption Kinetic Study
Pseudo first order and pseudo second order models were used to represent kinetic study, as follows.
Pseudo first order Model
Integral form of pseudo first order equation was indicated in the following equation11.
Where
qe (mg/g) is the amount of adsorbate at the equilibrium, qt(mg/g) is the amount of adsorbate at time t (min.), respectively and k1(L/min.) is the rate constant. The adsorption rate constant, K1, can be calculated by plotting Log (qe – qt) versus t.
Pseudo-Second Order Model
Linearized integral form of pseudo second order kinetic model is represented as
where qe and qt(mg/g) are the amount of adsorbate at the equilibrium and at time t (min.), respectively k is the pseudo-second order rate constant of adsorption (g/mg.min). K2 and qe can be obtained from the intercept and slope by plotting t/qt versus t.
Results and Discussion
AC Characterizations
The nitrogen adsorption isotherms are used to obtain the surface physical parameters which were indicated in Table 1. The surface area, pore volume, micropore surface area and micropore volume of AC-GW was 1190.41 m²/g, 0.43 cm³/g, 568.752 m²/g and 0.299 cm³/g, respectively. Fig. 1 presents the surface chemistry of the prepared AC with ZnCl2 activation. The FTIR of AC illustrated simple surface chemistry, the band at 3361 cm-1 is due to the presence of N-H stretching. The shorted peak at 2314 cm-1 was attributed to presence of C-N stretching. The broad peak between 1673 cm-1 to 1544 cm-1 is a result of the N–H bond.
Table 2: Porosity characteristics of prepared AC
| Properties | Value |
| Surface area | 1190.41 m²/g |
| Pore volume | 0.430 cm³/g |
| Micropore surface area | 568.752 m²/g |
| Micropore volume | 0.299 cm³/g |
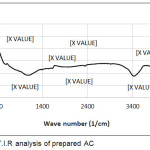 |
Figure 1: F.T.I.R analysis of prepared AC |
SEM test used to perform surface morphology of AC-GW as shown in Fig. 2. Its clear from the figure that well-developed porous in the surface of prepared AC which were considered as channels to microporous network.
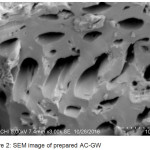 |
Figure 2: SEM image of prepared AC-GW |
Batch Adsorption Process
Effect of contact time and Adsorbent Dose on Removal Efficiencies of Parameters
The adsorption process was done using prepared activated carbon made from Sago palm bark. The final concentration of NH-N and Cr (VI) were analyzed after different intervals of contact time (30, 60, 90, 120, 180, 240 and 300 min.). Fig. 3 and 4 illustrate the effect of contact time and adsorbent dose of AC-GW in the removal efficiencies of NH-N and Cr (VI). Different adsorbent doses 1, 2, 3, 4 and 5 g/L of AC-GW were used to adsorb contaminates from the sample at different contact time intervals from 30 to 360 minutes. It is clear from the Figure that the removal efficiencies of parameters were increased with increasing of contact time and reach the maximum removal percentages after 180 min. of contact time. NH-N and Cr (VI) have their optimum removal efficiencies with 5g/L adsorbent dose and contact times from 30 to 360 minutes. Maximum RE for NH-N as shown in Fig. 3, are 85, 88, 91, 92, 90, 92 %, respectively. Maximum RE for Cr (VI), as shown in Fig. 4, are 83, 86, 87, 91, 93, 91, 93 and 93%, respectively.
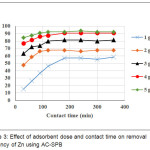 |
Figure 3: Effect of adsorbent dose and contact time on removal efficiency of Zn using AC-SPB
|
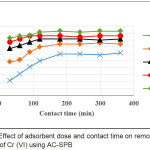 |
Figure 4: Effect of adsorbent dose and contact time on removal efficiency of Cr (VI) using AC-SPB
|
As a result, the removal efficiencies of NH-N and Cr (VI) increased with increasing of contact time due to the active sites abundance on the surface of adsorbent12,13. The slow removal capacity with the subsequent time may be due to the diffusion of heavy metal ions onto the surface of AC and fewer binding sites14. The same results were conducted by Kyzas15 who concluded that the end of adsorption was at 180 minutes. Babel and Kurniawan16 observed that removal efficiency increased with an increase in contact time. The adsorbent dose is strongly effected removal percentage in adsorption process17. From Fig. 3 and 4, it can be observed that removal efficiencies of NH-N and Cr(VI) improved with increasing adsorbent doses due to availability of more adsorption sites18.
Maximum removal percentages were obtained at 5 mg/L adsorbent dose and 180 min. of contact time for all different dosages of parameters. These results were noted as optimum conditions for subsequent studies.
Equilibrium Adsorption Models
The adsorption Langmuir isotherm for NH-N is represented in Fig. 5. The Langmuir constants and their correlation coefficients R2 for adsorption of NH-N and Cr (VI) via AC-GW, are listed in Table 2. For NH-N, the value of RL is 0.0015 which indicates favorable adsorption of NH-N using AC-GW. Fig. 6 shows Freundlich isotherm for NH-N removal by AC-GW at 3 h of contact time. The Feundlich isotherm constant (KF and n) and their correlation coefficients R2 are summarized in Table 2. The value of n for Freundlich isotherm for NH-N is equal to 1.883, represent moderately good adsorption between 1-219. The results showed that the Freundlich isotherm model better fits the experimental data.
The Langmuir adsorption isotherm for Cr (VI) by AC-GW was shown in Fig. 7. Value of RL equal to 0.001 as determined in Table 2 and correlation coefficient is equal to 0.870.
While Freundlich adsorption isotherm for Cr (VI), as in Fig. 7, showed that high correlation coefficient (0.992) with value of n (1.137) between 1 and 2, and represented good adsorption. From the results, the Freundlich isotherm of Cr (VI) better fits to experimental data than Langmuir isotherm.
Table 2a: Langmuir and Freundlich isotherms parameters
| Parameters |
NH₃-N |
Cr (VI) |
| Langmuir | ||
| KL(L/g) |
10.453 |
14.232 |
| RL |
0.0015 |
0.001 |
| qm (mg/g) |
3.61 |
3.268 |
| R2 |
0.893 |
0.870 |
| Freundlich | ||
| KF |
5.211 |
2.163 |
| 1/n |
0.531 |
0.879 |
| R2 |
0.821 |
0.992 |
Kinetic Adsorption Models
Figures 5 and 6 show the plots of the first order model of NH-N and Cr (VI) adsorption, respectively.
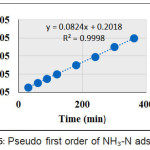 |
Figure 5: Pseudo first order of NH-N adsorption |
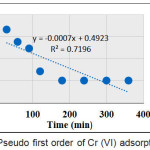 |
Figure 6: Pseudo first order of Cr(VI) adsorption |
Figure 7 show the plots of the second order models for adsorption of NH-N and Cr (VI), respectively.
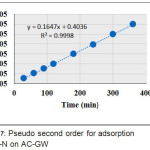 |
Figure 7: Pseudo second order for adsorption of NH-N on AC-GW |
Tables 3 and 4 show Pseud first order and pseudo second order parameters of NH-N and Cr (VI), respectively, on AC-GW. The correlation coefficients (R2) values of pseudo first order were found to be 0.858 and 0.719, respectively, for NH-N and Cr (VI), respectively. While pseudo second order model demonstrated much linearity
Table 3: Pseudo first order parameters
|
Parameter |
K1 | qe (mg/g) | R2 |
| NH-N | 0.0039 | 1.949 | 0.858 |
| Cr (VI) | 0.00161 | 3.111 |
0.719 |
Table 4: Pseudo second order parameters
| Parameter | K2 | qe (mg/g) | R2 | Qe (exp.) (mg/g) |
| NH-N | 0.0333 | 12.195 | 0.999 | 12 |
| Cr (VI) | 0.0149 | 13.227 | 0.999 | 13 |
Comparison of Adsorption Capacity of Prepared AC with Different Precursors
Table 5 and 6 show the comparison of agreement recording R2 are equal to 0.999 and 0.999, for NH-N and Cr (VI), respectively. The higher correlation coefficient and predicated values of qe which were in agreement with the corresponding experimental values, it was suitable to describe the kinetic adsorption process of NH-N and Cr(VI), respectively.
Table 5: Comparison of removal efficiencies of NH3-N using different adsorbents
| AC-Precursor | PH | initial concentration (mg/L) | Adsorbent dose (g/L) | Removal (%) | Source |
| Nigerian waste bamboo | 6.67 | 58.7 | 123.5 | 80.4 | 20 |
| Coconut shell | 7 | 1890.95 | 5 | 35 | 21 |
| Sugarcane bagasse | 8.3 | 1113.2 | 50 | 41 | 22 |
| Garden waste | 7.11 | 65 | 5 | 92 | Present study |
Table 6: Comparison of removal efficiencies of Cr (VI) using different adsorbents
| AC-Precursor | PH | initial Concentration (mg/L) | Adsorbent dose (g/L) | Removal (%) | Source |
| Jatropha husk | 2 | 10 | 60 | 61 | 23 |
| Coconut shell charcal | 4 | 20 | 12 | 85 | 16 |
| Commercial coconut shell | 4 | 20 | 6 | 90 | 16 |
| Tamarind wood | 5.68 | 10 | 2 | 99 | 24 |
| Trapa natans husk | 6 | 10 | 1.5 | 94.6 | 14 |
| Eichornia crassipes root | 4.5 | 100 | 10 | 92.24 | 25 |
| Peanut shell | 4 | 30 | 0.1 | 46.63 | 26 |
| Modified activated carbon | 2 | 30 | 1 | 50.6 | 27 |
| Rice husk | 2 | 100 | 0.2 | 94 | 28 |
| Powder activated carbon | 2 | 10 | 2 | 95.84 | 29 |
| Mango kernel | 2 | 20 | 10 | 100 | 30 |
| Garden waste | 7.11 | 70 | 5 | 93 | Present study |
Conclusion
The treatment of wastewater was examined using agricultural waste collected from garden waste activated carbon assisted adsorption process. The porosity characterizations of prepared activated carbon indicated that garden waste is good adsorbent due to its highly surface porosity and effective precursor for adsorption of pollutants from wastewater such as NH-N and Cr(VI). The results illustrated that the Freundlich isotherm of NH-N and Cr(VI) better fits to experimental data. Kinetic adsorption study shows pseudo second order model was suitable to describe the kinetic adsorption process of NH-N and Cr(VI) onto AC-GW. The removal efficiencies of NH-N and Cr (VI) using AC-GW were found to be equal 92 and 93%, respectively.
Acknowledgements
The support of Ministry of Higher Education and Scientific Research in Iraq is acknowledged.
References
- Amokrane, A., Comel, C., Veron, J.,Water Resources, 1997. 31 (11), 2775-2782.
- Li, X.Z., Zhao, Q.L., and Hao, X.D., Waste Management, 1999. 19, 409-415.
CrossRef - Mohan Jr., D., and Pitman, C.U. Journal of Hazardous materials, 2006. 137, 762-811.
CrossRef - Wang, H., Yuan, X., Wu, Y., Huang, H., Zeng, G., Liu, Y., Wang, X., Lin, N., and Qi, Y. Appl. Surf. Sci., 2013. 279, 432-440, doi:http://dx.doi.org/10.1016/j.apsusc.2013.04.133.
CrossRef - Li, W., Peng, J., Zhang, L., Yang, K., Xia, H., Zhang, S., and Guo, S.-h. Waste management, 2009. 29(2), 756-760.
- Phan, N. H., Rio, S., Faur, C., Le Coq, L., Le Cloirec, P., and Nguyen, T. H., Carbon, 2006. 44(12), 2569-2577.
CrossRef - Sentorun-Shalaby, C., Ucak-Astarlioglu, M.G., Artok, L., and Sarici, C. Microporous and Mesoporous Materials, 2006. 88 (1), 126-134.
CrossRef - Tan, I.A.W., Ahmad, A.L., and Hameed, B.H., Journal of Hazardous Materials, 2008. 153, 709-717. doi:10.1016/j.jhazmat.2007.09.014
CrossRef - Bishnoi N.R., Bajaj M., Sharma N., and Gupta A. Bioresources Technology, 2004. 91(3), 305-317.
CrossRef - Daneshvar, N., Oladegaragoze, A. and Djafarzadeh, N., J. of Hazard. Mater., 2006. B129, 116 – 122.
CrossRef - Ho, Y.S., Scientometrics, 2004. 59, 171-177.
CrossRef - Aroua, M.K., Leong, S.P.p., Teo, L.Y., Yin, C.Y., and Daud, W.M.A.W. Bioresources Technology, 2008. 99, 5786.
CrossRef - Wu, Y. Zhang, S., Guo, X., and Huang, H., Bioresources Technology, 2008. 99, 7709.
CrossRef - Li, Y. Du, Q. Wang, X., Zhang, P., Wang, D., and Wang, Z. J. of Hazard. Mat. 2010. 183, 583.
- Kyzas, G.Z., Deliyanni, E.A., and Matis, K.A., Colloids and Surfaces A. 2016. 490, 74-83. http://dx.doi.org/10.1016/j.colsurfa.2015.11.038
CrossRef - Babel S., and Kurniawan T.A., Chemosphere, 2004. 54 (7), 954-967.
CrossRef - Pab, S., Radonic, J., Trifunovic, S., Adamovic, D., Mihajlovic, I., Miloradov, M.S., and Sekulic, M.T., J. of Environ. Mang., 2016. 184, 297-306.
CrossRef - Mall, I.D., Srivastava, V.C., and Agarw al, N.K., Dyes and Pigments, 2006. 69 (3), 210-223.
CrossRef - Aksu, Z., Acikel, U., and Kutsal, T., Separation Science and Technology, 1999. 34, 501-524.
CrossRef - Ademiluyi, F.T., Amadi, S.A., Amakama, N.J, J. of Appl. Sci. and Envion., Manag. 2009. 13 (3).
- Halim, A.A., Aziz, H.A., Johari, M.A.M., and Ariffin, K.S., Desalination, 2010a. 262, 31–35.
CrossRef - Azmi, N., Bashir, M.J.K., Sethupathi, S., Wei, L.J., and Aun, N.C., J. of Enviro. Chemical Eng., 2015. 3, 1287-1294.http:/dx.doi.org/10.1016/j.jece.2014.12.002
CrossRef - Namasivayam C., Sangeetha D., and Gunasekaran R., Process Safety and Environmental Protection, 2007. 85 (2), 181-184.
CrossRef - Acharya, J., Sahu, J.N., Sahoo, B.K., Mohanty, C.R., and Meikap, B.C. Chemical Engineering Journal, 2009. 150, 25-39, DOI:10.1016/j.cej.2008.11.035
CrossRef - Giri, A.K., Patel, R., and Mandal, S., Chem. Eng. J., 2012. 185-186, 71-81. DOI:10.1016/j.cej.2012.01.025
CrossRef - AL-Othman, Z.A., Ali, R., Naushad, M. Chemical Engineering Journal, 2012.184, 238-247. DOI:10.1016/j.cej.2012.01.048
CrossRef - Karnib, M., Kabbani, A., Holail, H., and Olama, Z., Energy Procedia, 2014. 50, 113-120. DOI:10.1016/j.egypro.2014.06.014
CrossRef - Sugashini, S., and Begum, K.M. New Carbon Materials, 2015. 30(3), 252-261.DOI:10.1016/S1872-5805(15)60190-1
CrossRef - Huang, M., Wang, Z., and Liu, S., J. of Environ. Chem. Eng., 2016. 4, 1555, 1560. http://dx.doi.org/10.1016/j.jece.2016.02.019
CrossRef - Rai, M.K., Shahi, G., Meena, V., Meena, R., Chakraborty, S., Singh, R.S., and Rai, B.N., Resource – Efficient Technologies, 2016. 2, 63-70. http://dx.doi.org/10.1016/j.reffit.2016.11.011
CrossRef - Erabee IK, Ahsan A, Jose B, Arunkumar T, Sathyamurthy R, Daud NNN, Idrus S. “Effects of electric potential, NaCl, pH and distance between electrodes on efficiency of electrolysis in landfill leachate treatment”. Journal of Environmental Science and Health (Part A)., 2017a, 52(8),735-741, http:// dx. doi.org/10.1080/10934529.2017.1303309.
CrossRef - Erabee IK, Ahsan A, Jose B, Aziz MMA, Ng AWM, Idrus S, Daud NNN . “Adsorptive treatment of landfill leachate using activated carbon modified with three different methods”. KSCE Journal of Civil Engineering, 2017b, 22(4), 1-13, https:// doi.org/10.1007/s12205-017-1430-z.
- Erabee IK, Ahsan A, Daud NNN, Idrus S, Shams S, Md Din MF, Rezania S. “Manufacture of low-cost activated carbon using sago palm bark and date pits by physiochemical activation”. BioResources, 2017c, 12(1), 1916-1923. http://dx.doi.org/ 10.15376/biores.12.1.1916-1923.
CrossRef

This work is licensed under a Creative Commons Attribution 4.0 International License.
![]()
A New Edition of Web of Science
Journal Impact Factor
2022: 0.5
Five Year: 0.8
Journal is Indexed in

Cabells Whitelist
![]()


