Investigation of Electrochemical Behaviour of Chromium(VI)-Dithiocarbamate Complexes: Detection of Chromium(VI) in Real Samples
Niranjan Thondavada1, Giridhar Chembeti2, Gan. G. Redhi1 and Venkatasubba Naidu Nuthalapati2
1Department of Chemistry, Durban University of Technology, P.O. Box 1334, Durban 4000, South Africa.
2Department of Chemistry, Sri Venkateswara University, Tirupati-517502, Andhra Pradesh, India.
Corresponding Author E-mail: niranjan994@gmail.com
DOI : http://dx.doi.org/10.13005/ojc/340209
Article Received on : December 09, 2017
Article Accepted on : January 31, 2018
A facile, rapid and sensitive catalytic hydrogen signal method has been developed for the analysis of chromium(VI) using two new ligands Ammonium N-phenylpiperazine-1-carbodithioate (APP-CDT) and Ammonium N-benzylpiperidine-1- carbodithioate (ABP-CDT) were synthesized. The method was depending on the reaction of chromium(VI) with APP-CDT and ABP-CDT at pH 8.6 and 7.8 respectively in supporting electrolyte (NH4Cl-NH4OH) medium. The resulting oxidation peaks were obtained at -1.68V and -1.60 V vs SCE respectively, due to the catalytic hydrogen signals (CHS’s). Different experimental conditions such as pH effects, background electrolyte (NH4Cl-NH4OH) effects and carbodithioate (CDT) and chromium(VI) ion effects were studied. The present technique was successfully used to detect chromium(VI) in several environmental, biological samples. It was demonstrated that the obtained recovery percentages (95-99%) were comparable to the Atomic Absorption Spectrophotometry (AAS) method.
KEYWORDS:D.C. Polarography; chromium(VI); catalytic hydrogen signals (CHS’s); Ammonium N-phenylpiperazine-1-carbodithioate (APP-CDT) and Ammonium N-benzylpiperidine-1- carbodithioate (ABP-CDT)
Download this article as:| Copy the following to cite this article: Thondavada N, Chembeti G, Redhi G. G, Nuthalapati V. N. Investigation of Electrochemical Behaviour of Chromium(VI)-Dithiocarbamate Complexes: Detection of Chromium(VI) in Real Samples. Orient J Chem 2018;34(2). |
| Copy the following to cite this URL: Thondavada N, Chembeti G, Redhi G. G, Nuthalapati V. N. Investigation of Electrochemical Behaviour of Chromium(VI)-Dithiocarbamate Complexes: Detection of Chromium(VI) in Real Samples. Orient J Chem 2018;34(2). Available from: http://www.orientjchem.org/?p=44815 |
Introduction
Generally, chromium exists in nature as chromium(VI) and chromium(III), and its valence state in natural water depends on the presence of organic matter and oxygen content [1]. The chromium(VI) species are well-known to be noxious and give rise various healthiness problems [2]. The literature reports suggest that the Cr(VI) compounds are more noxious than Cr(III) compounds [3]. The salts of chromium are widely adopted in industries, resulted in the water pollution. Large amounts of chromium is expected to enter into environment from leather, steel and chrome-plating industries. In drinking water, tolerance limits of chromium is found to be 50 μg L-1 and therefore, it is appraised to be toxic and of great concern when found beyond its acceptable limits [4].
Different analytical methods such as inductively coupled plasma-mass spectroscopy [5], inductively coupled plasma-atomic emission spectroscopy [6], electroanalytical [7], nuclear and spectroscopy [8-10] have been determined for the detection of chromium(VI). However, the above reported methods are sensitive, but relatively expensive and require specialized technicians to operate the instruments. The current catalytic hydrogen signals of Cr(VI)-thiocompound compounds were testified for waste water, industrial run-offs and agrarian resources from these research laboratory [11-18] and the equipment’s used are existing in maximum research laboratories. This paper deals with the development of a sensitive, cost-effective catalytic hydrogen signals technique for the detection of chromium(VI). The method was performed by two new reagents namely, Ammonium N-phenylpiperazine-1-carbodithioate (APPC-DTC) and Ammonium N-benzylpiperidine-1- carbodithioate (ABPC-DTC) which gives CHSs with the metal-carbodithioate complexes at ambient conditions. The attained results were equated with Atomic Absorption Spectrophotometry (AAS).
Materials and Methods
Instrumentation
Direct current polarography, model CL-357 and Cl-25 were used in this study (Elico Private Ltd, Hyderabad, India). The Shimadzu AA 6300 spectrometer equipped with a hollow cathode lamp and a deuterium background corrector, at respective wavelengths (resonance line) using an air acetylene flame was used. The instrumental parameters were those recommended by the manufacturer.
Reagents
The chemicals like NH3, CS2, NH4Cl, 1-phenylpiperazine and 4-benzylpiperidine were obtained from SD Fine chemicals, India. The preparation of chromium(VI) stock solution (1 μg mL-1) was performed by taking 3.928 g L-1 of CuSO4.2H2O and it was dissolved in millipore water then made up to the mark in one litre flask. Preparation of APP-CDT / ABP-CDT (0.01 M) by taking 2.55/2.67 g and then dissolved it in 100 mL millipore water. Standard ligands and supporting electrolyte solutions were freshly prepared and it was stored at 4oC.
Synthesis of APP-CDT and ABP-CDT
40 g of carbon disulphide (CS2) was steadily mixed with 45 g of 1-phenylpiperazine/4-benzylpiperidine dissolved in 25 mL deionized water at 4oC with constant agitation. Then 0.1 N NH4OH was slowly added into the reaction mixture to achieve neutralization. The final white coloured solid was collected and purified by repeated washing with acetone (Scheme 1a-b) [19-26].
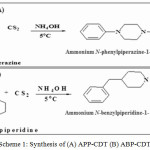 |
Scheme 1: Synthesis of (A) APP-CDT (B) ABP-CDT |
Experimental Procedure
In a 100 mL beaker measured volumes of NH4Cl-NH4OH, ligands (APP-CDT and ABP-CDT) and then metal solutions were added. By using 0.1 M HCl and NaOH, the desired pH was altered and then poured into the polarographic cell. Pure nitrogen gas (99.9 %) was passed through the solution for about fifteen min to take away the amount of oxygen present in the sample solution. Lastly, the polarograms were documented by means of the D.C. Polarography technique (Figure-1).
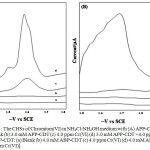 |
Figure 1: The CHSs of Chromium(VI) in NH4Cl-NH4OH medium with (A) APP-CDT: |
(a) Blank (b) 3.0 mM APP-CDT (c) 4.0 ppm Cr(VI) (d) 3.0 mM APP-CDT +4.0 ppm Cr(VI), (B) ABP-CDT: (a) Blank (b) 4.0 mM ABP-CDT (c) 4.0 ppm Cr(VI) (d) 4.0 mM ABP-CDT +4.0 ppm Cr(VI)].
Results and Discussion
In this section, various experimental conditions were optimized to detect chromium(VI) at DME.
pH Effect
The pH effect on CHSs was performed by generating the polarograms at different pH’s ranging from 5.0-10.0, retain the chromium(VI) and ligands concentration at 4.0 ppm and 0.4/0.5 M respectively in supporting electrolyte medium. The wave shape continued to be unaffected, however, the peak steadily goes-up till pH values of 8.6/7.8 (APP-CDT/ABP-CDT) and after reaching these pH values peak goes-down. Therefore, maximum pH values were chosen as ideal for further studies. With increase in pH, the peak potential moved to words negative scale as illustrated in Figure 2.
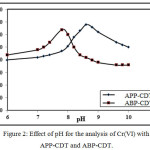 |
Figure 2: Effect of pH for the analysis of Cr(VI) with APP-CDT and ABP-CDT.
|
Supporting Electrolyte Effect(NH4Cl-NH4OH)
This study was performed by adjusting the supporting electrolyte concentration from 0.05-1.0 M keeping 4.0 ppm Cr(VI) ion and 3.0/4.0 APP-CDT/ABP-CDT constant at pH 8.6/7.8 respectively. Peak increased till the concentration reaches 0.4/0.5 M NH4Cl for APP-CDT/ABP-CDT, but decreased beyond these concentrations. Consequently, these values were chosen as ideal for further studies as illustrated in Figure 3.
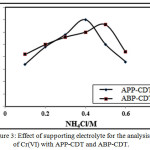 |
Figure 3: Effect of supporting electrolyte for the analysis of Cr(VI) with APP-CDT and ABP-CDT.
|
Effect of Reagents Concentration
The impact of reagents concentration of APP-CDT/ABP-CDT on the catalytic peaks of Cr(VI)-DTC were studied using different concentrations ranging from 0.2 mM to 6.0 mM. Remarkably, it was noticed that height of the peak increased till 3.0/4.0 mM (APP-CDT/ABP-CDT). Therefore, the maximum peaks obtained at 3.0/4.0 mM (APP-CDT/ABP-CDT), and with excess addition of CDT, the peak was not proportionate to the concentration of the ligands. On increasing the concentration of carbodithioate, peak potential attracts towards more negative. The differences of peak height as a function of concentration of CDT is not stating the typical nature of CHSs [27]. The maximum peak shape is indicatory of adsorption [28-30] (Figure 4). The not sequential portion of a curve from Langmuir adsorption isotherm, and the plot of {[Carbodithioate] /iP} vs [Carbodithioate] is a straight line (Figure 5), indicating the nature of CHSs.
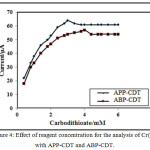 |
Figure 4: Effect of reagent concentration for the analysis of Cr(VI) with APP-CDT and ABP-CDT. |
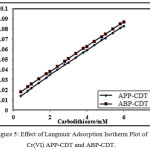 |
Figure 5: Effect of Langmuir Adsorption Isotherm Plot of Cr(VI) APP-CDT and ABP-CDT.
|
Effect of Mercury pressure on Peak Height
The effect of pressure of mercury in the reservoir on the peak height was studied at different mercury column heights. As the column height (h) of the mercury reservoir is increased peak height and are marginally decreased where is the average catalytic current. The diminish of the peak height with the rise in mercury reservoir is characteristic of CHSs [32] as illustrated in Table 1.
Table 1: Effect of mercury pressure for the analysis of chromium (VI) APP-CDT and ABP-CDT.
|
S.No |
Maximum suppressor/% |
Current/μA |
|
|
APP-CDT |
ABP-CDT |
||
| Gelatin | |||
|
1 |
0.000 |
62.10 |
54.55 |
|
2 |
0.005 |
54.54 |
54.32 |
|
3 |
0.010 |
47.20 |
47.10 |
| Trition X-100 | |||
|
1 |
0.000 |
61.20 |
57.54 |
|
2 |
0.002 |
55.64 |
49.52 |
|
3 |
0.004 |
53.86 |
46.42 |
Effect of Maximum Suppressors on Peak Height
The gelatine and Triton X-100 effects ranging from 0.005 to 0.01% and 0.002 to 0.004% was performed on the nature analyte signal in NH4Cl-NH4OH buffer in the presence of CDT. The peak height was reduced (20%) by adding 0.005% gelatine with slight decrease in peak height. However, increase in the gelatine concentration, the peak potential shifts towards less negative. By adding 0.002% Triton X-100 the CHSs were decreased by 10%. Beyond 0.002% of Triton X-100, the CHSs reduced marginally in both cases, suggesting the catalytic nature of the signals [33, 34] as illustrated in Table.2.
Table 2: Effect of maximum suppressors for the analysis of chromium(VI) APP-CDT and ABP-CDT.
|
S.No |
Height of the mercury column/cm |
APP-CDT |
ABP-CDT |
||
|
Current/μA |
/μA |
Current/μA |
/μA |
||
|
1 |
22 |
60.15 |
14.264 |
55.20 |
12.247 |
|
2 |
27 |
59.55 |
12.483 |
53.65 |
10.851 |
|
3 |
32 |
59.85 |
11.492 |
52.10 |
9.806 |
|
4 |
37 |
58.60 |
10.322 |
51.35 |
8.169 |
Effect ofTemperature on Peak Height
The temperature effect was performed at various temperature ranging from 15-40oC. It was found that CHSs increased with the temperature, however the temperature coefficient values decrease until 30oC whilst ic becomes temperature independent beyond 30oC [30].
Effect of Chromium (VI) Concentration on Peak Height
The effect of concentration of chromium (VI) was carried out by varying 0.05-5.0 ppm for APP-CDT and ABP-CDT respectively. The CHSs increased proportionately with chromium (VI). The linear bond attained within the CHSs and metal ion concentration in a limited range (Figure 6) is as predicted the nature of CHSs [31],and explored the feasibility of detection of chromium(VI) in ultra-micro levels.
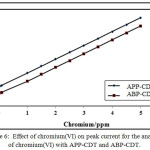 |
Figure 6: Effect of chromium(VI) on peak current for the analysis of chromium(VI) with APP-CDT and ABP-CDT. Click here to View figure |
Effect of Foreign Ions on the Detection of Cr(VI)
Different metal ions effect on chromium (VI) was carried out based on the CHSs. The CHSs of the mixture comprising 4.0 ppm Cr(VI), in 0.4/0.5 M NH4Cl at pH 8.6/7.8 for two ligands (3.0/4.0 mM APP-CDT/ABP-CDT) as bonding agents. Metal ions such as Fe2+, Co2+, Ni2+, Mn2+, Cu2+, V5+ in 100 fold excess were recorded. Interestingly, it was found that Co2+ oxidized to Co3+ by atmospheric oxygen was separated by bubbling of N2 gas and triggered with CDTs. The resulted solid was removed and filtrate was polarographed after nitrogen gas bubbling. On the other hand, V5+ slightly interfered then disguised by addition of 2 ml 1% sodium fluoride solution. Similarly, Ni2+ also precipitate in the pH range of Cr(VI)- CDT systems. The excipient effect with other metals namely, Cd2+, Hg2+, Pb2+, Al3+, Ag+, U6+, Se4+, Te+4, Ce4+, Sn4+ and Mo6+ was studied. Amongst these metal ions, only Mo6+ enormously interfered as the CHSs of Mo6+ was attained even in the nonappearance of CDT. The remarks were alike for two ligands. The other ions such as bromide, fluoride, tartrate, iodide, phosphate, thiosulphate, citrate, perchlorate and sulphate do not impede with the CHSs of chromium(VI)- CDT system. Though, carbonate and EDTA affect gravely by suppressing the CHSs of Cr(VI) as per they give rise to strong complexes with the metal ion. Nitrite and nitrate give CHSs with Cr(VI) in the absence of CDT also.
Effect of Indifferent Cations
The indifferent cations effect was verified at fixed pH, ligand and chromium (VI) and NH4Cl–NH4OH concentrations. In this study, sodium, alkali chlorides, lithium and calcium were used. The existence of these ions reduces the CHSs as shown in Figures 7-8. The obtained results suggested that the calcium has stronger supressing effect on the CHSs compared to other ions. The CHSs drops constantly with increase in chloride ions concentration. The sodium chloride effect was lower than potassium chloride, with lithium chloride and calcium chloride peak height decrease highly. In all cases, with increase in chloride concentration potential of the CHSs shifted to more negative potentials. The decrease in CHSs due to indifferent ions suggested the adsorption properties of chromium(VI)-CDT complexes on the electrode surface [30, 32].
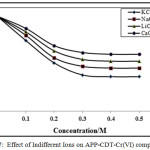 |
Figure 7: Effect of Indifferent Ions on APP-CDT-Cr(VI) complex |
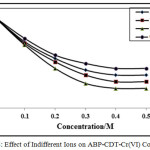 |
Figure 8: Effect of Indifferent Ions on ABP-CDT-Cr(VI) Complex |
Real Sample Applications
This technique is adopted to analysis chromium(VI) in various environmental, biological and agricultural matrices. In this study, 1 L of each environmental samples were brought from steel alloy industries situated at Gajulamandyam, Chittoor District, India. The leather wastewater was sampled from tanning industries located near to Chennai, India. All the samples were prior concentrated to 100 ml for easy detection of analyte. The obtained results are tabulated in Tables 3-4. 10 g of Triticum aestivum (Wheat) and 5 g of Spinacia oleracea (Palaku) brought from vegetable market, Tirupati, Chittoor District and were processed by using dry method. The attained results are presented in Tables 5-6.
Table 3: Analysis of chromium(VI) with APP-CDT in industrial runoffs around Tirupati, (Industrial Estate) Chittoor District, A.P. India.
|
Samplea |
Cr(VI) Added/ppm |
CHSs method (DC polarography) |
AAS method |
||
|
APP-CDT |
APP-CDT |
||||
|
Cr(VI) Found/ ppm |
%Recovery (R.S.Db) |
Cr(VI) Found/ppm |
%Recovery (R.S.Db) |
||
|
I |
0.8 |
1.596 |
98.47(2.89) |
1.582 |
99.24(1.92) |
|
0.8 |
1.615 |
98.14(2.30) |
1.604 |
97.96(2.28) |
|
|
0.8 |
1.584 |
99.20(2.17) |
1.584 |
98.52(2.26) |
|
|
II |
0.8 |
1.596 |
99.35(2.11) |
1.582 |
100.21(1.28) |
|
0.8 |
1.592 |
98.75(2.28) |
1.592 |
98.35(2.45) |
|
|
0.8 |
1.582 |
97.54(2.52) |
1.575 |
97.66(2.58) |
|
|
III |
0.8 |
1.588 |
99.10(1.94) |
1.596 |
99.75(2.33) |
|
0.8 |
1.592 |
97.93(2.94) |
1.582 |
98.20(2.64) |
|
|
0.8 |
1.585 |
98.49(2.61) |
1.595 |
100.50(1.28) |
|
a5 ml of the sample is used, bRSD (n=6)
I-Upper India Steel Ltd; II-Pioneer Alloy Casting Ltd; III- S.K.S Alloy Casting Ltd.
Table 4: Analysis of Chromium(VI) with ABP-CDT in industrial runoffs around Tirupati, (Industrial Estate) Chittoor District, A.P. India.
|
Samplea |
Cr(VI) Added/ppm |
CHSs method (DC polarography) |
AAS method |
||
|
ABP-CDT |
ABP-CDT |
||||
|
Cr(VI) Found/ppm |
%Recovery (R.S.Db) |
Cr(VI) Found/ppm |
%Recovery (R.S.Db) |
||
|
I |
0.8 |
1.486 |
97.85(2.34) |
1.624 |
97.84(1.97) |
|
0.8 |
1.495 |
98.64(2.65) |
1.587 |
99.36(2.10) |
|
|
0.8 |
1.526 |
98.95(2.42) |
1.579 |
98.25(2.15) |
|
|
II |
0.8 |
1.568 |
99.10(1.25) |
1.604 |
99.56 (1.55) |
|
0.8 |
1.542 |
99.50(1.90) |
1.596 |
98.92(2.46) |
|
|
0.8 |
1.582 |
98.55(1.25) |
1.628 |
97.92(1.95) |
|
|
III |
0.8 |
1.586 |
98.10(2.24) |
1.578 |
99.64(2.26) |
|
0.8 |
1.595 |
97.82(2.36) |
1.582 |
98.49(1.89) |
|
|
0.8 |
1.594 |
100.15(1.45) |
1.592 |
97.82(1.96) |
|
a5 ml of the sample is used, bRSD(n=6)
I-Upper India Steel Ltd; II-Pioneer Alloy Casting Ltd; III-S.K.S Alloy Casting Ltd.
Table 5: Analysis of Chromium(VI) with APP-CDT in agricultural materials around Tirupati, Chittoor District, A.P. India.
|
Samplea |
Cr(VI) Added/ppm |
CHSs method (DC polarography) |
AAS method |
||
|
APP-CDT |
APP-CDT |
||||
|
Cr(VI) Found/ppm |
%Recovery (R.S.Db) |
Cr (VI) Found/ppm |
%Recovery (R.S.Db) |
||
|
I |
1.0 |
2.04 |
100.12(1.86) |
1.92 |
98.95(2.18) |
|
1.0 |
1.97 |
99.62(1.92) |
1.87 |
98.65(2.42) |
|
|
1.0 |
1.85 |
98.54(2.46) |
1.94 |
98.58(2.16) |
|
|
II |
1.0 |
1.96 |
99.18(1.95) |
2.08 |
100.15(2.28) |
|
1.0 |
1.89 |
98.45(2.36) |
1.87 |
98.91(1.72) |
|
|
1.0 |
1.88 |
98.36(2.24) |
2.05 |
100.26(1.84) |
|
a 5 ml of the sample is used, bRSD(n=6)
I –Triticum aestivum (Wheat); II- Spinacia oleracea (Palaku)
Table 6: Analysis of Chromium(VI) with ABP-CDT in agricultural materials around Tirupati, Chittoor District, A.P. India.
|
Samplea |
Cr(VI) Added/ppm |
CHSs method (DC polarography) |
AAS method |
||
|
ABP-CDT |
ABP-CDT |
||||
|
Cr(VI) Found/ppm |
%Recovery (R.S.Db) |
Cr(VI) Found/ppm |
%Recovery (R.S.Db) |
||
|
I |
1.0 |
1.94 |
98.10(2.45) |
1.99 |
99.00(2.35) |
|
1.0 |
1.99 |
99.89(1.96) |
1.97 |
98.25(2.28) |
|
|
1.0 |
2.15 |
100.15(1.82) |
1.98 |
97.95(2.12) |
|
|
II |
1.0 |
1.97 |
98.45(2.36) |
1.95 |
98.35(2.54) |
|
1.0 |
1.89 |
98.74(2.35) |
1.96 |
99.20(2.38) |
|
|
1.0 |
2.04 |
100.05(1.84) |
1.98 |
99.24(2.16) |
|
a5 ml of the sample is used, bRSD(n=6)
I-Triticum aestivum (wheat); II-Spinacia oleracea (Palaku)
In a crucible, samples of milk were dropped slowly and heated for one hour at 450 -500oC, without frothing moisture was vaporised. The ash collected was liquefied in 3 mL conc. HNO3 and evaporated, and again liquified in the 3 mL of dilute HNO3. The obtained samples were filtered and diluted to 25 mL in a flask for future experiments. These samples were used to investigate chromium(VI) and results are presented in Table.7.
Table 7: Analysis of Chromium(VI) with APP-CDT and ABP-CDT in cow’s milk
|
Cow’s Milk |
Cr (VI) Added/ppm |
Cr(VI)Found in samples, ppm* |
|||
|
CHSs method (DC Polarography) |
AAS Method |
||||
|
APP-CDT |
ABP-CDT |
APP-CDT |
ABP-CDT |
||
|
1. |
1.0 |
1.11(1.628) |
1.13(1.532) |
1.14(1.642) |
1.13(1.684) |
|
2. |
1.0 |
1.14(1.515) |
1.09(1.715) |
1.12(1.524) |
1.10(1.588) |
|
3. |
1.0 |
1.12(1.843) |
1.11(1.418) |
1.12(1.846) |
1.10(1.617) |
|
4. |
1.0 |
1.15(1.494) |
1.159(1.662) |
1.16(1.482) |
1.13(1.489) |
|
5. |
1.0 |
1.12(1.734) |
1.14(1.483) |
1.14(1.742) |
1.11(1.585) |
|
6. |
1.0 |
1.10(1.559) |
1.12(1.813) |
1.13(1.542) |
1.12(1.8480 |
|
7. |
1.0 |
1.13(1.746) |
1.14(1.449) |
1.14(1.710) |
1.16(1.463) |
|
8. |
1.0 |
1.11(1.722) |
1.16(1.682) |
1.12(1.749) |
1.15(1.632) |
|
9. |
1.0 |
1.15(1.416) |
1.15(1.496) |
1.16(1.397) |
1.14(1.448) |
|
10. |
1.0 |
1.10(1.821) |
1.12(1.773) |
1.13(1.827) |
1.13(1.747) |
1 ml of the sample is used
*RSD for 5 individual determinations
Conclusions
A reliable, sensitive and reproducible CHSs method was established to detect chromium (VI), outcomes of this study illustrated that chromium(VI) gives CHSs from Metal-CDT complexes. The sequential dependency of CHSs on various parameters such as CDT’s concentration and pH, suggested the catalytic nature of the signals and involvement of adsorption process. The variation of CHSs with as a function of mercury reservoir height and chromium(VI) also indicated the characteristics feature of catalytic signals. It was demonstrated that the data fitted well into Langmuir adsorption isotherm curve. It was concluded that by using CHSs method, chromium(VI) detection is selective and reproducible.
References
- Madec, F. C.; Analytica Chimica Acta. 1992, 257, 301-308.
CrossRef - Barrera-Diaz, C. E.; Lugo-Lugo, V.; Bilyeuc, B.; J. Hazard. Mater. 2012, 223.
- Kaltz, S. A.; Salem, H J.; J. Appl. Toxicol. 1993, 13, 217.
CrossRef - De, A. K.; Environmental Chemistry, 4th ed. New Age International, New Delhi. 2000, 229.
- Skrzydlewska. E.; Balcerzak. M.; Vanhaecke, F.; Analytica chimica Acta. 2003. 191, 191-202.
CrossRef - Oktor. K.; Yilmaz, S.; Turker, G.; Erkus, E.; Environ. Monit. Assess. 2008, 141, 97-103.
CrossRef - Dominguez, O.; Arcos, M.; J. Anal. Chim. Acta. 2002, 470, 241-52.
CrossRef - Narayana, B.; Cherian, T.; J. Bruz. Chem. Soc. 2005, 16(2), 197-101.
- Martiez-Gallegos.; Bulbulian. S,S,; J. Radioanal. Nucl. Chem. 2005, 266(2), 285-287.
- Tiglea, P.; Lichtig, J. Anal. Lett. 2000, 33(8), 1615-24.
CrossRef - Saraswathi, K.; Santha, K.; Meena Kumari, K.; J, Analyst. 1990, 115.
- Saraswathi, K.; Yamuna, K.; Emmanuel, K. A.; J. Electroche Soc. India. 1990, 39 122.
- Saraswathi, K.; Emmanuel, K. A.; Yamuna, K.; Bull. Electrochem. 1990, 6(12), 953.
- Saraswathi, K.; Yamuna, K.; Emmanuel, K. A.; Proc. Indian Acad. Sci. 1991, 103(2), 185.
- Saraswathi, K.; Prasad, B,; Naidu, N. V. S.; Transactions of the SAEST. 2004, 16(3) 403.
- Saraswathi, K.; Yamuna, K.; J. Electrochem Soc. India. 1992, 41(2), 135.
- Saraswathi, K.; Proc. Indian Acad. Sci. 1977, 85, 514.
- Krishnaiah, N.; Varaprasad, A.; Naidu, N. V. S.; Saraswathi, K.; J.Ind. Chem. Soc. 2008, 85, 455.
- Kanchi, S.; Krishnamurthy, P.; Saraswathi K.; Venkatasubba Naidu, N.; Chem. Techn: An Ind. J. 2011, 6(1), 6.
- Kanchi, S.; Niranjan, T.; Saraswathi K.; Venkatasubba Naidu, N.; Anal. Chem: An Ind. J. 2011, 10(4), 231.
- Kanchi, S.; Sulochana, M.; Babu Naidu, K.; Saraswathi, K.; Venkatasubba Naidu, N.; Food Anal. Method. 2011, 4(4), 453.
CrossRef - Kanchi, S.; Singh, P.; Sabela, M.I.; Bisetty K.; Venkatasubba Naidu, N.; Int. J. Electrochem. Sci. 2013, 8, 4260.
- Kanchi, S.; Anuradha, P.; Kumar, B. N.; Gopalakrishnam K.; Ravi, P.; Arabian J. Chem. DOI 10.1013/i.arabjc.2012.08.01, 2012, (Inpress).
- Kanchi, S.; Singh P.; Bisetty, K.; Arabian J. Chem, 2014, 7, 11.
CrossRef - Kanchi, S.; Sabela, M.I.; Singh P.; Bisetty, K.; Arabian J. Chem. 10,S2260-S2272, 2017.
CrossRef - Niranjan, T.; Kanchi, S.; Bisetty K.; Venkatasubba Naidu, N. Asian J. Chem. 2015, 27(10), 3598.
CrossRef - Krishnaiah, N.; Varaprasad, A.; Naidu, N. V. S.; Saraswathi, k.; J. Ind. Chem. Soc. 2008, 85, 455.
- Kanchi, S.; Sulochana, M.; Babu Naidu, K.; Saraswathi, K.; Venkatasubba Naidu, N.; Food Analytical methods. 2011, 4(4), 453-464,
CrossRef - Saritha, N.; Niranjan, T.; Venkata subba Naidu, N.; Saraswathi, K.; IJCPS, 2014, 2(4), 752-759,
- Lundell, G.E.F.; Hoffman, J.I.; Bright, W.A.; John Wiley and sons, New York 1931.
- Meites, L.; Interscience Publishers, Inc., New York 1955, 78-82.
- Mader, P.; Kolthoff, I.M.; Vesela, V.; Electrochimica Acta. 1982, 27, 1393.
CrossRef - Reilly, C.N.; Stumm, W.; Vol I. edited by Zuman, P.; Kolthoff I. M.; Interscience Publishers, Inc.1962.
- Calusaru, A.; Electrochimica Acta. 1972, 17, 213.
CrossRef

This work is licensed under a Creative Commons Attribution 4.0 International License.
![]()
A New Edition of Web of Science
Journal Impact Factor
2022: 0.5
Five Year: 0.8
Journal is Indexed in

Cabells Whitelist
![]()


