Green Chemiluminescence of Highly Fluorescent Symmetrical Azo-Based Luminol Derivative
Simon Deepa1, Sabbasani Rajasekhara Reddy2 and Kannapiran Rajendrakumar1
1Chemistry Division, School of Advanced Sciences, VIT University, Chennai campus.600-127, Tamil nadu India
2Department of Chemistry, School of Advanced Sciences, VIT University, Vellore campus,632-014,Tamil nadu, India.
Corresponding Author E-mail: rajendrakumar.k@vit.ac.in
DOI : http://dx.doi.org/10.13005/ojc/340238
Article Received on : November 26, 2017
Article Accepted on : January 20, 2018
A symmetrical azo-based Luminol derivative 2 was synthesized using catalytic dehydrogenative coupling reaction procedure. This symmetrical molecule shows blue fluorescence in polar aprotic solvents (λmax = 450 nm). With an increase in aqueous content 2 was exhibiting aggregation caused fluorescence quenching (ACQ) with a red shift of 30 nm (λmax = 480 nm). Distinct emission features were observed for this molecule with a variation in the pH range. In basic medium, deprotonated form of 2 shows fluorescence quenching followed by enhancement of green chemiluminescence (λmax = 490 nm) with H2O2/Fe3+catalytic system. The fluorescence and chemiluminescent (CL) properties of 2 were compared with its parent luminol 1, The CL emission intensity of 2 was found to be about 16 times higher than that of 1. In addition, HOMO-LUMO energy gap for 2 was also calculated using density functional theory (DFT) studies.
KEYWORDS:Luminol; Azo-derivative; Fluorescent; Hydrogen peroxide; Green Chemiluminescence
Download this article as:| Copy the following to cite this article: Deepa S, Reddy S. R, Rajendrakumar K. Green Chemiluminescence of Highly Fluorescent Symmetrical Azo-Based Luminol Derivative. Orient J Chem 2018;34(2). |
| Copy the following to cite this URL: Deepa S, Reddy S. R, Rajendrakumar K. Green Chemiluminescence of Highly Fluorescent Symmetrical Azo-Based Luminol Derivative. Orient J Chem 2018;34(2). Available from: http://www.orientjchem.org/?p=44750 |
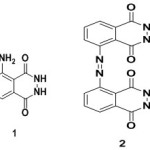
Introduction Luminol 1 is a classic chemiluminescent (CL) reagent 1 first reported by Albrecht in 1928 2 , extensively used for different analytical applications3,4 The basic solution of Luminol exhibits a striking blue glow when mixed with an oxidizing agent and an Iron catalyst.1 Various luminol derivatives were reported with an intention to improve emission properties.5-8 Luminol derivatives with electron-releasing substituents show red shift with an enhancement of were CL quantum yield.9-14 and White et al., have synthesized alkyl derivatives of luminol to maximize the CL (λmax=410 nm) quantum yield.12 While substitution of amino or methoxy groups on luminol increases its CL intensity13, electron withdrawing substituents like chloro and nitro groups make it non fluorescent.9-14 Zaitsu et al.,have synthesized N-(4-substituted benzyl) isoluminol with substituents like,4-bromo,4-methoxy and 4-nitro groups.The chemiluminescent intensities of these compounds were 0.03-4.7 times that of luminol.12 Naphthalene analogues of luminol have an extended aromaticity which leads to green chemiluminescence (λmax=490 to 550nm).15 It is Noteworthy to mention that green chemiluminescence in longer wavelength region is of great interest for biological applications.16 The increase of aromaticity leads to a redshift with a green CL. Balaban et al., have synthesized5-(azo-para-phenylene-N-aza-15-crown-5)-phthalhydrazide, an azo derivative of Luminol17 which shows a weak fluorescence but a significant chemiluminescence at 425 nm. But the chemiluminescent emission was found around 425 nm similar only to its parent luminol. Another azo derivative of luminol, phthalhydrazide-5-azo-2-naphthol, synthesized by coupling diazotized 5-aminophthalhydrazide with 2-naphthol which shows fluorescence at 350 nm.18 This derivative was used to complex with metal ions, but chemiluminescent studies were not reported. Reddy et al., have reported the synthesis of a series of symmetrical azobenzenes from various aromatic amines using Cu(I) catalyzed dehydrogenative homocoupling using mild reaction conditions.19-20 The catalytic system employed was Cu(I)Br along with DMAP (Dimethylamino pyridine) and AIBN (Azobisisobutyronitrile). Luminol 1 is also basically an aromatic amine with a phthalhydrazide group. Dehydrogenative homo coupling of luminol would also result in a symmetrical azo product of luminol, which is actually a dimer with an extended conjugation between two luminol units through an azo link 2.To the best of our knowledge, this kind of homocoupling of luminol was not known. So we have decided to synthesize a symmetrical luminol derivative with an objective to increase the CL intensity and a significant red shift. In the present work, we have performed the homo coupling of 1 and optimized the conditions for a maximum yield. Azobenzene and its derivatives are commonly used as dyes and fluorescent materials. Linking chemiluminescent luminol units through an azo group would also result in interesting fluorescent properties through the short and compact π-conjugated structure. The presence of two phthalhydrazide groups guarantee its chemiluminescent nature, which can be taken advantage for applications like biosensing.
 |
Scheme 1a Click here to View scheme |
Experimental Materials Luminol(99%),Copper(I)Bromide(99%),Azobisisobutyronitrile(AIBN),(98%)and 4-Dimethylaminopyridine (DMAP) (99%) were purchased from Sigma-Aldrich and used as received. Potassium ferricynaide K3[Fe(CN)6],(97%) Hydrogen peroxide (H2O2)(30%),Sodium Hydroxide (NaOH) was purchased from Merck Dimethyl sulfoxide (DMSO) (98%.), Dimethylformamide (DMF) (97%), Ethyl acetate (97%),Tetrahydrofuran(THF) (98%) Hexane (96%), were purchased from Merck and vacumm distilled before further used. Methods Thin-layer chromatography (TLC) was performed using Merck silica gel 60 F254 precoated plates (0.25 mm) and visualized by UV fluorescence lamp. Silica gel (particle size 100-200 mesh) purchased from Merck, was used for chromatography. 1H NMR spectra were recorded on a Bruker 400 MHz instrument. Spectra were reported relative to DMSO-d6 residual peak (δ 2.5 ppm). 13C 100 MHz NMR were reported relative to DMSO-d6 (δ 40.16 ppm).The first-order peak patterns are indicated as s (singlet), d (doublet), dd (doublet of doublet), t (triplet), q (quadruplet), and m (multiplet). UV-Visible spectra were recorded on Perkin Elmer spectrophotometer (Model: Lambda 35).Chemiluminescence spectra were recorded by Jasco spectrofluorometer instrument (Model: F8300). Density functional theory calculations were carried out with B3LYP level using Gaussian 09 program. Synthesis of Compound 2 Compound 2 was synthesized according to the procedure earlier reported by Reddy et al.,19-20Accurately weighed Luminol (250 mg, 1.0 mmol) was taken in a dry 100 ml two necked round bottom flask followed by the addition of 4-Dimethyl aminopyridine (DMAP) (150 mg, 1.2 mmol), Copper (1)Bromide (Cu(I)Br) (14.3 mg, 0.10 mmol) and Azobisisobutyronitrile (AIBN) (50 mg, 0.3 mmol) under an inert atmosphere condition. To these contents, 3 ml of DMF was added. The reaction mixture was allowed to stir under inert conditions for a period of 7 hours at 50°C, after which the reaction mass, was filtered. The filtrate obtained was concentrated under high vacuum and the resultant sticky crude product was purified using column chromatography (silica gel, hexane/ethyl acetate,85/15 as an eluent). The product was obtained in a pure form as a yellow colour solid in 92% of isolated yield and its structure was established using various analytical techniques. 1H NMR (400 MHz, DMSO-d6, TMS) 6.90 (1H, d); 6.95 (1H, d); 7.42 (1H, t)13C NMR (100 MHz, DMSO-D6, TMS) δ (ppm): 162.97; 152.72 ; 134.41 :129.70128.56: 126.13; 125.63 ppm. HRMS was calculated for C16H10N6O4 (M+): 350.08.Found: 351.17 (M+1).
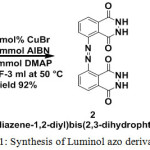 |
Scheme 1: Synthesis of Luminol azo derivative |
General procedure for the Absorbance, Fluorescence and Chemiluminescence (CL) Studies 1 (1.8×10⁻⁵M) was dissolved in DMF whereas 2 (2.5×10⁻⁵ M) was dissolved in various solvents like DMF, DMSO, Ethyl acetate and THF. For CL studies, both 2 (2.5×10⁻⁵ M) and 1 (1.8×10⁻⁵M) were dissolved in DMF. 2 mL of these solutions were taken in a quartz cuvette, followed by addition of 100μL of potassium ferricyanide (1.8 ×10⁻⁵M) in 9μM sodium hydroxide solution. To initiate CL reaction, H2O2 (1-9μM) was added to the this solution.Solutions of same concentrations were used for all absorbance, fluorescence and CL spectroscopic studies unless otherwise specified. General procedure for calculating Density functional theory studies Density functional theory calculations were carried out with B3LYP level using Gaussian 09 program. The dihedral angle (Φ) between the plane of the optimized energy structure is found to be ∼ 50° The Frontier molecular orbitals of compound 2 obtained from DFT calculations. Results and Discussion In the earlier work by Reddy et al, homocoupling of simple and substituted aromatic amines at ambient temperature under mild conditions was reported 19-20. Luminol is a basic aromatic amine with a phthalhydrazide group. Following the mentioned reported procedure dehydrogenative homocoupling of luminol 1 was done using the catalytic system. The catalytic system employed was 10 mol% CuBr, 0.3 mmol of AIBN and1.2 mmol of DMAP at room temperature as well as 50° C which resulted in 2, a symmetric molecule 2 (Table.1) has two phthalhydrazide groups which can produce chemiluminescence as like the parent luminol molecule. The yield of coupling product was less when reactions were performed at room temperature.(Entries1,4,6 ).To increase the yield slightly higher temperature a 50°C was used with DMF(Entries.2).The yield of the desired coupling product 2 was 92%.At higher temperature of 80°C (Entry.3) the yield was not found to be increasing (72%).At this stage it was almost confirming the better activity of the catalytic system only at 50°C.The reaction was also performed in DMSO at ambient temperature(Entry.4) as well as (Entry.5)50°C.The yield was higher at 50°C (83%) compared to room temperature (27%) but still lower than that in DMF(Entry.2).The reaction was also performed in acetonitrile at ambient temperature (Entry.6) and 50°C (Entry.7) as well as DCM at 50°C (Entry.8). Only with the DMF solvent, the highest conversion was obtained. Table 1: Experimental Optimizing conditions for dehydrogenative homocoupling of Luminol to Compound 2.
| Entry | Metal Catalyst | Solvent | Temperature(°C) | Time (hr) | % Yield | |||
| 1. | Cu(I)Br | DMF | RT | 8 | 20 | |||
| 2. | Cu(I)Br | DMF | 50 | 7 | 92 | |||
| 3. | Cu(I)Br | DMF | 80 | 7 | 72 | |||
| 4. | Cu(I)Br | DMSO | RT | 8 | 27 | |||
| 5. | Cu(I)Br | DMSO | 50 | 7 | 83 | |||
| 6. | Cu(I)Br | ACN | RT | 8 | 17 | |||
| 7. | Cu(I)Br | ACN | 50 | 7 | 79 | |||
| 8. | Cu(I)Br | DCM | 50 | 7 | 46 | |||
All the reactions were carried out using 1.2 mmol of DMAP, 10 mol% catalysts, 0.3 mmol of AIBN The product 2 is symmetrical and shows fluorescence because of the extended conjugation as two phthalhydrazide groups are also present, it is obvious to expect chemiluminescence also. 2 was found to be highly soluble in polar solvents like DMF, DMSO, Ethyl acetate and THF. These solutions were fluorescent with varying intensities. Compared with 2, the parent luminol molecule was found to be non-fluorescent when dissolved in DMF. (Figure.1.black background under UV lamp). Solutions of 2 with various solvents were prepared and the absorption and fluorescence spectra were recorded using these solutions. The absorption spectra of 2 in different solvents are given in (Figure.2) Compared with parent luminol (DMF), the absorbance maxima of 2 shows red shifted due to the increase in conjugation. 1 shows two absorption bands at 300nm and 350 nm due to π–π* transitions.2 shows two absorption bands one in the wavelength range of 250-300 nm due to π–π* transitions of aromatic group and a shoulder in the range of 300-390 nm which is due to π –π* transitions of –N=N- group with all solvents. The intensity of absorption spectra was found to be varying in accordance with the dipole moment of the solvents employed.21 High dipole moment, solvents like DMSO (ε =46.7) and DMF, (ε = 36.7), compound 2 show two bands at 262 nm and 275 nm due to π-π* transitions of aromatic groups and another shoulder at 385 nm and 370 nm correspond to the azo group.21-22 Insolvents with low dipole moments like THF (ε 32.7) and Ethyl acetate (ε = 6.02), 2 show two absorption band with a λmax at 253 and a shoulder at 315, 253 and 375 nm respectively which is evident for negative solvatochromism. This type of observation may be due to more polarisation of 2 in polar solvents with a highdipolemoment.
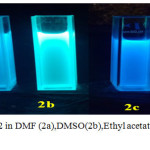 |
Figure 1: Luminol (in DMF) and 2 in DMF (2a),DMSO(2b),Ethyl acetate(2c),THF(2d) under UV at 365 nm. |
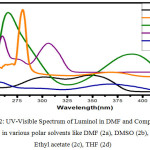 |
Figure 2: UV-Visible Spectrum of Luminol in DMF and Compound 2 in various polar solvents like DMF (2a), DMSO (2b), Ethyl acetate (2c), THF (2d) |
The compound 2, is a symmetrical homocoupling product of Luminol and was found to be highly fluorescent in polar solvents. Compared with parent luminol, 2 shows blue fluorescence with a λmax at 458 nm in DMF (Figure.3). In other polar solvents like DMSO, Ethyl acetate, and THF, maximum fluorescence was found at 467,445 and 449nm respectively.(Figure.4) A clear redshift was noticed in DMSO. This may be due to the intermolecular charge transfer taking place between the solvents and compound 2 and also the compound 2 is more polar in the excited state 21. In Ethyl acetate a blue fluorescence with a λmax at 445 nm. (Figure.4).which is due the negative solvatochromism appeared in compound 2. In less dipole moment solvent like Ethyl acetate (ε=6.02) and THF (ε=7.02) compound 2 is freely rotating which leads to a blueshift.21-22 Self-aggregation is a well known phenomenon among the azo dyes caused due to hydrophobic and/or vanderwaals forces, which results in fluorescence quenching, prevalently called as aggregation caused quenching (ACQ)23 which affect its development as a solid-state fluorescent materials.
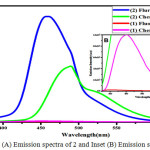 |
Figure 3: (A) Emission spectra of 2 and Inset (B) Emission spectra of 1. |
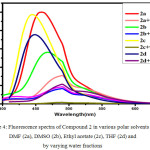 |
Figure 4: Fluorescence spectra of Compound 2 in various polar solvents like DMF (2a), DMSO (2b), Ethyl acetate (2c), THF (2d) and by varying water fractions |
The symmetric luminol azo derivative 2 was also expected to show ACQ. Compound 2 in their respective solvents were prepared. By varying the proportion of water 10-90% v/v using these solutions the Fluorescence spectra were recorded.(Figure.4) With an increase in water content the fluorescence bands got in different solvents gets quenched and also get red shifted to 480 nm. In aqueous media the intramolecular rotations are limited due to the formation of aggregates (ACQ) which block the radiative excitations getting the molecule quenched.24 In the case of 2a/water, 2b/water mixtures fluorescence intensity of 2 gradually decreases with an increase in water upto 10-40% v/v. Further increase in the percentage of water to 50%v/v, ACQ breaks quenched intensity of the fluorescence band gets improved. (Figure.5 & 6 ). But furthermore addition of water from 60%-90% v/v results in a gradual quenching of fluorescence. So for all other studies like effect of pH and CL emission 50%v/v DMF-water mixture of 2 was used. In Ethyl acetate and THF also the fluorescence intensity of 2 gradually decreased with the increase in the water fraction (10-90%) and got redshifted to 480 nm. (Figure.7 & 8).
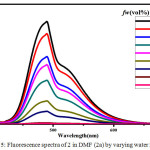 |
Figure 5: Fluorescence spectra of 2 in DMF (2a) by varying water fractions. |
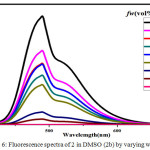 |
Figure 6: Fluorescence spectra of 2 in DMSO (2b) by varying water fractions. Click here to View figure |
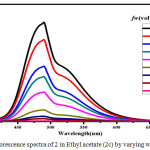 |
Figure 7: Fluorescence spectra of 2 in Ethyl acetate (2c) by varying water fractions. Click here to View figure |
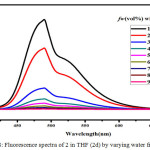 |
Figure 8: Fluorescence spectra of 2 in THF (2d) by varying water fractions. |
A solution of 2 was adjusted to the required pH using sodium phosphate buffer solution. Using this solution, absorption and fluorescence spectra were recorded. The effect of pH on absorption and fluorescence spectra of 2 are shown in Figure 9 & 10. The absorption spectra of 2 in lower pH 4 show one prominent band at 280 nm and a shoulder at 380 nm. In neutral pH, the absorption band shows two prominent bands at 280 and 390 nm similar to luminol. In an alkaline pH 9, three bands were observed with the λmax=280 nm,340 and 360 nm.The fluorescence spectra of 2 at lower pH 4 gave a single band with λmax = 445 nm with a decrease in intensity compared to the band in neutral medium this may be due to the protonation of one nitrogen atom of azo chromophore Scheme.2 (I). There was no change in the structural and electronic environment of solution 225 in neutral pH, which was confirmed by a prominent peak at 450 nm Scheme.2(II) In an alkaline pH 9 the fluorescence spectra with a λmax=477 nm which is due to the anion formed by the deprotonation of the phthalhydrazide groups in 2 Scheme.2 (III).This symmetrical luminol azo derivative 2 exhibits CL with only molecular oxygen and base in aprotic solvents like DMF and DMSO a phenomenon similar to the parent luminol molecule 6-8,26 The addition of base in an aprotic solvent to 2 produces a spectral red shift to 477 (Figure.10) nm and a quenching effect in fluorescence intensity.
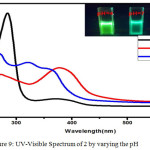 |
Figure 9: UV-Visible Spectrum of 2 by varying the pH |
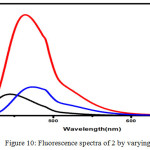 |
Figure 10: Fluorescence spectra of 2 by varying pH Click here to View figure |
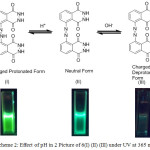 |
Scheme 2: Effect of pH in 2 Picture of 6(I) (II) (III) under UV at 365 nm |
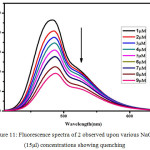 |
Figure 11: Fluorescence spectra of 2 observed upon various NaOH (15μl) concentrations showing quenching |
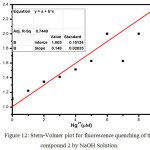 |
Figure 12: Stern-Volmer plot for fluorescence quenching of the compound 2 by NaOH Solution. |
White et al6-8., have proposed CL studies of Luminol in aprotic solvents like Dimethylsulfoxide (DMSO), Dimethylformamide (DMF) exhibiting the CL with presence of oxygen and based without a need for peroxide/catalyst system. In those solvents, the CL reactions relatively free of complications and amino phthalate ion have been identified as the products of the reaction6-8,26 The fluorescence quenching behavior of compound 2 was studied in DMF and NaOH Solution. To the solution of 2 in DMF taken in a quartz cuvette (1-9μM) NaOH solution was added and the fluorescence spectra were recorded. With the increase in the concentration of NaOH, fluorescence intensity was found to be decreasing. (Figure.11).In aprotic solvents like DMSO, DMF base like NaOH are not solvated and can exhibit their intrinsic basicity. But in aqueous solutions the base is not strong enough to remove the proton in both 1 and 2 because of the levelling effect of water. Formation of dianion is responsible for the initiation of the CL in both 1 and 2 . Increasing the aqueous of NaOH content solution in aprotic solvents like DMF,DMSO with compound 2 considerably reduce the concentration of dianion by shifting the λmax = 480 nm and quenches its fluorescence intensity. Fluorescence quenching is quantitatively measured with the Stern–Volmer equation equation: F0/F = KSV [Q] + 1 Where KSV represents Stern–Volmer constants indicating the sensitivity of the quenching effects of compound 2. F0 and F are the fluorescence intensities before and after the addition of the analytes, and [Q] is the molar concentration of the analyte. Figure.12 shows the Stern-Volmer plot for quenching effect in OH– ion in compound 2. KSV Value was calculated as 2.8×10⁵ M-1. This suggested that the dynamic nature of quenching process playing a role in higher quencher concentration.
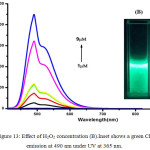 |
Figure 13: Effect of H2O2 concentration (B).Inset shows a green CL emission at 490 nm under UV at 365 nm. |
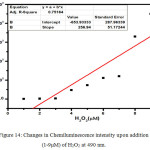 |
Figure 14: Changes in Chemiluminescence intensity upon addition (1-9μM) of H2O2 at 490 nm. |
The luminescence of Luminol (3-amino-pthalhydrazide) and chemiluminescence during oxidation process have been widely studied. Luminol chemiluminescence has limitations in bioimaging and sensing applications due to its solubility. The fluorescence titration of compound 2 with gradual addition of NaOH quenches the fluorescence intensity progressively at 480 nm.(Figure.11) due to the increase in the concentration of dianion.But this basic solution can initiate CL reaction, provided the necessary conditions. To initiate the chemiluminescence in 2, (100μL of 1.8 ×10⁻⁵M) alkaline potassium ferricyanide, followed by varying amounts (1-9μM) of hydrogen peroxide solution were added.10 With an increase in the concentration of peroxide, CL emission intensity was found to be increasing and the lower detection limit (LOD=3σ/s) was found to be 0.76μM.This CL spectra shows a redshift with an emission peak at 490 nm and a shoulder from 510 nm to 600 nm covering the with a green light region (Figure.13 &14). An appreciable red shift was shown by 2 (λmax=490 nm) compared to 1 (λmax=435nm). The CL reaction of 2 produced a fluorescent green colour under UV light(Figure.16 inset). Compared to the short life time of luminol’s blue glow, this fluorescence green colour was long lasting for several hours. The mechanism of CL shown by 2 should be similar to that of parent luminol molecule, 1 (Scheme.3). It should be convincing because of the structural similarity with both these molecules having CL active phthalhydrazide groups.
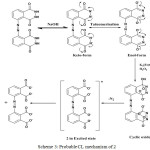 |
Scheme 3: Probable CL mechanism of 2 |
More structural variations in 2 would further enhancement result in enhancement of CL intensity and longer red shift. With this objective we are now involved in synthesizing the derivatives of 2 with more structural variations and their applications in sensing/imaging. Density functional theory studies Density functional theory calculations were carried out with B3LYP level using Gaussian 09 program. The Frontier molecular orbitals of compound 2 obtained from DFT calculations are shown in (Figure.15) which reveals the energy gap between HOMO and LUMO that reflects the chemical activity of compound 2. HOMO has the ability to donate an electron and LUMO represents an electron acceptor. The calculated energy gap between HOMO and LUMO was 3.502 eV. This reveals that the charge transfer interaction may be taking place within the molecule through the π-conjugated bridge.28-31
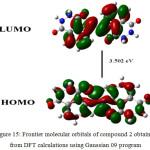 |
Figure 15: Frontier molecular orbitals of compound 2 obtained from DFT calculations using Gaussian 09 program |
Conclusion Structural variation in chemiluminescent Luminol is widely studied to improve its emission properties. In the present study a symmetrical dimer like molecule of luminol bridged by azo link has been prepared. This azo based luminol derivative is highly fluorescent and also shows aggregation caused quenching (ACQ) with an increase in the aqueous content. It’s fluorescence also gets affected by the pH of the medium. In an alkaline medium, fluorescence of luminol derivative gets quenched and green chemiluminescence can be initiated at this stage with H2O2/Fe3+ system. This kind of behaviour shown by this derivative can be successfully utilized for sensing applications. Acknowledgements This research is supported by Science and Engineering Research Board (SERB), Department of Science and Technology (DST), Govt. of India (SR/S1/OC-55/2012). We also thank, Mr. E. Ramachandran, SRF, and IIT Madras, India for the DFT calculations. References
- Gundermann, K. D., Angew. Chemie Int. Edit., 1965. 4, 566–573.
CrossRef - Albrecht, H. O. Z., Phys. Chem., 1928. 136, 321-330.
- Cui, H. W., Wang Duan,C.F., Dong, Y.-P., and Guo, J.-Z., Chem.Eur.J., 2007. 13, 6975–6984.
CrossRef - Wang, W., Xiong,T., and Cui, H., Langmuir., 2008.24, 2826–2833.
- Omote,Y., Miyake,T., Ohmori,S.,and Sugiyama,N., Bull. Chem. Soc. Jpn., 1966. 39,932–935.
CrossRef - White,H.,and Roswell,D.,.Acc.Chem.Res., 1968. 3, 54–62.
CrossRef - White, E.H., and Brundrett,R.B., J.Lumin., 1973. 231–232.
- White,E., and Bursey,M., J.Am.Chem.Soc.,1964. 86, 940–941.
CrossRef - OMOTE., Takeo miyake .,and Noboru sugiyama., 1967. 40, 2446–2448.
- Yoshida,H., Nakao,R., Nohta,H., and Yamaguchi,M., Dyes and Pigments., 2000. 47, 239–245.
CrossRef - Voicescu,M., Vasilescu,M., Constantinescu,T.,and Meghea,A., J. Lumin.,2002.97,60–67.
- Brundrett,R.B., and White,E.H., J.Am.Chem.Soc., 1974. 96, 7497–7502.
CrossRef - Gorsuch,J.D.,and Hercules,D.M., Photochem. Photobiol. Sci.,1972.15,567-583
- Odoroki,K.T., Hba,Y.O.,and Zaitsu,K., Chem.Pharm.Bull., 2013. 48, 2011–2013.
CrossRef - Periyasami,G., Martelo,L., Baleizão,C.,and Berberan-Santos,M.N., New.J.Chem., 2014. 38, 2258.
CrossRef - Xiaoqing Fan.,Yang Feng., Yingying Su., Lichun Zhanga.,and Yi Lv.RSC,Adv.,2015.5,55158.
- Baratoiu,R.D., Mutihac,L.,Vasilescu,M., Voicescu,M., Latus,A., Ionita,G., Beteringhe,A., Constantinescu,T., and Balaban,A.T., ARKIVOC .,2009, 13,300–310.
- Aswathy.R.,and Mohanan,K., J. Fluoresc.,2017. 27, 1171–1181.
- Naidu,S.,and Reddy,S.R., RSC Adv., 2016. 6, 62742–62746.
- Reddy, C.B.R., Reddy, S.R.,and Naidu,S., CATCOM.,2014.56, 50–54.
- McRae, E.G.J., Phys.Chem., 1957. 5, 562-572.
CrossRef - Knibbe,H., J.Chem. Phys.,1967. 47,1184.
CrossRef - Xiaofeng Ma., Rui Sun., Jinghui Cheng., Jiaoyan Liu., Fei Gou., Haifeng Xiang.,and Xiangge Zhou., J.Chem.edu.,2016.93,345-350.
- Sivamani,J., Balasaravanan,R., Duraimurugan,K.,and Siva,A., Photochem. Photobiol. Sci., 2016. 15, 211–218. CrossRef
- Misra,A.,and Shahid,M., J.Phys.Chem C.,2010. 114, 16726–16739.
CrossRef - Lee,J.,and Seliger,H.H., Photochem.Photobiol.,1972. 15, 227–237.
CrossRef - Keizer,J., J. Am. Chem. Soc.,1983. 105, 1494-1498.
CrossRef - Sambathkumar, K., Jeyavijayan,S., and Arivazhagan,M., Spectrochim. Acta Mol. Biomol. Spectrosc., 2015. 147, 124-138.
CrossRef - Xue,B., Liu,C., Liu,Y., and Liu,E., J. Mol. Struct.,2015.1082, 1–6.
- Xue,B., Zhang,C., Liu,C.,and Liu,E., Comput. Theor. Chem.,2014. 1028, 81–86.
CrossRef - Deshmukh,M.S.,and Sekar,N., Dyes Pigm.,2015. 117, 49–60.
CrossRef

This work is licensed under a Creative Commons Attribution 4.0 International License.
![]()
A New Edition of Web of Science
Journal Impact Factor
2022: 0.5
Five Year: 0.8
Journal is Indexed in

Cabells Whitelist
![]()


