Gas Sensor with Reduced Humidity Response Based on Metal Oxide Nanoparticles Synthesized by Spark Discharge
Alexey Vasiliev1,2 , Andrey Varfolomeev1,2, Ivan Volkov1, Pavel Arsenov1, Alexey Efimov1, Victor Ivanov1, Alexander Pislyakov2, Alexander Lagutin2 and Thomas Maeder1,3
1Moscow Institute of Physics and Technology, Dolgoprudny, Moscow region, Russia.
2NRC “Kurchatov Institute”, Moscow, Russia.
3École Polytechnique Fédérale de Lausanne, Lausanne, Switzerland.
Corresponding Author E-mail: a-a-vasiliev@yandex.ru
DOI : http://dx.doi.org/10.13005/ojc/340206
Article Received on : November 02, 2017
Article Accepted on : January 10, 2018
The most part of gas sensors based on tin dioxide semiconductor sensing material are fabricated by using sol-gel synthesis of SnO2. This process leads to the formation of highly sensitive sensing material; however, it forms hydroxyl groups on the surface of tin dioxide, leading, in turn, to strong parasitic sensitivity of the sensor to changing humidity. This sensitivity can be reduced by calcination of sensing material, but this treatment also reduces considerably the total response of the sensor to target gases. In this work, we investigated the possibility of the dry synthesis of tin dioxide nanoparticles by gas phase spark discharge. After the annealing at 610ºC, the specific area of the material synthesized by spark discharge was about 40 m2/g. The sensing layer resistance of the sensor decreases by only 20 %, when relative humidity of a carrier air increases from 40 to 100 %. At the same time, the hydrogen response of the sensor remains the same as for the material prepared by sol-gel synthesis, that is factor of 8 at 100 ppm concentration of H2. Very important property of the sensor is short response time of ~ 1–2 s to both hydrogen and humidity.
KEYWORDS:Gas Sensor; Spark Discharge Synthesis of Nanoparticles
Download this article as:| Copy the following to cite this article: Vasiliev A, Varfolomeev A, Volkov I, Arsenov P, Efimov A, Ivanov V, Pislyakov A, Lagutin A, Maeder T. Gas Sensor with Reduced Humidity Response Based on Metal Oxide Nanoparticles Synthesized by Spark Discharge. Orient J Chem 2018;34(2). |
| Copy the following to cite this URL: Vasiliev A, Varfolomeev A, Volkov I, Arsenov P, Efimov A, Ivanov V, Pislyakov A, Lagutin A, Maeder T. Gas Sensor with Reduced Humidity Response Based on Metal Oxide Nanoparticles Synthesized by Spark Discharge. Orient J Chem 2018;34(2). Available from: http://www.orientjchem.org/?p=44335 |
Introduction
Metal oxide (MOX) semiconductor gas sensors are widely used for the determination of trace concentrations of reducing (H2, hydrocarbons, methane, H2S, NH3, etc.) and oxidizing (NO2, O3, Cl2, F2, etc.) gases. Their application, however, is limited to some extension, by relatively strong parasitic humidity response of such devices. At the same time, the application of MOX sensors is very important, because, for example, according to recent legislation, it is necessary to detect not only close to lower explosive level (LEL) concentrations of combustible gases, but also sanitary concentrations equal e.g. to 100 ppm for methane.
On the other hand, there is no alternative to the application of semiconductor gas sensors for the detection of low hydrocarbon and hydrogen concentration. Indeed, the sensors, which could be used for the measurement of low hydrocarbon concentration are NDIR, thermocatalytic and photoionization devices. Optic NDIR sensors are rather selective, but their disadvantage consists in relatively high detection limit. According to, for example, [2] the detection error with NDIR sensor is equal to 1000 ppm. A similar situation can be found in the case of the application of thermocatalytic (thermochemical) gas sensors [3]. The estimations made using these data shows that the detection limit of methane is of about 1000 ppm.
The detection limit of hydrocarbons for photoionization sensors could be as low as 1 ppb [4], however the limiting factors in this case are relatively high price (~ 1000 Euro) and short life time of 10.4 eV UV lamp.
Therefore, the minimization of humidity response of MOX sensors combining low gas detection limit and low price is important for expansion of gas sensor application.
According to recent point of view [5], the mechanism of humidity response of tin dioxide based gas sensors involves interaction of water with hydroxyl groups on the surface of semiconductor. This process can be suppressed, obviously, by a decrease in OH-group superficial concentration, which could be achieved by several methods. Among them, the most applicable are high-temperature annealing of sensing nanomaterial and its hydrothermal treatment.
The first method, that is high-temperature annealing of sensing material, is used by different researchers and companies producing gas sensors. The annealing of tin dioxide sensing material at temperature of 900–1000°C decreases humidity response, but decrease as well overall sensitivity of gas sensor due to dramatic decrease in specific surface of the material and crystalline growth at temperature exceeding 700ºC. For example, in [6] the authors showed that the annealing of SnO2 at 900°C lead to decrease in specific surface from 32.1 to 10.8 m2/g. This corresponds to our own experience, showing that the annealing of tin dioxide powder at 800ºC for only 15 min. decreases specific surface from ~ 60 to ~ 10 m2/g.
There are two opposite methods to decrease the rate of crystallite growth. The first consists in the application of clean methods of SnO2 synthesis leading to the material free of inorganic ions, first of all, Cl-, Na+, and others existing in inorganic precursors like SnCl2. In this method, tin acetate is used as precursor for the synthesis of tin dioxide powder [7]. Vice versa, doping of SnO2 with 1 wt. % Nb [8] also decreases the rate of crystalline growth of SnO2 by a factor of 3–4 at 900ºC. This decrease is due to the segregation of doping ions, its concentration on the surface of crystallites.
This way of a decrease in humidity response of gas sensor related with high temperature calcinations of sensing material is not the only possible way. Obviously, an opposite approach that is the saturation of the surface with hydroxyl groups can be used as well; such saturated surface cannot adsorb more water, and this leads to reduced humidity response of the sensor. Such approach was used, for example, in [9]. The authors treated the sensing layer with 0.04 mol/l solution of H2SO4, followed by the treatment with 0.1 mol/l tiocarbamide (2 min.). After this, the material was annealed at 600°C for 1 min. As a result, the influence of humidity in a range from near zero to 95% RH was decreased considerably, by a factor of two.
To decrease the concentration of OH-groups, we used dry synthesis of SnO2 material – basic material for hydrogen and hydrocarbon gas sensors. The idea of this approach consists in the application of spark discharge between metallic tin electrodes in air. As a result, tin evaporates from the surface of electrodes with the formation of airborne particles being oxidized by the oxygen contained in the carrier gas (air). Therefore, it is possible to produce directly airborne particles treated at high temperatures, but without crystallite growth, because airborne particles do not have contact between each other during the treatment process.
Experimental
The gas sensing material was produced by using spark discharge generator [10] containing twelve pairs of serially connected cylindrical electrodes powered by 12-nF capacitor charged by high-voltage source (Fig. 1, [11]). The electrodes made of pure tin were aligned at a distance of 0.5 mm and blown continuously with dry clean air at a rate of 15 m/s. The optimum values of the source output voltage and the pulse repetition rate of the generator were found to be 4.5 kV and 2.5 kHz, respectively.
![Figure 1: Layout of the spark discharge generator [11].](http://www.orientjchem.org/wp-content/uploads/2018/04/Vol34No2_Gas_Ale_fig1-150x150.jpg) |
Figure 1: Layout of the spark discharge generator [11]. |
The size distribution of airborne particles in the output flow is presented in Fig. 2.
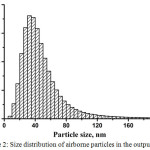 |
Figure 2: Size distribution of airborne particles in the output flow. |
The deposited nanoparticles in the form of powder were collected from the filter and then annealed in air atmosphere at 610ºС for 2 h. The ink for producing sensing layer was prepared by blending the annealed powder with the solution of ethyl cellulose in terpineol. This vehicle is typical of the preparation of inks for screen printing [12]. Viscosity of the ink was adjusted for easy deposition of the ink by a needle. The design of the microheater chip used for the deposition of sensing material was described, for example, in [13]. The chip is fabricated by thick film technology, the size of the chip is of 2.5 ´ 0.5 mm, strip-shaped heater sandwiched between Al2O3 insulating layers is made of Pt containing composite material and has a resistance of about 10 Ohm. The material of the heater enables the sensor heating up to 600– 650ºC (working temperature). The contacts to the sensing layer are made of Pt containing ink. The distance between these contacts is of about 0.3 mm. The ink droplet was deposited on sensor chip by dispensing, then dried at 300ºC and baked at 720ºC.
Results and Discussion
The as-synthesized powder contains the following crystalline phases: SnO2 (93.2 wt. %), SnO (5.4 wt. %), and Sn (1.5 wt. %). The annealed powder is composed mostly of tin dioxide. The measured XRD spectra together with the calculated spectra are presented in Figs. 3a-b.
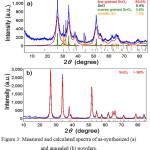 |
Figure 3: Measured and calculated spectra of as-synthesized (a) and annealed (b) powders. |
The as-synthesized powder comprises primary particles of near-spherical shape and their aggregates (Figs. 4a–4b); their size distribution is presented in Fig. 4c. The powder after the thermal treatment contains slightly elongated particles with some surface faceting (Figs. 5a–5b); their size distribution is presented in Fig. 5c. Both types of particles are crystalline that is confirmed by electron diffraction patterns (insets of Figs. 4a, 5a) and corresponding images (Figs. 4b, 5b).
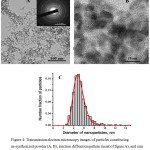 |
Figure 4: Transmission electron microscopy images of particles constituting as-synthesized powder (A, B), electron diffraction pattern (inset of figure A), and size distribution of the number fraction of particles (C). |
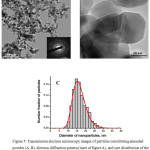 |
Figure 5: Transmission electron microscopy images of particles constituting annealed powder (A, B), electron diffraction pattern (inset of figure A), and size distribution of the number fraction of particles (C). |
The specific surface area of as-synthesized and thermally treated powders is about 130 and 40 m2/g, respectively. The reduced specific surface area of the last one is due to the increased mean particle size caused by recrystallization occurred during the annealing. The results of characterization of as-synthesized and thermally treated powders are summarized in the Table 1, Appendix.
Table 1: Result of characterization of as-synthesized and thermally treated powders
|
Type of powder |
Phase composition (XRD) |
Mean crystallite size (XRD) nm |
Specific surface area (BET), m2/g |
Modal particle size (TEM), nm |
Mean effective particle size*, nm |
|
As-synthesized |
Fine grained SnO2 tetragonal (89.6 wt. %) |
4 |
130 |
4.7 | 7 |
| SnO tetragonal (5.4 wt. %) |
4 |
||||
| Coarse grained SnO2 tetragonal (3.5 wt. %) |
70 |
||||
| Sn tetragonal (1.5 wt. %) |
> 200 |
||||
|
Annealed |
SnO2 tetragonal (> 98 wt. %) |
15 |
40 | 15.3 | 21 |
| Unidentified phases (< 2 wt. %) |
– |
* Calculated via specific surface area
The resistance of the sensor was studied at various concentrations of hydrogen and values of humidity (Fig. 6). At a temperature of 450ºC, the variation of the sensor resistance does not exceed 20% in the range of humidity 40–100% (Fig. 7A). The relative variation of the sensor conductance as a result of changing hydrogen concentration from 0 to 100 ppm is about 8 in this humidity range; the sensor response is described by power law (Fig. 7B), which characteristic of sensors of this type [14].
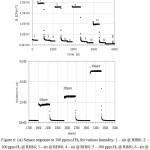 |
Figure 6: (A) Sensor response to 100 ppm of H2 for various humidity: Click here to View figure |
1 – air @ RH80; 2 – 100 ppm H2 @ RH80; 3 – air @ RH80; 4 – air @ RH60; 5 – 100 ppm H2 @ RH60; 6 – air @ RH60; 7 – air @ RH40; 8 – 100 ppm H2 @ RH40; 9 – air @ RH40; 10 – air @ RH30; 11 – 100 ppm H2 @ RH30; 12 – air @ RH30; (B) Sensor response to different concentrations of H2 at a constant humidity (RH60).
The detection limit for hydrogen, which is in fact is due to random variations of ambient humidity, is estimated at 1 ppm (3σ). The response times to humidity (~ 10 s) and hydrogen (~ 1 s) are found to be very short (Fig. 8) as compared to typical metal oxide sensors prepared by wet sol-gel processes. This is especially refers to the response time to changing humidity. Whereas the response time to changing hydrogen concentrations is equal to several seconds and even less was previously observed by researchers (for example, [15, 16]), the typical response time to changing humidity is much longer. It reaches usually several minutes or even several tens of minutes.
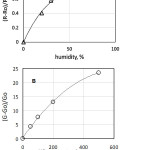 |
Figure 7: (A) Dependence of relative change of sensor resistance on the air humidity; (B) dependence of relative change of sensor conductance on the hydrogen concentration in the air. |
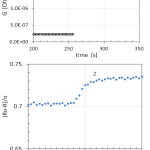 |
Figure 8: (A) Sensor response to changing humidity from RH70 to RH80; (B) sensor response to 100 ppm of H2 in the air (time interval between points – 2 s). Click here to View figure |
For example, in paper [17] the authors analyzed the response time of tin dioxide based sensor to changing humidity. They have shown that the humidity response consists of two parts: fast and slow ones. The fast part of humidity response (approximately 20% of overall amplitude) lasts few seconds, whereas the slow part of humidity response (~ 80 % of amplitude) takes > 5 min. (Fig. 9).
![Figure 9: Response of conductivity of SnO2 film to rapid variation of air humidity (transition “dry→wet” [16]).](http://www.orientjchem.org/wp-content/uploads/2018/04/Vol34No2_Gas_Ale_fig9-150x150.jpg) |
Figure 9: Response of conductivity of SnO2 film to rapid variation of air humidity (transition “dry→wet” [16]). Click here to View figure |
This result is typical of tin dioxide gas sensors; we also observed similar behavior of tin dioxide sensing material prepared by sol-gel method. The most important difference obtained for the sensing material fabricated by discharge method developed in this work is the absence of slow part of humidity response.
According to our opinion, this difference is related with the properties of tin dioxide. Indeed, tin dioxide is not only semiconductor material. It is in reality mixed conductor having electron and superficial proton conductivity [18]. This proton conductivity seems to be responsible for slow part of humidity response (Fig. 9). In our case, the slow part of humidity response is not observed due to the low concentration of superficial hydroxyl groups.
Conclusions
The tin dioxide nanopowder with reduced sensitivity to water vapors due to the low concentration of hydroxyl groups was synthesized by spark discharge and studied as a gas sensitive material. The gas sensor prepared based on this material demonstrated very fast and stable response to humidity (~ 10 s) and hydrogen (~ 1 s), thus offering obvious advantages over conventional metal oxide sensors utilizing particles prepared by wet sol-gel processes. The material studied holds promise for the application in gas sensors for hydrogen monitoring systems.
Acknowledgements
This work was supported by the Ministry of Education and Science of the Russian Federation (Grant No. 14.584.21.0020, unique identifier RFMEFI58416X0020).
References
- http://www.figaro.co.jp/en/product/entry/tgs2610-c00.html
- http://www.optosense.ru/ru/products/mipex-02-infrared-gas-sensors.html
- https://www.sgxsensortech.com/products-services/industrial-safety/mems-pelli stor/
- http://products.baseline-mocon.com/viewitems/oem-sensors-detectors/
- Grossmann, K.; Pavelko, R.G.; Barsan, N.; Weimar, U. Sensors and Actuators B., 2012, 166–167, 787–793.
- Pereira, G.J.; Gouvea, D.; Fifth International Latin-American Conference on Powder Technology 2005, Salvador. Proceedings of Fourth International Latin-American Conference on Powder Technology., 2005.
- Pavelko, R.G.; Vasiliev, A.A.; Gispert-Guirado, F.; Barrabes, N.; Llorca, J.; Llobet, E.; Sevastyanov, V.G. Materials Chemistry and Physics., 2010, 121, 267–273.
CrossRef - Fliegel, W.; Behr, G.; Werner, J. and Krabbes, G. Sensors and Actuators B., 1994, 18-19, 474–477.
- Nagano, Y.; Morimitsu, M.; Matsunaga, M.; Ozaki, Y. and Suzuki, S. 5th East Asian conference on chemical sensors (Nagasaki)., 2001, 252.
- Ivanov, V.V.; Efimov, A.A.; Mylnikov, D.A.; Lizunova, A.A.; Bagazeev, A.V.; Beketov, I.V.; Shcherbinin, S.V. Pis’ma v Zhurnal Tekhnicheskoi Fiziki (Russian journal translated into English)., 2016, 16, 95–101.
- Efimov, A.; Volkov, I.; Varfolomeev, A.; Vasiliev, A. and Ivanov. V. Oriental journal of chemistry., 2016, 32, 2909–2913.
CrossRef - Kim, J.H.; Sung, J.S.; Son, Yu.M.; Vasiliev, A.A.; Koltypin, E.A.; Eryshkin, A.V.; Godovski, D.Yu.; Pisliakov, A.V.; Malyshev, A.V.; Yakimov, S.S. Sensors and Actuators B., 1997, 44, 452–457.
CrossRef - Vasiliev, A.; Pavelko, R.; Gogish-Klushin, S.; Kharitonov, D.; Gogish-Klushina, O.; Pisliakov, A.; Sokolov, A.; Samotaev, N.; Guarnieri, V.; Zen, M.; Lorenzelli, L.; edited by Baraton, M.-I. Springer., 2009, 205–228.
- Varfolomeev, A.E; Eryshkin, A.V.; Malyshev, V.V.; Razumov, A.S.; Yakimov, S.S. Journal of Analytical Chemistry., 1997, 52(1), 66–88.
- Vasiliev, A.A.; Malyshev, V.V. Sensors and Actuators B: Chemical., 2013, 189, 260–267.
CrossRef - Malyshev, V.V.; Pisliakov, A.V. Sensors and Actuators B., 2003, 96, 413–434.
CrossRef - Korotcenkov, G.; Blinov, I.; Brinzari, V.; Stetter, J.R. Sensors and Actuators B., 2007, 122, 519–526.
CrossRef - Dobrovolsky, Yu.; Leonova, L.; Nadkhina, S.; Panina, N. Solid State Ionics 1999, 119, 275–279.
CrossRef

This work is licensed under a Creative Commons Attribution 4.0 International License.
![]()
A New Edition of Web of Science
Journal Impact Factor
2022: 0.5
Five Year: 0.8
Journal is Indexed in

Cabells Whitelist
![]()


