Electrochemical Preparation of the Ti/Ni-Sb-SnO2 for Phenol Removal by In-situ Generated Ozone
Ali Reza Rahmani, Mohammad Taghi Samadi, Mohammad Reza Samarghandi and Ghasem Azarian
Department of Environmental Health Engineering, Faculty of Health and Research Center for Health Sciences, Hamadan University of Medical Sciences, Hamadan, Iran.
Corresponding Author E-mail: gh_azarian@yahoo.com
DOI : http://dx.doi.org/10.13005/ojc/340219
Article Received on : December 14, 2017
Article Accepted on : January 20, 2018
This present study aims to reveal the performance of Ti/Ni-Sb-SnO2 inlimiting oxygen evolution and increasing electrochemical O3 production (EOP) and phenol removal. First, the effect of important variables such as current density (CD), charge passed and electrolyte type on the modified electrodes was investigated. Then, phenol removal by Ti/Ni-Sb-SnO2 was studied using the effect of CD, retention time and phenol concentration. The results revealed that for building the electrodes of Ti/Ni-Sb-SnO2, CD of 3.9mA/cm2 and passed charge of 180mC were obtained. The performance of ozone generation in HClO4 is by far more than that of H3PO4, H2SO4 and HCl. At the initial concentration of 1, 3, 6 and 10 mM, phenol was decomposed by 99.9% approximately in current densities of 61.5, 76.9, 92.3 and 123.1 mA/cm2 and contact time of 150, 250, 350, and 400 min, respectively.
KEYWORDS:Phenolic Wastewater; Electrochemical Treatment; Modified Electrode; Constant Electrolysis
Download this article as:| Copy the following to cite this article: Rahmani A. R, Samadi M. T, Samarghandi M. R, Azarian G. Electrochemical Preparation of the Ti/Ni-Sb-SnO2 for Phenol Removal by In-situ Generated Ozone. Orient J Chem 2018;34(2). |
| Copy the following to cite this URL: Rahmani A. R, Samadi M. T, Samarghandi M. R, Azarian G. Electrochemical Preparation of the Ti/Ni-Sb-SnO2 for Phenol Removal by In-situ Generated Ozone. Orient J Chem 2018;34(2). Available from: http://www.orientjchem.org/?p=44526 |
Introduction
These days, a large amount of sewage containing toxic hard decomposable materials are discharged into the environment and water resources and are considered a serious threat to living organisms and human health 1,2. Among the toxic materials, phenolic compounds are widely entered into sewages and as a result into the water resources 2-4. Advanced oxidation processes (AOPs) have widely and effectively been applied for the treatment of these types of sewages especially for non-biodegradable sewages 5,6. Among AOPs, advanced electrochemical oxidation processes using dimensionally stable anode electrodes have been of much interest 7-9. They have been widely used due to their simplicity, easy operation, low initial investment cost and high efficiency. These electrodes have effectively been used in the removal and mineralization of organic materials because of the production of oxidizing agents like hydroxyl radicals, ozone, etc 10-12.
The use of ozone in water and industrial and urban wastewater treatment has lately been growing due to its green oxidizing function, and it is ultimately converted into O2. It also does not leave any Harmful byproducts 13-15. Ozone is mainly generated by four ways as follows: electric discharge, photochemistry, cold plasma, and electrochemistry, the most important of which is the electric discharge method 15,16 (reaction 1).
2/3O2 → O3 (ΔHo298 = 34.1 kCal) (1)
Ozone should be generated in-situ as it is highly activated in natural circumstances. As plenty of variables such as oxygen source (air or pure oxygen), ambient temperature and presence of impurities in air steam affect ozone production by this process, the efficiency is not more than 1-2% and 2-3% (wt%), respectively, for dry air and net oxygen 15,17. In spite of production of O2 and O3 at the same time, the efficiency of ozone production by means of electrochemical ozone production (EOP) is a lot, reported by 50% in various studies under different conditions 9. A number of great advantages of EOP are as following: ozone generation at high concentrations in gaseous or liquid phase with high energy efficiency, no demand to a gas to be injected or any other substances, simple design, direct application of O3 in water stream and delete of mass transfer Difficulties from gaseous phase to liquid phase, little applied potential and Ability to convert consumed ozone residual into O2 and H2O 9,11,15. In EOP, the generation of oxygen is prohibited through the careful control of the gender and morphology of anode, anode potential, CD, temperature and type of electrolyte. The following reaction shows the mechanism of ozone generation on the surface of the electrode.
O2 + O• → O3 (2)
Different alloys and electrodes have been applied to produce ozone. To produce ozone, some electrodes like Pt, Au, Pd, glassy carbon, PbO2, BDD, dimensionally stable anode, Ni-Sb-SnO2, etc, have been used 9,11,15. BDD and Ni-Sb-SnO2 have been introduced as the only electrodes with high performance for ozone generation in some new studies 9,11,15,17-18; it should be noted that BDD is an expensive electrode that is considered a disadvantage in terms of commercial and industrial uses. Also, Ni-Sb-SnO2 is well coated thermally on different electrodes like titanium15. The electrochemical production is highly dependent on the contact between O2 molecules and O•, which requires active surface. Thus, in comparison with the thermal deposition method, in electrochemical process the surface is entirely and smoothly deposited.
Hence, in present study, the electrochemical method was applied to coat the Ti electrode with Ni-Sb-SnO2. Furthermore, the effects of some variables like CD, Charge passed, and electrolyte type (H2SO4, HClO4, HCl and H3PO4) on Ti/Ni-Sb-SnO2 perpetration were studied. The surface specifications of the Ti/Ni-Sb-SnO2 electrode were carried out using below measures: X-ray diffraction (XRD) and scanning electron microscopy (SEM). In the following, the Ti/Ni-Sb-Sno2 electrode was used for removal of phenol at different contact time, CD and concentrations of phenol.
Materials and Method
Chemicals
Phenol (>99% purity) was prepared from Merck Co. It was applied without additional treatment and a stock solution with a definite concentration was achieved and the working solutions (1-10 mM) were studied (Figure 1). All other chemicals, including HCl, H2SO4, HClO4, H3PO4, SbCl3, NiCl2.6H2O, SnCl4.5H2O, NaOH, C2H5OH, CH3COCH3 and Na2SO4 were of analytical grade and were obtained from Merck, Germany and Sigma-Aldrich. The volume of the catalyst coating solution used for studying the behavior of the produced electrodes and degradation of phenol were 30 and 50 cm3, respectively. The catalyst coating solution containing NiCl2.6H2O, SbCl3 and SnCl4.5H2O were dissolved in ethanol with the molar ratio of 0.0238, 0.183 and 17.5 g, respectively.
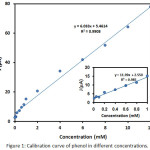 |
Figure 1: calibration curve of phenol in different concentrations. |
Preparation and Coating of the Electrodes and Apparatus
To study the most important parameters affecting the making of the Ti/Ni-Sb-SnO2 electrode, the electrodes of Ti (2 mm in diameter) were initially polished using sandpaper and then they were washed by distilled water so as to remove impurities and metals fully from the Ti surface. Then, in order to clean and remove fat and residual materials in the surface, the electrodes were cleaned using alumina powder and then washed by using distilled water. In the end, they were washed using acetone and distilled water in order to prepare them for coating. The double- step Charon-potentiometer method was applied to build Ti/Ni-Sb-SnO2; here, Ti, platinized titanium, and commercial saturated Ag/AgCl were applied as the working, counter and reference electrodes. To coat the electrodes and study the efficiency of the coated electrodes, an auto-lab device (Potentiostat /Galvanostat Auto-lab PG STAT 20 model) was used. The effects of important parameters on the modified electrodes such as charge passed and CD were studied. Moreover, to investigate the efficiency of Ti/Ni-Sb-SnO2 linear sweeping volt-ammeter (LSV) method was used in the presence of different contents of various electrolytes (HCl, H2SO4, HClO4 and H3PO4)11,15.
To build large electrodes and remove Phenol, at first, the electrodes of Ti (10 cm ×2 cm) were polished with sandpaper and then they were washed. Then, the electrodes were submerged in acetone many times and then were washed by distilled water. Then, they were boiled in 10% oxalic acid for 25 min. Next, the electrodes were well washed via distilled water and were placed four times in a container containing distillation water in ultrasonic bath for 20 min. Then, the electrodes were dried in an oven at 55°C. Construction of Ti/Ni-Sb-SnO2 and all phenol destruction experiments were performed in an 80 cm3 cell. Two electrodes of cathode and one anode made of stainless steel and Ti/Ni-Sb-SnO2, respectively, with dimensions of 10 cm × 2.2 cm were applied. The effective surface of the anode was 48.5 cm2. All of the electrodes were connected to a DC power supply (Aram Tronik Co, Iran). Removal efficiency of the phenol (REP (%)) was calculated by measuring the concentration before and after the process by means of cyclic volt ammeter (CV) techniques (Eq. 3)19:
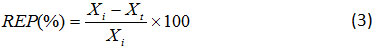
where, Xi and Xt are, respectively, initial and final concentrations of phenol. And, the morphology and the crystallinity of the scratched electro-deposited films of the Ti/Ni-Sb-SnO2 surface were done by the following analyses: SEM, using a Philips XL-30 and XRD, by using Thermo ARL SCINTAG X’TRA, 45 kV.
Results and Discussion
First, different variables of coating the electrode: Ti with the catalyst of Ni-Sb-SnO2 and its effect on ozone production were studied via the LSV technique. Then, so as to find the best condition for phenol removal, the effect of different operating parameters such as CD, retention time and phenol concentration were studied.
Preparation of the Ti/Ni-Sb-SnO2
Effect of Current Density
In order to study the effect of CD on the constant of 180 mC in the presence of 1M HClO4, current densities ranging from 3.9 to 15.7 mA/cm2 were applied and the optimum amount of CD was obtained. Figure 2 shows the LSV of the uncoated electrodes and Ti/Ni-Sb-SnO2 in 50 mV/S. As it is observed, the onset potential reached from 1.02 V vs Ag/Ag Cl for the unmodified electrode to 2.1 V vs Ag/AgCl for the modified electrodes, which is by far higher than the potential of O2 production (Eq. 4-6). Therefore, in this case, the production of O2 is restricted. Despite the fact that deposition leads to higher potentials (from the onset potential), at different current densities, as can be observed, at the constant charge passed of 180 mC, the modifying of the electrode is carried out better at low current densities and longer contact time and, in turn, the built electrode has a suitable performance. In high current densities for electrode modification, the surface of the electrode is not successfully modified; thus, the active surface required for ozone generation is not formed effectively. As a result, the modified electrode does not have a good performance. Findings revealed that the optimum amount of 3.9 mA/cm2 was obtained. Although this CD demonstrated a steep slope reflecting that oxygen evolution has been restricted and more ozone is produces9 (Eq. 4-6).
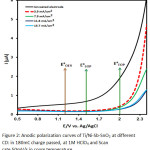 |
Figure 2: Anodic polarization curves of Ti/Ni-Sb-SnO2 at different CD: in 180mC charge passed, at 1M HClO4 and Scan rate 50mV/s in room temperature. |
Effect of Charge Passed
To study the impact of charge passed for coating of the electrode, charge passed = 108-216 mC was tested at CD of 3.9 mA/cm2. The LSV of the unmodified electrode and Ti/Ni-Sb-SnO2 in the presence of 1M HClO4 have been demonstrated in Figure 3. As it is observed, the onset potential for Ti reached from 1.02 V vs Ag/AgCl to about 2.1 V vs Ag/AgCl whereas it shifted to above the O2 production potential for Ti/Ni-Sb-SnO2. As it is observed in Figure 3, the use of charge passed above 180 mC for coating electrode results in decline in electrode efficiency in terms of limiting O2 production and ozone production. Overall, the results achieved in the stage of either CD or charge passed, revealed that a layer with a better efficiency is formed on the electrode via using low current densities at constant passed charge.
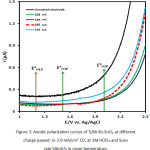 |
Figure 3: Anodic polarization curves of Ti/Ni-Sb-SnO2 at different charge passed: in 3.9 mA/cm2 CD, at 1M HClO4 and Scan rate 50mV/s in room temperature. |
Effect of Electrolyte Type
In this research, four types of acid: H2SO4, HCl, H3PO4 and HClO4 were studied at CD of 3.9 mA/cm2 and charge passed of 180 mC. As is seen in Figure 4, the LSV of Ti/Ni-Sb-SnO2 electrode at Scan rate of 50 mV/S in 1 molar solution of H2SO4, H3PO4,HClO4 and HCl shows that in HClO4 the onset potential shifts to higher potentials. Also, LSV steep of Ti/Ni-Sb-SnO2 electrode is sharper compared to other electrolyte. It can be attributed to the creation of O3, as the main product of the reaction. This product reacts with hydroxyl radical, which results from water electrolyze, and produces HO3o playing a basic role in ozone production9. According to our literature review, the amount of electrochemical generation of ozone is not equal in various acidic contents and environments and the nature of acid anions influences the selective adsorption of water on electrodes’ surface and, in turn, the performance of ozone production 9,20. In a novel study where various acids have been suggested for the electrochemical generation of ozone with various electrodes, it was revealed that percholeric Acid had the highest efficiency with a performance higher than 20% 9. The results of present study are closely consistent with those of the mentioned study. Hence, to investigate other parameters, 1M of HClO4 solution was considered. In acidic environments, there is molecular ozone, but in basic conditions ozone is converted to hydroxyl radical. Considering that the nature of the electrolyte increases the solution conductivity, as a result, more levels of ozone are produced.
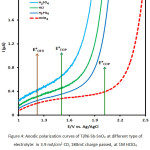 |
Figure 4: Anodic polarization curves of Ti/Ni-Sb-SnO2 at different type of electrolyte: in 3.9 mA/cm2 CD, 180mC charge passed, at 1M HClO4 and Scan rate 50mV/s in room temperature. Click here to View figure |
Electrode Surface Studies
In order to generate more ozone in acidic conditions, electrodes’ surface should be smooth and stable. Figure 5a and b demonstrates the image of the modified Ti/Ni-Sb-SnO2 electrode, under the optimal conditions obtained in previous sections: CD of 3.9 mA/cm2, charge passed 180mC. Apparently, at high magnification the morphology of the coated films on the Ti electrode consisting of Sb, Sn and Ni were spherical. Considering that the size of particles is described as a key parameter in increasing surface active sites. The SEM results show that the sized of deposited particles was between 50.8 and 64.6 nm, indicative of the fact that very small particles, at the level of nanometer, cover all surface of the electrode, which is highly effective in ozone generation. The elemental analysis of the scratched electro-deposited films was tested using XRD (Figure 5c). The well-defined crystallinity of the deposited films on the Ti electrode was approved using the wide-angle PXRD pattern compared to simulated patterns. As is seen, there are at least 6 crystalline structures Sb, Sn, SnO2, Ti, TiO2 and Ni. The dominant and sharp observed diffraction peak belonged Sb and SnO2 211, being reported in previous study as well 21,22.
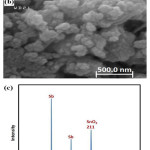 |
Figure 5a: and b) SEM images and (c) XRD pattern of Ti/Ni-Sb-SnO2 (Modified in: 3.9 mA/cm2 CD, 180mC charge passed). |
Phenol Removal
The modified electrode of Ti/Ni-Sb-SnO2 was used in the presence of 1 M perchloric acid for phenol removal. Hence, the solution comprised of phenol with the concentration between 1 and 10 mM was prepared and different current densities and contact times were applied.
Effect of Current Density
It should be pointed that an increase in CD is accompanied with more ozone generation and consequently more phenol is removed. With increasing ozone concentration in solution, mass transfer from gases phase to liquid phase containing the contaminant will enhance and consequently the removal efficiency will improve. Figure 6 demonstrates the results of the effect of CD (in the range of 15.38 – 123.1 mA/cm2) on the efficiency of phenol removal in varying cocentrations (1-10 mM). Findings revealed that complete removal of phenol was achieved at current densities of 61.5, 76.9, 92.3 and 123.1 mA/cm2 for cocentrations of 1, 3, 6 and 10 mM respectively, in the presence of 1M HClO4 at contact times of 150, 300, 350 and 400 min. As can be observed, there is a reverse relationship between phenol removal and pollutant content. At high current densities, ohmic loses increase on the surface of electrode surface because of the formation of gases microbubbles. Thus, it is expected to see a decrease in the removal efficiency at lower electro-conductivity.
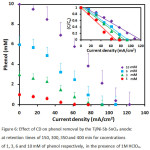 |
Figure 6: Effect of CD on phenol removal by the Ti/Ni-Sb-SnO2 anode: at retention times of 150, 300, 350 and 400 min for cocentrations of 1, 3, 6 and 10 mM of phenol respectively, in the presence of 1M HClO4. |
Effect of contact time
The optimal amounts of CD were applied to attain the best contact time. Thus, for concentreations of 1, 3, 6 and mM of phenol, respectively, the optimized values of CD achieved from the last stage were used. Findings demonstrated that the grow in contact time led to raising removal efficiency (Figure 7). In general, the highest degradation performances were obtained at contact time of 6.66, 5.8, 4.1 and 2.5 h at 10, 6, 3 and 1 mM of initial concenteration, respectively (Table 1). Because an increase in contact time is accompanied with more ozone generation and consequently more phenol is removed, as there was a high content of the phenol on the surface of the electrode in the beginning of the reaction, so, the rate of decomposition continued in the first 6.66, 5.8, 4.1 and 2.5 h min. In contrast, by proceeding the reaction, the rate decreased because the number of the phenol molecules reduced. The other very important point to note here is that using high current densities resulted in the destruction of the Ni-Sb-SnO2 layer, but low current densities in longer detention times led to higher durability of the layer14. Moreover, the use of high current densities not only destructs the anode on the account of adverse reactions like oxygen production (reaction 4) but also decreases the efficiency of ozone generation.
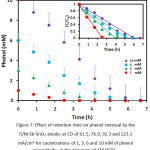 |
Figure 7: Effect of retention time on phenol removal by the Ti/Ni-Sb-SnO2 anode: at CD of 61.5, 76.9, 92.3 and 123.1 mA/cm2 for cocentrations of 1, 3, 6 and 10 mM of phenol respectively, in the presence of 1M HClO4. |
Conclusion
In this research, the electrode of Ti/Ni-Sb-SnO2 was built electrochemically and the key parameters affective in construction of this electrode for better production of ozone were investigated. The built electrode was applied for phenol removal at different contents, current densities and contact times. The findings showed that the electrode could degrade the contaminant effectively, but, for the stability of the deposited layer on the electrode’s surface, low current densities and longer contact times are suggested to be applied. All this makes electro-degradation by using Ti/Ni-Sb-SnO2 a suitable measure to be considered as an effective process for phenol containing wastewaters.
Acknowledgement
This work was supported by the Vice Chancellorship for Research Affairs of UMSHA (No. 9406243361). We are grateful to Hamadan University of Medical Sciences and the Bu-Ali Sina University for providing Research materials, equipment’s and fund. The authors declare that they have no conflicts of interest.
References
- Samadi, M. T.; Shokoohi, R.; Poormohammadi, A.; Azarian, G.; Harati, M.; Shanesaz, S. Orient. J. Chem., 2016, 32, 1015-1024.
CrossRef - Prakash, D.; Singh, S.; Kumar, S. Orient. J. Chem., 2017, 33, 462-469.
CrossRef - Frascari, D.; Bacca, A. E. M.; Zama, F.; Bertin, L.; Fava, F.; Pinelli, D. Chem. Eng. J., 2016, 283, 293-303.
CrossRef - Xu, D. Y.; Yang, Z. Chemosphere, 2013, 92, 391-398.
CrossRef - Olya, M. E.; Akhi, Y.; Marandi, R. Orient. J. Chem., 2016, 32, 1295-1303.
CrossRef - Rahmani, H.; Gholami, M.; Mahvi, A. H.; Alimohammadi, M.; Azarian, G.; Esrafili, A.; Rahmani K.; Farzadkia, M. B. Environ. Contam. Tox., 2014, 92, 341-346.
CrossRef - Curteanu, S.; Godini, K.; Piuleac, C. G.; Azarian, G.; Rahmani, A. R.; Butnariu, C. Ind. Eng. Chem. Res., 2014, 53, 4902-4912.
CrossRef - Rahmani, A. R.; Godini, K.; Nematollahi, D.; Azarian, G. Desalin. Water Treat., 2015, 56, 2234-2245.
CrossRef - Basiriparsa, J.; Abbasi, M. J. Solid. State. Electr., 2012, 16, 1011-1018.
CrossRef - Rahmani, A. R.; Nematollahi, D.; Azarian, G.; Godini, K.; Berizi, Z. Korean J. Chem. Eng., 2015, 32, 1570-1577.
CrossRef - Zakaria, K.; Christensen, P. A. Electrochim. Acta, 2014, 135, 11-18.
CrossRef - Godini, K.; Azarian, G.; Rahmani, A. R.; Zolghadrnasab, H. J. Res. Health Sci., 2013, 13, 188-193.
- Ghasemian, S.; Asadishad, B.; Omanovic, S.; Tufenkji, N. Water Res., 2017, 126, 299-307.
CrossRef - Rahmani, A. R.; Nematollahi, D.; Samarghandi, M. R.; Samadi, M. T.; Azarian, G. J. Electroanal. Chem., 2018, 808, 82-89.
CrossRef - Christensen, P.A.; Yonar, T.; Zakaria, K. Ozone-Sci. Eng., 2013, 35, 149-167.
CrossRef - Vijayan T.; Patil J. G.; Int. J. Sci. Technol. Educ. Res., 2010, 1, 132-142.
- Da Silva, L.M.; Franco, D.b.V.; Sousa, L.G.; Gonçalves, I.C. J. Appl. Electrochem., 2010, 40, 855-864.
CrossRef - Yang, S. Y.; Kim D.; Park, H. Environ. Sci. Technol., 2014, 48, 2877-2884.
CrossRef - Azarian, G.; Miri, M.; Nematollahi, D. Environ. Prog. Sustain., 2017, In Press https://doi.org/10.1002/ep.12711.
CrossRef - Christensen, P. A.; Lin, W. F.; Christensen, H.; Imkum, A.; Jin, J. M.; Li, G.; Dyson, C. M. Ozone-Sci. Eng., 2009, 31, 287-293.
CrossRef - Shao, D.; Li, X.; Xu H.; Yan, W. RSC Adv., 2014, 4, 21230- 21237.
CrossRef - Kong, J. T.; Shi, S. y.; Zhu X. P.; Ni, J. R. J. Environ. Sci., 2007, 19, 1380-1386.
CrossRef

This work is licensed under a Creative Commons Attribution 4.0 International License.
![]()
A New Edition of Web of Science
Journal Impact Factor
2022: 0.5
Five Year: 0.8
Journal is Indexed in

Cabells Whitelist
![]()


