Diagnosis, Structure, and in the Vitro Antimicrobial and Antifungal Evaluation of Some Amino Benzoic Acids -Derived Ligand Schiff Base and Their Mixed Complexes with Cu(II), Hg(II), Mn(II) ,Ni(II) and Co(II)
 , Lekaa Khalid Abdul Karem and Faeza Hasan Ghanim
Department of Chemistry, College of Education for Pure Sciences, Ibn -Al-Haitham, University of Baghdad, Adhamiyah, Baghdad,10001, Iraq.
Corresponding Author E-mail: drrehabalshemary@gmail.com
DOI : http://dx.doi.org/10.13005/ojc/340263
Download this article as:
![]()
Innovative various Schiff bases and their Co(II), Ni(II) and Cu(II) and Hg(II) compounds made by the condensation of 4-amino antipyrine with derived aminobenzoic acid (2-aminobenzoic acid, 3-aminobenzoic acid, and 4-aminobenzoic acid ) have been prepared by conventional approaches. These complexes were described by magnetic sensibility analysis, FT-IR spectra, and molar-conductance and elemental analysis. Analytical values appeared which the mixed-ligand complexes presented ratio about 2:1 (ligand: metal) with the chelation 4 or 6. The prepared compounds offered a good effect on the organisms; bacteria Staphylococcus-aurous, Escherichia-coli and fungi C. albicans, A. niger. Also, the biological products signalize which the mixed complexes show objectively worthy performance compared to all the investigated bacterial strains, and generally the action order of the produced complexes has been characterized as Ni(II) > Cu(II) > L.
KEYWORDS:Schiff Bases; 4-Aminopyrine; Biological Activity
Introduction
Through the previous decades, Schiff base was the most significant ligand in the chemistry of the metal complexes to include donor atoms like nitrogen and others.1-3 considering their great enforcements in the scope of bioorganic, synthetic organic and medical chemistry, there has been formidable attention in the composition of new bioactive amines and evolving effective processes for their derivatives.4-6 Derivatives of 4-amino antipyrine are used as the opener organic intermediates for the preparation of biomolecules for synthetic purposes, possess important biological, catalytic activity and an efficient reagent in trace analysis of some metal cations. 6-7 The coordinating properties of 4-aminoantipyrine have been amended to give new ligands composed by the reaction with ketones, carbazides, thiocarbazides, and aldehydes etc.8-10 such as anthranilic acid, vanillin, furfural and o-phenylene diamine.11-14 The chelation chemistry, biological efficacy and new structural lineaments of the Schiff bases have attracted attention. They are contain potential chelation positions about four with various chelating force also this can allow altitude to different linking and several stereo-chemical in their chelation complexes.15-17 In this research, we characterized the installation and description of and the mixed coordination complexes of the ligands (Schiff bases and1,10-phenanthroline) with several metal ions.
Materials and Methods
Apparatus and Reagents
All reagents 4-aminoantipyrine, 2-aminobenzoic acid, 3-aminobenzoic acid, 4-aminobenzoic point out acid, nickel cobalt, mercury in addition to copper (II)chlorides were of Merck results and utilized as provided 13C and 1H- NMR spectra . Microanalytical data of the complexes had measured at Bruker specrospin ultra shield magnets 300 MHz instruments.FT.IR spectra was registered on a SHIMADZU FT.IR spectrophotometer 8300. UV/Vis spectra were noted on UV/Vis Varian Uv-Cary-100 spectrophotometers. The chloride content registered by way (potentiometric titration) on 686-Titro Dosim A-Metrohm Processor-665 /Swiss. Magnetic susceptibility measuring has acquired on the solid state using Bruker BM6 instrument. Micro analysis (C, H and N %) of the formed complexes had performed by means of C.H.N. Analyzer on Perkin Elmer 2400 sequence II. Dissolving details that evaluated in Gallen Kamp melting point apparatus were unmodified.
Synthesis of ligands
The ligands [A1], [A2] and [A3] were synthesis approving to the general technique displayed in (scheme 1 ,2 and 3).The [A1], [A2] and [A3] was synthesized by mixing an ethanolic solution (15 mL) of 4-amino antipyrine (0.203gm, 0.001m mole) with (0.012gm, 0.001mmole) 2-aminobenzoic acid in the same volume of ethanol (four drops of Glacial acetic acid have been inserted). This reaction has been subsequently refluxed with stirring for 8h and the solution has been tolerable at room temperature to form [A1, A2 and A3].
For (A1) (C18H18N4O2) Mwt: (322.36), Yield(78%): 66: M.p.: 156°C, Anal. Cal. (%): C, 67.07; H, 5.63; N, 17.38, Found (%): C, 66.71; H, 5.32; N, 17.11, IR (KBr,cm-1): 3423, υ(OH); 3350, 3223, υas,s (NH);3016,(C─H)aromitic; 2908, (C─H)alphatic; 1686, (C=O); 1606, (C=N)st; 1529,(C=C)st, UV-Vis (DMSO, λmax(nm)(cm-1)): 240(41666), 312(32051) ,1HNMR (DMSO-d6, 300MHZ) δ:2.26,(s,3H,CH3); 2.49,(s,6H,DMSO);3.38, (s,3H,CH3); 5.17, (s,2H, NH2);6.54-8.12,(m,12H8,C6H5); 12.85,(s,1H,COOH).13CNMR(DMSO, 75MHZ) δ: 9.14 (s,C-CH3);33.7 (s,N-CH3):41.01; (s, DMSO), 114.18 (s,=C-N); 123.56-135.45 (m,C6H5); 151.17 (s,C=N);154.98 (s,N-C=); 161.72(s, COOH)
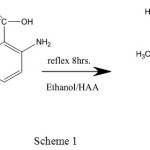 |
Scheme 1 |
For (A2) (C18H18N4O2) Mwt: (322.36), Yield(%): 89, Anal. Cal. (%): C, 65.24; H, 5.78; N, 16.91, Found (%): C, 63.67; H, 4.40; N, 9.21, IR (KBr,cm-1) :3478,υ(O-H); 3327,3236, υas,s (NH);3075,(C─H)aromatic; 2929,(C─H)aliphatic; 1660,(C=O)carboxylic; 1576,(C=N)imine; 1543,(C=C)aromatic, UV-Vis(DMSO, λmax(nm)(cm-1)): 275 (36363), 385 (25839). 1HNMR (DMSO-d6, 300MHZ): δ:2.26,(s,3H,CH3); 2.47,(s,6H,DMSO);3.58, (s,3H,CH3); 5.47, (s,2H, NH2);6.14-8.02,(m,12H,C6H5); 12.58,(s,1H,OH).13CNMR (DMSO, 75MHZ) δ: 10.12 (s,C-CH3) ;33.7(s,N-CH3): 40.38; (s,DMSO), 114.18(s,=C-N); 123.56-149.97 (m,C6H5); 151.17 (s,C=N);154.26 (s,N-C=);161.89(s, COOH).
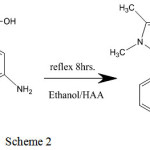 |
Scheme 2 |
For (A3) (C18H18N4O2) Mwt: (322.36), Colour: (yellow) Yield(%) : 85 : M.p.: 232°C, Anal. Cal. (%): C, 67.07; H, 5.63; N, 17.38, Found (%): C, 67.97; H, 5.88; N, 17.69, IR (KBr, cm-1): 3444 υ(OH); 3336,3215, υ as,s (NH); 3051,(C─H)aromatic; 2970,(C─H)aliphatic; 1668, (C=O) carboxylic ; 1579 (C=N) imine; 1566,(C=C) aromatic, UV-Vis (DMSO, λmax(nm)(cm-1)): 267(37453), 350(28571). 1HNMR (DMSO-d6, 300MHZ):δ: 2.26, (s,3H,CH3); 2.47,(s,6H, DMSO); 3.11, (s,3H ,CH3); 4.95, (s,2H ,NH2); 6.5-8.12,(m,12H,C6H5); 12.83, (s,1H,OH). 13C NMR (DMSO, 75MHZ) δ: 10.12 (s,C-CH3) ;33.7(s,N-CH3): 40.38; (s,DMSO), 106.14 (s,=C-N); 123.56-149.97 (m,C6H5); 151.17 (s,C=N); 154.26 (s,N-C=);165.64(s, COOH).
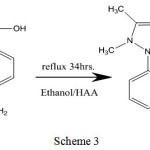 |
Scheme 3 |
Syntheses of the Mixed -Complexes
(0.002mmol , 0.436) gm ligands [A1], [A2]and [A3] in KOH (0.001mmol, 0.056gm) solution and metal salts (0.340 gm CuCl2.2H2O, 0.543gm HgCl2 0.475gm, CoCl2.6H2O, 0.475gm NiCl2.6H2O and 0.395gm MnCl2.4H2O) (0.001 mmol) with 1,10-phenanthroline (0.001mmol ,0.18 gm)were dissolved in(15 mL) ethanol then for 1.5 h reflux the mixture. Then, the item was categorized at that point cleaned with (2:5) mL ethanol: diethyelther and dried at room temperature. At similar method were obtained the other complexes.
For [Ni(A1)(PHN)Cl] (C30H25ClN6NiO2)(S1); Mwt: (595.70), Yield(%:68, M.p.: 267°C ,Anal. Cal. (%): Ni, 9.85; C, 60.49; H, 4.23; N, 14.11; Cl, 12.52, Found (%): Ni, 9.85; C, 60.49; H, 4.23; N, 19.67; Cl, 12.20, IR (KBr,cm -1): 34203, 3352,(NH2)st; 3021,(C─H) aromitic ; 2927,(C─H) alphatic; 1545υasy.(COO-);1592, (C=N)st ;1518, (C=C)st;1445 υsy. (COO-) 565, (M─N)st, UV-Vis (DMSO, λmax (nm)(cm-1)):258, (38759); 292,(34246); 379, (26364); 656,(15242);764,(13087), Molar conductance (DMSO): 8.9 S. mol −1.cm 2 , μeff (BM): 2.72
For [Cu(A1)(PHN)Cl] (C30H25ClCuN6O2) (S2) ; Mwt: (600.56), Yield(%): 77 , M.p.: 218 °C Anal. Cal. (%): Cu, 10.58; C, 60.00; H, 4.20; N, 13.99; Cl, 5.90. Found (%): Cu, 10.69; C, 50.34; H, 6.11; N, 19.17; Cl, 12.38.IR (KBr, cm -1): 3478,υ(O-H); 3424,3449,(NH2)st ; 3038,(C─H)aromitic; 2933,(C─H)alphatic; 1621, (C=N)st ;1525,υasy.(COO-);1516,(C=C)st; 1417, υsy.(COO-);559,(M─N)st,UV-Vis (DMSO, λmax (nm) (cm-1)): 254,(39370); 286, (34965); 682,(14662).Molar conductance (DMSO): 10.2 S. mol −1. cm2, μeff (BM): 1.86
For [Ni(A2) (PHN) Cl2] (C30H26Cl2N6NiO2); Mwt: (632.17), Colour: (Greenish yellow), Yield(%:68 , M.p.: 267 °C , Anal. Cal. (%): Ni, 9.28; C, 57.00; H, 4.15; N, 13.29; Cl, 11.22, Found (%): Ni, 10.23; C, 50.29; H, 6.11; N, 19.67; Cl, 12.20, IR (KBr, cm -1): 3464,υ(O-H); 3420, 3352 ,(NH2) st; 3096,(C─H) aromitic ; 2835,(C─H) alphatic; 1705, (C=O)st ; 16201590 (C=N)st 1618, (C=C)st ; 565, (M─N)st, UV-Vis (DMSO, λmax (nm) (cm-1)): 258, (38759); 292, (34246); 379, (26364); 656, (15242); 764, (13087),Molar conductance (DMSO): 8.9 S. mol −1. cm 2, μeff (BM): 2.72
For [Cu(A2)(PHN)Cl2] (C30H26Cl2CuN6O2) (S4); Mwt: (637.02), Yield(%):77, M.p.: 218 °C Anal. Cal. (%): Cu, 9.98; C, 56.56; H, 4.11; N, 13.19; Cl, 11.13. Found (%): Cu, 10.69; C, 50.34; H, 6.11; N, 19.17; Cl, 12.38.IR (KBr, cm-1) 3481,υ(O-H); 3429, 3368 (NH2)st ; 3062,(C─H) aromitic ; 2923,(C─H) alphatic 1621,(C=O)asymm; 1585 (C=N)st 1421,(C=O)symm; 1585, (C=C)st; 1171,(C-O)st 523,438 (M─N)st,UV-Vis (DMSO, λmax (nm) (cm-1)): 254, (39370); 286, (34965); 413, (24213); 982, (10176).Molar conductance (DMSO): 10.2 S. mol −1. cm2, μeff (BM): 1.68
 |
Scheme 4 |
For [Ni(A3)(PHN)Cl2] (C30H26N6Cl2NiO2) (S5); Mwt: (632.17), Yield(%:70, M.p.: 218°C ,Anal. Cal. (%): Ni, 9.28; C, 57.67; H, 4.15; N, 13.29; Cl, 11.22,.Found (%): Ni, 9.56; C, 57.88; H, 4.34; N, 13.28; Cl, 11.56, IR (KBr, cm-1): 3458,υ(O-H); 3420, 3352 ,(NH2) st; 3021 ,(C─H) aromitic ; 2927,(C─H) alphatic; 1624, (C=N)st ;1618, (C=C)st ; 565, (M─N)st, UV-Vis (DMSO, λmax (nm) (cm-1)): 258, (38759); 292, (34246); 775, (12893),Molar conductance (DMSO): 8.9 S. mol−1. cm2, μeff (BM): Dia
For [Cu(A3)(PHN)Cl2] (C30H26CuN6O2) (S6) ; Mwt: (566.11), Colour: (Green), Yield(%) : 77 , M.p.: 218 °C Anal. Cal. (%): Cu, 11.22; C, 63.65; H, 4.63; N, 14.85. Found (%): Cu, 10.69; C, 50.34; H, 6.11; N, 19.17. IR (KBr, cm -1): 3476,υ(O-H); 3424, 3449,(NH2)st; 3038,(C─H) aromitic ; 2933,(C─H) alphatic ; 1621, (C=O)st 1621, (C=N)st ;1516, (C=C)st; 559, (M─N)st,UV-Vis(DMSO, λmax(nm) (cm-1)): 254, (39370); 286, (34965); 543,(18416) . Molar conductance (DMSO): 10.2 S. mol −1. cm2, μeff (BM): 1.78
 |
Scheme 5 |
Biological Studies
The organic action (in-vitro) of selected compounds was screened with two bacteria Staphylococcus aureus and Escherichia coli by disc expansion way by means of nutrient agar as the environment and control as streptomycin. Also the antifungal efficacy of the components was screened by the same previous way in the environment as potato dextrose agar with the fungi A. niger and C. albicans. All the components have been in the (25, 50 and 100ppm) concentrations of DMSO solutions that have synthesized disjointedly. A well was got on agar environment in the cultivated microorganism in a typical procedure. It was loaded with the screen solution utilizing plate and a micropipette the was brood for bacteria at 24 h, 37°C and for fungi at 72 h,.30°C. Investigational solution was growth and suffused of the inoculated microorganism was influenced during this interval. The inhibition region advanced, at that was noted the concentration.
 |
Scheme 6 Click here to View scheme |
IR Spectra
IR spectra of the Ligands and mixed compounds obviously point out the bonding combination of the shift base ligands with metallic ion. A wide spectrum at 3423 cm-1, 3478 cm-1and 3444 cm-1 owing to υ(OH) stretching vibration for Al, A2, and A3, respectively, υasym, sym NH2 stretching vibration for Al, A2, and A3, respectively. Also, they showed at 1636 while this band was disappeared in the spectrum of its mixed complexes for A1. In addition displayed at (3358, 3223) cm-1, (3327, 3236) cm-1, and (3336, 3215) characteristics of the stretching mode (azomethine) (C=N) suggesting the forming of the ligand results. This frequency was moved to lower value in the spectrum of its metal complexes (1581–1565 cm-1) liken with the ligand signalizing the partnership of the nitrogen of azomethine in coordination with metal ion. The chelation of nitrogen to the metallic ion could be prospective to lessen the electron density of the imine connection and consequently triggered a change in the group of (C=N). The penetrating bands at 1686 cm-1,1668 cm-1 and 1660 cm-1 shows in the IR spectra of the free ligands Al, A2, and A3 may be allocated to the υ(C=O)(carboxylic cluster). On the other hand, all spectra compounds for Al have stated the nonappearance of the characteristic band with the presence of dual characteristic bands at 1545–1525 and 1445 –1417cm-1 related to υasy.(COO–) in addition to υsy.(COO–) correspondingly, (Δυ(COO−)=υsy.(COO−)-υsay.(COO−)) in range (108-100)cm-1,indicated the involvement of deprotonated group of (COOH) in bonding and an organization of metallic ions through oxygen atoms of carboxyl groups signifying the contribution of the carboxylate oxygen atom in the compound structure. Decisive indication of the bonding was similarly has exposed noticeably that innovative bands in all metal complex spectrums in the small frequency regions at 548–531 and 483–465 cm-1 present to υ(M–O) and υ(M–N) extending frequencies, separately, which weren’t appeared in the spectrum of ligands.
Electronic Spectra
UV-Vis of [A1],[A2] and[A3] ligands spectra and the mixed-complexes were determined in solution of DMSO. Each compound was displayed huge energy band in the range 4166 -36363cm-1. This can be assigned to the L.F b and. Also, the high energy absorption band in 25839–34965 cm-1 range. This can be assigned to the C. T band. The (S1) complex spectrum displayed three d–d transition bands at 26364, 15242 and 13087 cm-1 that is due to 3A2g(F)→3T1g(F),3A2g(F)→3T2g(F) and 3A2g(F)→3T1g(P) arrangements, individually, distinguishing of an octahedral arrangement. This arrangement has been moreover confirmed by its magnetically sensibility data (2.72lB)
The complex (S2) spectrum showed the d–d bands at 14662 cm-1. This corresponds to 2Eg(F)→2T2g(F) transition. The d–d transition facilitates an unrecognizable octahedral arrangement in the area metal. Accordingly, the design is more confirmed by its magnetically susceptibility magnitude (1.86 lB).
The complex (S3) spectrum presented dual d-d transition bands in 15242 region, and 13087cm that are given to 3A2g(F)→3T1g(P) and3A2g(F)→3T1g(F)transitions, correspondingly. These transitions characterize the octahedral structure of the compound, that is as well confirmed by its magnetically susceptibility magnitude (4.45 lB). The absorption spectrum of the complex (S4) presented the d–d bands at 14662 cm-1. This corresponds to 2Eg(F)→2T2g(F) transition. This d–d transition has an inaccurate octahedral arrangement in the metal. This structure is additionally reinforced by its magnetic susceptibility data (1.86 lB).
The spectrum of complex (S5) of the displayed one d-d transition band at 12893cm-1 that belong to 1A1g (F) → 2Eg transition. The transition corresponds to a square planar of the compound geometry that is likewise confirmed by its diamagnetic susceptibility. The absorption spectrum of the complex (S6) presented the d–d bands at 18416cm-1. This corresponds to 2B1g→2A1g transition. This d–d transition has a square 2D arrangement. This structure is then confirmed by its magnetic susceptibility data (1. 78 lB).
NMR Spectra
1H NMR spectrum of Schiff base [A1] (in DMSO-d6 as solvent), showed a singlet signal at δ2.26 ppm for three protons of CH3 group, singlet signal at 2.49ppm for 6 protons for DMSO, a singlet signal at δ3.38ppm for three protons of CH3 group, milt signals in range δ(6.54-8.12) ppm that might be due to the twelve aromatic protons of phenyl rings. And two protons at NH2of amine group gives as a broad singlet signal at δ5.17 ppm. Finally, singlet signal at δ(12.85)ppm concerning one proton of OH carboxylic group.
1H NMR spectrum of Schiff base [A2] (in DMSO-d6 as solvent), showed a singlet signal at δ2. 26 ppm for three protons of CH3 group, a singlet signal at 2.47ppm for 6 protons for DMSO, also singlet signal at δ3.58 ppm for three protons of CH3 group, milt signals in range δ(6.14- 8.02) ppm that might be due to the twelve aromatic protons of phenyl rings. And two protons at NH2of amine group gives as a broad singlet signal at δ4.47 ppm. Finally, a singlet signal at δ(12.58)ppm relating to one proton of OH carboxylic cluster.
1H NMR bands of Schiff base [A3] (in DMSO-d6 as solvent), fig (9) showed a singlet signal at δ2. 26 ppm for three protons of CH3 group, singlet signal at 2.47 ppm for 6 protons for DMSO, a singlet signal at δ3.11 ppm for three protons of CH3 group, milt signals in range δ(6.5- 8.12) ppm that might be due to the twelve aromatic protons of phenyl rings. And two protons at NH2of amine group gives as a broad singlet signal at δ4. 95 ppm. Finally, a single signal at δ(12.83)ppm for carboxylic proton
The 13C NMR ligand (A1) band displayed the CH3-C= group as the signal at 9.12 ppm and CH3-N= group at 33.85 ppm group. Also, the peak of (=C-N) group showed at 105.18 ppm. The other peaks of aromatic carbons resonance observed at 122.70-149.97 ppm. The signals at 151.17ppm. The other peaks of aromatic carbons resonance observed at 123.57-149.97 ppm. Also, the peak of carboxylic carbon is displayed at 165.27.
The 13C NMR ligand (A2) spectrum displayed the CH3-C= group as the signal at 10.12 ppm and CH3-N= group at 33.85 ppm group iminic carbon (C=N) as functional group signal at 106.08 ppm. The other peaks of aromatic carbons resonance observed at 123.57-149.97 ppm. Also the peak of 10.12 (s,C-CH3);33.7(s,N-CH3):40.38;(s,DMSO), 106.14(s,=C-N); 123.56-149.97 (m,C6H5); 151.17 (s,C=N);154.26 (s,N-C=); 165.64(s, COOH).
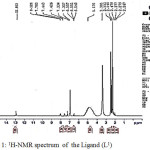 |
Figure 1: 1H-NMR spectrum of the Ligand (L1)Click here to View figure |
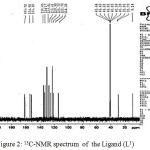 |
Figure 2: 13C-NMR spectrum of the Ligand (L1) Click here to View figure |
The 13C NMR ligand (A3) spectrum displayed the CH3-C= group as the signal at 10.12 ppm and CH3-N= group at 33.85 ppm. Also, the peak of (=C-N) group showed at 106.14 ppm. The other peaks of aromatic carbons resonance observed at 123.57-149.97 ppm. The signals at 151.17- 154.26 ppm of ionic carbon (C=N) and (N-C=) as functional groups. Also, the signal of carboxylic carbon is displayed at 165.64.
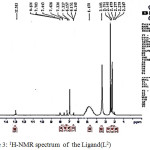 |
Figure 3: 1H-NMR spectrum of the Ligand(L2) Click here to View figure |
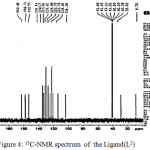 |
Figure 4: 13C-NMR spectrum of the Ligand(L2) Click here to View figure |
Molar Conductivity
The molar conductivities of the compounds had measured at room temperature under 10-3 M of their ethanolic solution. The molar conductivity values of (S1), (S2), (S3) and (S4) under investigation are found to be at(72, 76, 83,87, and 89 ohm-1 cm2 mol-1), correspondingly. It is clear from these data that the compounds are ionic and they are of 1:2 electrolytes in type [20]. In addition, the conductance data are low for (S5) and (S6) complexes lie at(1.2 and 2.9 ohm-1cm2mol-1) support their non-electro nature of the compounds.
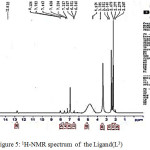 |
Figure 5: 1H-NMR spectrum of the Ligand(L3) |
 |
Figure 6: 13C-NMR spectrum of the Ligand(L3) Click here to View figure |
Biological Activities
The Biological activity (in-vitro) of created Schiff base ligands and their resultant metal compounds on tested two bacteria S. aureus and E. coli and dual fungi A.niger and C. albicans was done. Each particular components presented perfect biological effectiveness with microorganisms. The biological effectiveness of all selected compounds were liken with the norm fungicide and bactericide. The mixed complexes have mild effectiveness were liken to the typical degrees. Nevertheless, all compounds are more effective as compared with their relevant ligands. It is, on the other hand, identified that chelation is likely to make Schiff bases have more influential and strong bactereostatic agents, hence constraining the growing fungi and bacteria more than the parent ligands. It is doubted that agents like dipole, conductivity, moment solubility and cell penetrability technicality (affected by the existence of metallic ions) can be probable causes intensification in efficiency. The diameter in (mm) of the repression domains are summarized in table 1 and 2.
Table 1: Antibacterial screening data for the ligands and their compounds.
| E. coli | S.aureus | ||||||||||||
| Compound | Diameter of inhibition zone (mm) | % Activity index | Diameter of inhibition zone (mm) | % Activity index | |||||||||
| 25 | 50 | 100 | 25 | 50 | 100 | 25 | 50 | 100 | 25 | 50 | 100 | ||
| [A1] | 10 | 12 | 15 | 49 | 55 | 59 | 9 | 11 | 15 | 52 | 57 | 59 | |
| [A2] | 9 | 11 | 14 | 50 | 54 | 57 | 10 | 12 | 16 | 53 | 58 | 60 | |
| [A3] | 11 | 13 | 16 | 50 | 56 | 60 | 12 | 14 | 18 | 55 | 59 | 61 | |
| [S1] | 17 | 20 | 25 | 78 | 84 | 90 | 15 | 19 | 21 | 87 | 90 | 93 | |
| [S2] | 15 | 19 | 21 | 80 | 84 | 88 | 16 | 20 | 22 | 81 | 85 | 87 | |
| [S3] | 18 | 22 | 27 | 81 | 86 | 92 | 18 | 22 | 24 | 92 | 98 | 101 | |
| [S4 ] | 19 | 24 | 30 | 84 | 87 | 95 | 20 | 24 | 27 | 97 | 104 | 106 | |
| [S5] | 20 | 25 | 31 | 82 | 87 | 91 | 19 | 25 | 28 | 82 | 103 | 105 | |
| [S6] | 21 | 26 | 28 | 82 | 86 | 92 | 20 | 26 | 30 | 88 | 104 | 107 | |
| Streptomycin (Standard) | 21 | 22 | 26 | 100 | 100 | 100 | 18 | 22 | 26 | 100 | 100 | 100 | |
Table 2: Antifungal screening data for the ligands and their complexes.
| Diameter of inhibition zone (mm); Concentration in ppm | ||||||
| Compound | A. niger | C. albicans | ||||
| 25 | 50 | 100 | 25 | 50 | 100 | |
| [A1] | 13 | 18 | 21 | 15 | 18 | 24 |
| [A2] | 10 | 17 | 20 | 14 | 17 | 20 |
| [A3] | 19 | 25 | 30 | 18 | 20 | 22 |
| [S1] | 17 | 20 | 25 | 20 | 27 | 34 |
| [S2] | 18 | 22 | 27 | 19 | 25 | 37 |
| [S3] | 19 | 23 | 29 | 21 | 27 | 38 |
| [S4 ] | 18 | 24 | 31 | 19 | 26 | 36 |
| [S5] | 20 | 22 | 32 | 18 | 30 | 35 |
| [S6] | 22 | 25 | 34 | 20 | 31 | 38 |
Conclusions
From the UV–Vis 1H & 13C NMR and IR spectra, elemental analysis, molar conductivity, and magnetic values, it is imaginable to measure the kind of chelation of the ligand in their mixed complexes. Depended on these values, octahedral arrangement has been signified as (S1) (S2) (S3) and (S4) complexes except (S5), (S6) complexes are assigned a square planar arrangement.
The biological activity of these metal compounds with bacteria; E. coli and S. aureus, and fungi A. niger and C. albicans was investigated. From the results, it is found that the mixed complexes have been patterned for the biological testing mostly regarding the mixed compounds versus the bacteria and fungi. Also, what may be referred to the truth which the metal complexes are effectual versus both fungi and bacterial cells.
References
- Dhar, D. N.; Taploo, C .L., J. Sci.Ind. Res. 1982, 41(8):501-506.
- Maria, D.M.C.; Ribeiro, D.; Jorge, M.G.; Ana, L.R.S.; Paula, C.F.C.; Bernd, S., J. Mol. Catal. A: Chem. 2004, 224, 207-212.
CrossRef - Cotton, A.F.; Wilkenson, G., 5th Edition 1988, John Wiley and Sons USA, 37-50.
- Hassan, K.; Salehzadeh, H.S.; Parish, R.V., J. Molecules 2002, 7,140-144.
- Kirshener, Wei S.Y.K., Francis, D.; Bergman, J.H., Anticancer and potential antiviral activity of complex inorganic compounds 1966, J. Med. Chem. 9: 369-372.
- Joana, C.; Carolina ,M.; Sofia, S.; Pedro, V. B. ; Alexandra, R. F., Ann. Med. Chem. Res,. 2015,1(2): 1010,1-5
- Yu, R.;Ling, Z., Cheng-He, Z. ;Rong-Xia, G., Med. chem., 2014, 4(9): 640-662.
- Kostova, I.; Raleva ,S.; Genova, P. ; Argirova, R., Bio. Chem. & Appli, 2006, 1–9
- Lever A.B.P., Elsevier 1984, New York.
- Kojima, M.; Taguchi, H.; Tsuchimoto, M.; Nakajima, K., Coord. Chem. Rev., 2003,237, 183-196.
CrossRef - Long, N.J., Chem. Int. 1thEdition 1995,34, 21.
- Cusumano, M.; Messina, M.A.; Nicolo F., Pietro M.L.D., Rotondo A., and Rotondo, E., Eur. J. Inorg. Chem., 2004,4710-4717.
- Avaji ,P.G.; Kumar, C.H.V., Patil ,S. A, Shivananda, K. N.; Nagaraju, C., Eur. J. Med. chem doi: 10.101.6 /j.ejmech. 03.032, 2009.
- Canpolat, E. and Kaya, M., 2004 J. Coord. Chem. 123.
- Raheem R K.; Fayad A.A., Sci. Revs. Chem. Commun.: 6(3), 2016 37-52.
- Chakravarty, A.R., Nreddy, A. P., Santra, B.K.; Thomas, A.M., J. Indian. Chem. Sci. 2002, 114, 319-401.
- Himaja ,M.; Kailash, R.; Anish, K. V.;Ramana, M.V. ; Karigar, A. A., J. Pham. & Sci. Innv., 2012,1(1)67-70
- Raheem, R. K.; Tawfiq, M.T., Eur. Chem. Bull., 2016, 5(11), 470-478.
- Ferreira, E.I.; Tavares, L.C., Bioorg. Med. Chem. 2002, 10, 557-560.
CrossRef - Anand, K; Gupta, S.; Barhate, V.D, Res. J. of Pharma. Bio. and Chem. Sci., 2012 3,3,10103 -10126.
- Raman, N. ; Sobha , S.; Mitu, L.; J. Saudi Chem. Soc., 2013, 17, 151–159.
CrossRef - Sampath, K. ; Karthik, K.; Sivahari R.; Rasayan J. Chem.2017,10(4), 1184-1188
- Prakash, V.; Suresh, M. S., Res. J. Phar., Bio. & Chem. Sci. 2013,4(4), 1536-1550
Accepted on: January 30, 2018


ISSN Online: 2231-5039

![]()


