Characterization of Jordanian Porcelanite Rock with Reference to the Adsorption Behavior of Lead ions from Aqueous Solution
Jumana K. Abu-Hawwas1, Khalil. M. Ibrahim2 and Salem M. Musleh3
1Department of Earth and Environmental Sciences, Hashemite University, Zarqa, Jordan.
2Department of Earth and Environmental Sciences, Hashemite University, Zarqa, Jordan.
3Department of Chemistry, Al-Balqa Applied University, Salt, Jordan.
Coressponding Author E-mail: smusleh@bau.edu.jo
DOI : http://dx.doi.org/10.13005/ojc/340208
Article Received on : October 09, 2017
Article Accepted on : January 26, 2018
Lead ions were absorbed from aqueous solution by Jordanian porcelanite rock. Adsorption was studied as a function of initial concentration, PH, adsorbent dose and contact time at constant temperature. The equilibrium process was described by Langmuir and Freundlich isotherm model with maximum sorption capacity equal to 19.562 mg g-1, removal efficiency of 95 – 98% at about 40 minute of contact time, with 0.5 g of porcelanite and 10 – 30 ppm concentrations in metallic solutions. The physical and chemical characterization of porcelanite was carried out using X-Ray Fluorescence, X-Ray Diffraction, Scanning Electron Microscope and Thermogravimetry analysis. The specific surface area has also been investigated. The Jordanian porcelanite rock represents an alternative natural adsorbent, since it is a low cost material and has the ability to be used as an adsorbent for the removal of toxic inorganic materials from water.
KEYWORDS:Adsorption; Pb; Porcelanite; Jordan
Download this article as:| Copy the following to cite this article: Abu-Hawwas J. K, Ibrahim K. M, Musleh S. M. Characterization of Jordanian Porcelanite Rock with Reference to the Adsorption Behavior of Lead ions from Aqueous Solution. Orient J Chem 2018;34(2). |
| Copy the following to cite this URL: Abu-Hawwas J. K, Ibrahim K. M, Musleh S. M. Characterization of Jordanian Porcelanite Rock with Reference to the Adsorption Behavior of Lead ions from Aqueous Solution. Orient J Chem 2018;34(2). Available from: http://www.orientjchem.org/?p=44086 |
Introduction
The challenge that Jordan faces today is water scarcity. The fact that Jordan has no regional local sustainable river, shares the surface water resources with neighboring countries. It depends on the precipitation rainfall source lead to classify Jordan as an arid country1.
Heavy metals pose serious environmental problems, especially when discharged from industrial plants as wastewater including batteries manufacturing plants, electroplating industries and detergent factories2. Many heavy metals e.g., Pb, Zn, Cu, Ni, and Sn are highly toxic to human and other living organisms and their presence in surface and underground water above background concentration is undesirable. The removal of heavy metals from water is important to protect public health as natural processes can no longer clean the environment of the enormous quantities of pollutants that are generated daily. There are many processes that can be used to remove heavy metals from wastewaters by addition of anions that cause the precipitation of metals as insoluble salts 3, membrane filtration, coagulation, solvent extraction4 . activated carbon adsorption, co-precipitation.
Porcelanite rock is one of the industrial sedimentary rocks. It has a very high adsorption capacity based on its physical properties represented by the porosity, fineness of pores, and adsorption capacity. The Jordanian porcelanite rock is one of the natural adsorbents because it contains high percentage of amorphous silica reaches 96%. Limited studies focused on the utilization of the porcelanite rock as a raw material in several industrial applications, such as purification or wastewater treatment due to its high removal efficiency and adsorption of the pollutants5.
The main goal of this study is the physical and chemical characterization of Jordanian porcelanite and to investigate the possibility of its utilization as adsorbent for removal of heavy metals from aqueous solutions. This was tested by removing of Pb ions from aqueous media. The equilibrium studies were investigated to observe the effect of various parameters such as initial concentrations, contact time and adsorbent dose at constant temperature and PH. Equilibrium data are attempted by various adsorption isotherms including Langmuir and isotherms in order to select the appropriate isotherm model.
Materials and Methods
Sample preparation
Porcelanite rock was collected from the lower part of the Umm Rijam Chert-Limestone Formation outcropping in central Jordan. The weathered surface was eliminated, crushed by jaw crusher and impurities were removed. Chemical treatments were performed by adding 0.1M HCl and distilled water for 24 hours, dried overnight in an oven at 100°C and stored in a desiccators. Porcelanite was pulverized by the ball mill and washed with excessive amounts of 0.1M HCl and deionized water. Then it was dried at 105°C by using drying oven. Each sample was sieved and the fraction below 100um was collected for adsorption experiments.
Characterization
Adsorption Capacity (AC)
To estimate the cation adsorption capacity, 5g of porcelanite rock was washed with hydrochloric acid for 24 hours, followed by washing with distilled water for 48 hours, and then dried at 60°C for three hours. The sample is then placed in a centrifuge tube, about 30 ml of 1.0 N Na-acetate solution adjusted to pH 8.2 was added, and subjected to shaking for about 15 min, then centrifuged at about 3000 rpm for 10 min, discarded supernatant, another fresh 30 ml of Na-acetate solution was added, shaken, centrifuged, and discarded the supernatant, this step was repeated once more with Na- acetate solution and one more time with 30 ml distilled water. The supernatant solution was finally diluted by a factor that would allow Na determination by a flame photometer.
X–Ray Diffraction (XRD)
X-Ray Diffraction technique was used to characterize porcelanite rock samples. For all samples the X-Ray was measured as a function of the deflection angle in the range of 2- 65 degree with 0.02 stepwise. The d- spacing is specific to the mineral, which is compared with the reference pattern, giving results of the crystalline structure.
X-Ray Fluorescence (XRF)
The chemical composition of the porcelanite samples was analyzed using XRF technique. The samples were prepared by mixing 0.8 g with 7.2 g of Lithium tetra borate in (1:8) ratio. The mixture was heated in fluxer up to 1200 degree to have a molten mixture which is cooled in a platinum casting dish, to get smooth glass surface disc introduced in the radiation chamber6.
Scanning Electron Microscope (SEM)
The porcelanite sample was coated with double face adhesive thin layers of carbon disk on conductive gold tape and put in stub. Abeam of high energy electron is emitted in the SEM to give a magnified picture 5000-7000 times of the original size picture. The cathode used to generate the beam of electrons is tungsten element. Structural and analytical information is obtained by using this technique7.
Thermogravimetric Analysis (TG)
Thermogravimetric curve consists of plateau where the weight is essentially constant, then it changes due to weight losses. Sharp steps and well separated from each other when a series of reactions is taking place at different temperature, they may even overlap, since both the reactions and the removal of the reaction products (which cause the actual weight losses) tend to occur over a range of temperatures8.
Specific Surface Area (BET)
Specific surface area determination has been carried out using nitrogen gas adsorption method via measuring amount of gas adsorbed on the surface of a powder sample as a function of the pressure of the adsorbate gas. Measurements 9are usually performed at the boiling point of liquid nitrogen -196°C.
The measurement was carried out by using volumetric method. The test powder is placed in a sample container with a known volume and the volume of gas adsorbed is determined from the change in pressure associated with the adsorption of gas on the surface of sample powder. The pressure decreases until gas/solid adsorption reaches to a new equilibrium. The volume of gas adsorbed is calculated from the difference between the volumes of adsorbate gas that was introduced and the volume of unabsorbed gas remaining in the void volume, which is measured by using helium either before or after the adsorption measurements are preformed, this will be repeated 3 time to measure the volume adsorbed9 . The specific surface is calculated using BET equation:
BET equation = 1/ [W ((Pₒ/P)-1)] = 1/ (WmC) + (C-1)/ (WmC) (P/Pₒ).
Where, Wm is the weight of adsorbate constituting a mono layer of surface coverage.
Vliq= (PaVadsVm) / (RT).
Pa= pressure.
Vm= molar volume for nitrogen.
T = temperature in Kelvin.
R = 8.314 (gas constant).
Water Treatment:
Removal of Pb+2 from aqueous solution
Stock solution (1000 ppm) of Pb+2 was prepared by dissolving 1.61 g (±0.01 g) of metal salt Pb (NO3)2 in 1000 ml distilled water, and the standard model solutions of 10, 20, 30, 40, 60, 70, 80 and 100 ppm respectively were prepared by appropriate dilution at room temperature (25º C), the developed method from Ho10 was used in the batch adsorption tests, were one kind of heavy metal solution is used (Pb+2). 0.5 g of porcelanite and 30 ml of Pb ion solution which had a 10 ppm concentration are placed in glass tubes (16 samples) at room temperature (25°C) and mixed in the shaker for different times. After complete shaking time, the samples were filtered through gosh crucible number (3) filter and analyzed for Pb ion.
Removal of Pb+2 from car washing wastewater
Two liters of wastewater from car-washing stations were taken and filtered through several steps until reached to the final step of filtration using 0.2 and 0.4 mesh filter. Similar to the other tests, 0.5 g of porcelanite was contacted with 20 ml of car washing wastewater in glass tubes for 10 samples at 37 ₒC temperature, at different time. To carry out the analytical experiment the samples were analyzed for Pb ion on the ICP – OES analyzer, a calibration curve was prepared. Therefor lead standard solution was prepared to get a calibration curve in different concentrations.
The results were expressed as the removal efficiency (% sorption) and adsorption capacity of the adsorbent. The removal efficiency (% sorption) can be defined as:
% sorption = 100 × (C0– Ce)/C0
The adsorption capacity of porcelanite (mg metal/g) was calculated by the following equation: q = (C0– Ce)/S
Where: q: metal ions adsorbed by porcelanite (mg\g); V: volume of metal solution (L);
C0: metal concentration at equilibrium (mg\L); m: mass of porcelanite (g); and S: dosage (m\V).
Results and Discussions
Characterization of Jordanian Porcelanite Rock Sample
The chemical composition is shown in Table 1. The composition is expressed as major oxides, for porcelanite. The SiO2 is the major component for porcelanite which represents 99.14% from the total content, similar to the results obtained by Abu Zaitoon et al.,11. This was expected as the porcelanite is almost pure silica. The impurities include about 0.14% of CaO and 0.15% of Al2O3. These are attributed to insignificant amounts of calcite and clay impurities mainly kaolinite. Loss on ignition is less than 0.76%, which indicates presence of insignificant amounts of humidity and other volatile constituents.
Table 1: Chemical composition of Porcelanite rock sample
| Chemical Component | Wt % |
| SiO2 | 99.15 |
| Al2O3 | 0.15 |
| Fe2O3 | 0.02 |
| TiO2 | 0.08 |
| MnO2 | 0.01 |
| MgO | 0.09 |
| CaO | 0.14 |
| K2O | 0.03 |
| LOI | 0.76 |
The mineralogical component of the porcelanite, as shown in Fig. 1, is mainly quartz. SEM is used to obtain structural information about minerals7.
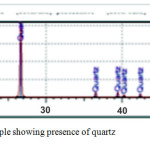 |
Figure 1: XRD analysis for porcelanite rock sample showing presence of quartz (cristobalite and tridymate). |
Fig. 2 shows the SEM micrographs for the porcelanite sample at various resolutions. The micrographs show that porcelanite has a very fine crystal size as in Fig. 2A (50 μm), large surface area as shown in Fig. 2B (10 μm), high porosity according to the micro porous texture and amorphous silica component as show in Fig. 2C (5 μm) and 2D (2 μm). This kind of silica has so fine pores that are having as certain cavities with different sizes for adsorption the suitable metal ions. Fig. 2C shows porcelanite in cristobalite – Opal CT phase as a tetragonal crystal growth at the middle of the very fine amorphous silica, consisted of large blocky particles compared with crystals surrounding them for close-up of morphology of star – shaped clusters. The porcellanite have a different microstructures compared with the diatomite which has honeycomb or cellular structure of microcrystalline silica with Opal –A composition12 .
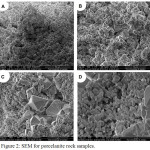 |
Figure 2: SEM for porcelanite rock samples. |
Thermogravimetry is often used to investigate chemical reactions attributed to changes in weight. A typical weight loss step is about 100°C (for 1% to 99% conversion). The step usually develops slowly from the initially horizontal TG curve. The point of inflection is about 60% conversion8 . Fig. 3 shows TG curve of the porcelanite sample, and the Differential Scanning Calorimetry (DSC) curve, the TG curve indicate that the sample has lost about 1.60% after heating up to 430ºC. This very low mass change indicates the stability up to 430ºC and purity of porcelanite. The normalized curve of DSC in Fig. 3, which sets the initial heat capacity as the reference, and scanned across a range of temperature, reveals to a complex peak at 285.4ºC with a width of 143.0ºC and the height equal to 0.02 uV/mg. DSC analysis shows an exothermic process related to temperature increase associated with the sample weight loss. During the exothermic process, heat released from the sample lead to the temperature tensors in the DSC.
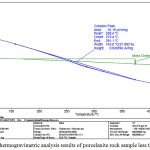 |
Figure 3: Thermogravimetric analysis results of porcelanite rock sample less than 430°C. |
Specific surface area determination of the porcelanite sample indicate that it has a surface area equal to 3.0 m2/g, and pre-volume less than 132.90 nm at P/P° equal to 0.98, as shown in Fig. 4 and 5.
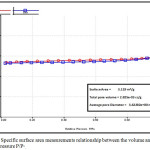 |
Figure 4: Specific surface area measurements relationship between the volume and the relative pressure P/P°. |
The Adsorption Capacity (AC) is a parameter for characterizing ion adsorption. AC values for the porcelanite rock sample was estimated as in equation 1
AC = {Total [Na] in meq/L} × 0.1 ×100/5 cmol (+) / kg 1
Na+ ions concentration is determined by flame photometer method. It is equal to 24.2 meq/L, compensating in the equation, the AC value is equal to 48.4 cmol/kg. This high selectivity of Na+ ions explain the high AC value for porcelanite rock sample and this result support its high removal efficiency.
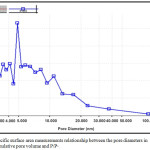 |
Figure 5: Specific surface area measurements relationship between the pore diameters in (nm) and cumulative pore volume and P/P°. |
Removal of Pb+2 from water
Synthetic Wastewater
The capacity of the porcelanite to treat the wastewater loaded with metallic ions was examined under constant temperature (37ºC ±1) and pH 7. Two variables were examined which are: contact time, and weight of adsorbent. The results are shown below.
Effects of Contact Time
The experiments were carried out at constant weight of porcelanite equal to 0.5g and at constant Pb+2 concentration equal to 10 ppm. The shaking time was variable from 2 minutes up to 24 hours. The Pb+2 percentage removal efficiency increased from 66.97%, to 81.51% up to 97.89%, at 2 minutes, 20 minutes and 1-hour contact time respectively. The optimum removal efficiency was 97.56% after 40 minutes of shaking as shown in Fig. 6.
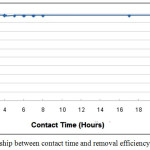 |
Figure 6: The relationship between contact time and removal efficiency%. |
Firstly, the plot reveals that the rate of percent lead removal is higher at the beginning that is probably due to very fine pours of the porcelanite being available at beginning for the adsorption of metals. As the surface adsorption sites become covered, the uptake rate is controlled by the temp of adsorbate which is transported from the exterior to the interior sites of the adsorbent particles. Secondly, the maximum percentage lead removal was attained after less than 1 hour of stirring time; therefore, it does not seem to be much benefit from a stirring time longer than 1 hour.
Effects of Weight
Adsorbent dosage is an important parameter, because it determines the capacity of an adsorbent for a given initial concentration of the adsorbate. The effect of porcelanite weight was studied at constant temperature and fixed pH value by varying the sorbent weight from 5 – 500 mg. 20 ml of Pb solution with 10 ppm concentration was used in the experiments. The removal efficiency percentage varied from 25.89% at the beginning and increased to 33.72% with 50 mg until reached 97.69% with 500 mg of weight of absorbent (porcelanite rock. The results are shown in Fig. 7. It appears that the percentage removal of lead increases proportionally with the weight of porcelanite increase. Most probably due to the greater availability of the adsorption sites at higher weight of the sorbent. This is certainly a capacity effect, as the percentage of metal adsorption on porcelanite is determined by the sorption capacity of the porcelanite.
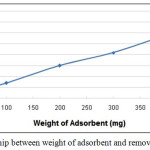 |
Figure 7: The relationship between weight of adsorbent and removal efficiency%. Click here to View figure |
Wastewater from Car Washing Station
Wastewater from car washing station contains many of the toxic metallic ions rather than only one ion as in synthetic lead ions solution. Table 2 show the toxic metallic ions in the pre-treatment car washing station wastewater (origin sample). As it was expected this wastewater contains considerable amounts of the heavy metal. Such as lead, chromium and cobalt and others. Therefore, when the sorbent contacted with this wastewater; a competitive process will be established for the adsorption of the ions on the very fine pours of porcelanite rock. To simulate the results in the previous experiment a 20 ml of the wastewater from car washing station was mixed with a constant weight of adsorbent (porcelanite rock) equal to 0.5 g. The experiment was carried out at different contact time, from 5 minutes to 24 hours. The concentration of lead ions in the origin sample was approximately 2.91 ppm, the removal efficiency increased from about 52% in the beginning to about 71% after 40 minutes. After 6 hours it became 90%, with the maximum adsorption capacity of 94.76% after 24 hours. Fig 8, shows the removal efficiency % of lead ions in the wastewater car wash station using porcelanite rock.
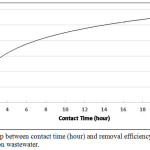 |
Figure 8: Relationship between contact time (hour) and removal efficiency % of porcelanite for car washing station wastewater. Click here to View figure |
Table 2: Heavy metals in the effluent from car washing station
| Metallic Ion | Concentration (ppm) |
| Pb | 2.91 |
| Co | 1 |
| Cr | 1 |
| Zn | 0.52 |
| Fe | 0.4 |
| Mn | 0.24 |
| Cd | 0.03 |
Equilibrium Adsorption Isotherm Models
Langmuir Model
Based on Langmuir model assumption, the surface of porcelanite has a limited number of active sites that lead ions from solute will occupy. The model proposed that interaction among the absorbed molecules is zero. The linear form of the Langmuir equation can be represented by the equation13 :
Ce/qe=(1/b Qmax)+(Ce/Qmax), where: Ce is solute concentration at equilibrium in mg L-1; qe is solute adsorbed per unit mass of sorbent at equilibrium (mg g-1);
Qmax is adsorbate at complete monolayer coverage (mg g-1); and b is a constant shows the heat of adsorption. When the solute prefers the transfer from the solution to the adsorbent surface, the value of b increases. Qmax and b can be found by plotting (Ce/qe) against Ce and then linear curve-fitting of the data.
The constants Qmax and b can be evaluated from the intercept and the slope of the linear plot of 1/qe vs. 1/Ce respectively, and accordingly the Qe, LnQe and LnCe had been calculated. The Langmuir adsorption parameters of the model for adsorption of Pb ions on porcelanite rock under different shaking time (Fig. 9 a) and different porcelanite weight (Fig. 9b) are shown.
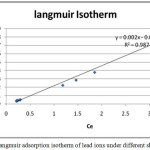 |
Figure 9a: Langmuir adsorption isotherm of lead ions under different shaking time. |
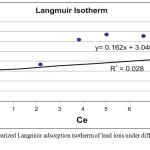 |
Figure 9b: linearized Langmuir adsorption isotherm of lead ions under different weight of adsorbent. |
The separation factor RL is defined by the equation14 :
RL=1/(1+bC0), where C0 is initial metal ion concentration (mg L-1) and b is the Langmuir constant. The RL indicates the isotherm shape as: RL < 1 unfavorable; RL > 1 unfavorable; RL = 1 Linear; 0 < RL < 1 unfavorable and RL = 0 irreversible.
Freundlich Model
The Freundlich model assumes that the uptake of metal ions occurs on a heterogeneous surface by monolayer adsorption. The model can be described by the following equation15,16 : Log Qe =log Kf + n log Ce,
where Kf (mg1-n g-1Ln) is the sorption capacity when equilibrium concentration equals to one.
Kf is the average affinity of the solute toward the solid surface. N is indicator of adsorption refers to the degree of in which sorption depends on equilibrium concentration, surface heterogeneity and adsorption favorability17 . High heterogeneity of the adsorbent surface, higher availability of active sites is shown by lower values of n.
A relatively small slope (n< 1) indicates that adsorption is favorable over the entire studied concentrations range, while a steep slope (n > 1) means that adsorption is favorable at high concentrations, but much less favorable at lower concentrations17 . The values of Kf and n are obtained by plotting log Qe against log Ce and then linear curve- fitting of the resulting plot. The adsorption parameters of Freundlich model for adsorption of lead ions on porcelanite rock are shown in Fig. 10a (variable contact time) and Fig.10b (variable porcelanite weight).
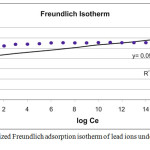 |
Figure 10a: linearized Freundlich adsorption isotherm of lead ions under different time of shaking. |
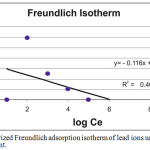 |
Figure 10b: linearized Freundlich adsorption isotherm of lead ions under different weight of adsorbent. |
The Langmuir model was generally better obeyed and best represented results than the Freundlich model, although the R2 values of Langmuir model have generally center around 1. Each of maximum adsorption capacity (Qm) mg/g, the solid and the energy constant related to the heat of adsorption (bkL) were calculated as shown in Table 3.
Table 3: Range of Qm (mg/g), bkL, Kf, n and R2 for Langmuir and Freundlich model for adsorption of lead ions.
| Langmuir Isotherm | Freundlich Isotherm | ||||||
| No | Type of Condition | Qm (mg/g) | bkL | R2 | Kf | n | R2 |
| 1 | Contact time | 100 | 0 | 0.98 | 2 | 0.16 | 0.2 |
| 2 | Wt. of adsorbent | 6.17 | 3 | 0.03 | 0.7 | 0.12 | 0.52 |
Adsorption capacity values for selected sorbents were reported: sawdust- based activated carbon: 2.82 mg g-1; dried sewage sludge: 16.00 mg g-1; baggase fly ash: 13.00 mg g-1; olive pomace: 5.00 mg g-1. These values, prove that porcelanite rock is natural adsorbents and have satisfactory adsorption capacities toward lead ions18.
Conclusions
Chemical composition of porcelanite rock show a small content of inorganic cations (Na+, K+, Mg+2, Ca+2), the major component: SiO2 content reach to 99.15%. The geomorphology of the porcelanite surface showed by SEM a very fine crystal size, large surface area, high porosity due to the microporous texture (amorphous silica), compared to diatomite which their silica seems under scanning electron microscope as honeycomb or cellular structure having composition Opal – A silica.
The X-Ray Diffraction spectrum shows existence of certain amount Quartz and Opal; which are known as irregular interferents between two phases: tridymite and crystoplyte with fine size amorphous silica.
The adsorption capacity and surface area are 48.4 c mol/kg and 3 m2/g respectively. These results reveal its high removal efficiency. Porcelanite has a high thermal stability with a weight change less than 1.60%.
Adsorption of tested metallic pollutants by surfactant porcelanite was best fitted to Langmuir adsorption isotherm more than freundlich; this is due to heterogeneity of the adsorbent surface. The (R) values for natural adsorbent isotherm varies between 0.4 – 1 as a favorable adsorption for metallic pollutants.
The results reveal that Pb ion exhibit strong affinity for adsorbing via porcelanite, where the maximum percentage reaches 95-98%. The suitable adsorption conditions to actualize the maximum sorption must be at about 40 minute of contact time, with 0.5 g of porcelanite, and 10 –30 ppm concentrations in metallic solutions (Pb+2) and about at 1 hour of contact time, with 20 g of porcelanite.
Jordanian porcelanite represents an alternative natural adsorbent as it is a light weight, low-cost rock occurring in huge quantities, and safe for the environment.
Acknowledgment
The authors are grateful to JOSCO Award for Applied Scientific Research, Al-Rajihi Cement Company, The University of Jordan, and Al al-Bayt University for using their analytical facilities.
References
- Haddadin, N.; and Tarawneh, Z. Environmental issues in Jordan, solutions and recommendations, Am. J. Environ. Sci., 2007, 3, 30–36.
CrossRef - Al – Rousan, D. M; Comparison Between Biosorbents for The Removal of Heavy Metal Ions from Aqueous Solutions, Jordan, Faculty of Graded Studies Jordan University of Science and Technology, 2001, 110.
- Abdel-Ghani, N.T.; Hefny, M.; El-Chaghaby, Gh.A.F. Removal of lead from aqueous solution using low-cost abundantly available adsorbents. Int. J. Environ. Sci. Tech., 2007, 4, 67-73.
CrossRef - Singhk, K.; Rastogi R.; and Hassan S.H. Removal of Cr (VI) from wastewater using rice bran, J. Hazard Mater, 2005, 121, 51-58.
- El-Hasan, T.; Al-Anber, Z.; Al-Anber, M.; Batarseh, M.; Al- Nasr, F.; Ziadat, A.; Kato, Y.; Jiries, A. Removal of Zn+2, Cu+2, Ni+2ions from aqueous solution via Tripoli: Simple Component with Single Phase model, Current World Environment, 2008, 3, 01-14.
- Natural Resources Authority, 2011.
- Schuler, F.; and Ghosh, M. Diatomaceous Earth filtration of Cysts and other Particulates Using Chemical Additives, Journal of AWWA, 1990, 82, 67-75.
CrossRef - Zussman, J. Physical Methods in Determinative Mineralogy, second edition, Department of Geology, University of Manchester, England, Academic Press, London, New York, 1977, 720.
- Zielinski, J. M.; Kettle, L. Pharmaceutical Physical Characterization: Surface Area and Porosity, Intertek Pharmaceutical Services, 2013, 5.
- Ho, Y. S. Adsorption of heavy metals from waste streams by natural materials, PhD Thesis, the University of Birmingham, UK, 1995.
- Abu Zaitoon, B.; Yousef, R.; Musleh, S. M. Modification of Jordanian Diatomite and its use for the removal of some organic pollutants from water. Oriental Journal of Chemistry, 2011, 27, 1357 –1374.
- Welton, J. E. SEM Petrology Atlas, Chevron Oil Field Research Company, Methods in Exploration Series, the American Association of Petroleum Geologists, Tulsa, Oklahoma, U.S.A, 2003,74101, 232.
- Langmuir, I. The adsorption of gases on plane surfaces of glass, mica, and platinum, Journal of American Chemical Society, 1918, 40, 1361-1368.
CrossRef - Anirudhan, T. S.; Raji, C. Hydrotalcite as adsorbent for the removal of chromium (VI) from aqueous media: equilibrium studies, Ind. Chem. Technol., 1999, 6, 134–141.
- Sanchez, A. G.; Ayuso, E. A.; De Blas, O. J. Sorption of heavy metals from industrial wastewater by low cost mineral silicates, Clay Minerals, 1999, 34, 469-477.
CrossRef - Freundlich, H. M. Liberdie adsorption in Losungen, Zeitschrift fur physikalische chemistry, 1906, 57, 385-470.
- Frimmel, F. H.; Huber, L.; Influence of humic substances on the aquatic sorption of heavy metals on defined minerals phases, Environment International, 1996, 22, 507 – 517.
CrossRef - Aravindhan, R.; Rao, J. R.; Nair, B. U. Application of a chemically modified green macro alga as a biosorbent for phenol removal, Journal of Environmental Management, 2009, 90, 1877 -1883.
CrossRef

This work is licensed under a Creative Commons Attribution 4.0 International License.
![]()
A New Edition of Web of Science
Journal Impact Factor
2022: 0.5
Five Year: 0.8
Journal is Indexed in

Cabells Whitelist
![]()


