Bioaccumulation of Trace Metals in Selected Vegetable Crops around Tummalapalle Uranium Mine in Kadapa District, Andhra Pradesh
S. Kulavardhana Reddy, C. Sivanandha Reddy and Gopireddy Venkata Subba Reddy
Department of Chemistry, JNTUA College of Engineering (Autonomous), Pulivendula, YSR (Kadapa) dist, A. P, India 516 390.
Corresponding Author E-mail: gopireddy.chemistry@jntua.ac.in
DOI : http://dx.doi.org/10.13005/ojc/340260
Article Received on : August 19, 2017
Article Accepted on : January 01, 2018
The present investigation was carried out to evaluate trace metals concentration in soils and vegetable crops growing in agricultural fields around Tummalapalle uranium mining area, Pulivendula, Kadapa Dist, Andhra Pradesh. For this study the cultivated crops such as Capsicum annuum (Green chilli), Solanum melongena (Brinjal), Solanum lycopersicum (Tomato), Abelmoschus esculentus (Okra) and Arachis hypogea (Ground nut) were selected. Soil and plant samples were evaluated for trace elements by using Inductive Coupled Plasma Optical Emission spectroscopy (ICP-OES). As for the estimated data, the concentrations of trace metals in ground nut and vegetables are found in the range of 0.14-1.2 mg/kg for B, 46-58.12 mg/kg for Ca, 0.49-3 mg/kg for Cu, 40.6-69.36 mg/kg for Fe, 76.84-91.72 mg/kg for K, 12.64-25.28 mg/kg for Mg, 0.51-2.1 mg/kg for Mn, 0.16-2.56 mg/kg for Mo, 20.85-25.2 mg/kg for P, 0.34-0.8 mg/kg for Zn, 0.3-0.64 mg/kg for Pb and 0.01-0.02 mg/kg for Se. BAF (Bioaccumulation Factor) TF(Translocation Factor) and BAC(Bioaccumulation Coefficient), remained considered for the evaluation of movement of trace elements from soil to shoot, root to shoot and soil to entire plant. Solanum melongena (B, Zn) and Solanum lycopersicum (Mn, Mo) plants showed high TF values from roots to the shoots. These plants are appropriate for phytoextraction. The BAF data shows that all considered plants were excluders (< 1) and good accumulators (1-10) for all metals except Mo. But whereas BAC reveals that, all studied plants can be considered as hyper accumulators (> 10) for Mo, P and Zn.
KEYWORDS:Trace Metals; Vegetable Plants; Translocation Factor; Bioaccumulation Factor; Bioaccumulation Coefficient
Download this article as:| Copy the following to cite this article: Reddy S. K, Reddy C. S, Reddy G. V. S. Bioaccumulation of Trace Metals in Selected Vegetable Crops around Tummalapalle Uranium Mine in Kadapa District, Andhra Pradesh. Orient J Chem 2018;34(2). |
| Copy the following to cite this URL: Reddy S. K, Reddy C. S, Reddy G. V. S. Bioaccumulation of Trace Metals in Selected Vegetable Crops around Tummalapalle Uranium Mine in Kadapa District, Andhra Pradesh. Orient J Chem 2018;34(2). Available from: http://www.orientjchem.org/?p=43840 |
Introduction
The resolve of trace metals in diet is a main task for nutritionist, environmentalist and experts for good health of living systems including human being. The water, soil, and food may also be contaminated with trace metals due to higher level practice of chemicals, pesticide sprays, stabilizers, industrialization, mining activities, fertilizers, etc. The food contamination by trace metals is one of the best significant features of food eminence 1. Toxic elements can be very dangerous even at low levels when consumed over an extensive period of time. The necessary metals may also generate harmful effects when metal consumption is too higher amounts 2.
The role of trace metals in body metabolism is of major importance. Their lack causes diseases, whereas their presence in additional may result in toxicity to human life. The cultivated vegetable plants in polluted soils can easily absorb trace metals, as well as the exposed metals from polluted environments simply deposits on different parts of the vegetables3. Vegetable plants growing in contaminated medium can accumulate high levels of trace elements to cause severe health problems to buyers 4.
Vegetables and fruits are called the defensive complementary food. They are composed of extraordinary amounts of minerals, carbohydrates, vitamins, dietary fibers and essential amino acid, which are required for strong working condition of human metabolic reactions. They are also vital to neutralize the acid formed in stomach during digestion, besides being useful fiber according to food specialists 5. Throughout the last spans in worldwide food safety is a major public concern, due to the increasing demand for food safety. It has stimulated research on risk associated with intake of products polluted by pesticides, heavy metals and/or toxins 6.
The heavy metals transfer from soils to plants is one of the basic paths for disclosure of humans via food chain. It is essential to measure the transfer of metals from soil to vegetable plants for subsequent use in replication prototypes 7. The uptake of metals by roots depends on speciation of metal and soil faces and nature of plant varieties etc. Accordingly, the mobility and availability of metals for plants are major when estimating the effect of soil contamination on plant metal uptake, translocation and ultra-structural variations 8.
The objective of the present study is to assess the concentration of trace and heavy metals in soil and their accumulation by transfer into selected plants (vegetables, nuts, and fruits) grown in around mining area, and to estimate related health problems on human due to intake of these edible parts as diet.
Materials and Methods
Study Area
The study area, Tummalapalle uranium mining is positioned between latitude 14◦18’36” N longitude 78◦15’16”E and latitude 14◦20’20”N longitude 78◦18’03.3”E permitting to investigation of India Toposheet Nos. 57 J/3 and 57 J/7. The selected agricultural fields (Five) are located around mining area. The selecting fields are shown in Table 1 and Fig.1 as site I to site V.
Table 1: Sampling locations around Uranium mining area
|
S. No |
Name of the location |
Latitude |
Longitude |
|
1 |
Mabbuchinthalapalle (Site I) |
140 20’ 34.92’’ N |
780 14’ 40.32’’ E |
|
2 |
Mabbuchinthalapalle (Site II) |
140 19’ 45.84’’ N |
780 14’ 17.76’’ E |
|
3 |
Rachakuntapalle (Site III) |
140 18’ 39.60’’ N |
780 17’ 48.30’’ E |
|
4 |
Bhumayagaripalle (Site IV) |
140 19’ 24.54’’ N |
780 18’ 03.48’’ E |
|
5 |
Bhumayagaripalle (Site V) |
140 19’ 37.74’’ N |
780 19’ 12.60’’ E |
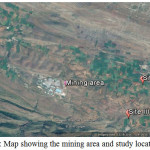 |
Figure 1: Map showing the mining area and study locations Click here to View figure |
Sample Collection and Treatment
The soil samples were collecting from a depth of 0-15 cm in selected agricultural fields. The collected soil samples were taken in polyethylene container for transportation to the laboratory. Soil samples were mixed to homogeneous mixture and dried in the laboratory for two days. Then the samples were dried in a hot air oven at 110°C for 4-5 hours to remove the total moisture content in soil. Then the dried samples were crushed and grounded into 2 mm mesh size.
The plant samples were collected from the identified fields. The selected fields were cultivated with Capsicum annuum (Green chilli), Solanummelongena(Brinjal), Solanumlycopersicum (Tomato), Abelmoschusesculentus (Okra) and Arachis hypogea (Ground nut) crops. The plant samples were taken in polyethylene containers from fields and transferred into laboratory. The collected plant samples cleaned with distilled water to remove the dust particles and plant parts separate into the roots, stems, leaves, and fruits. Separated plant parts are shade dried in laboratory for 48 hours. The plant parts are placed in hot air oven for 5-6 hours at 100°C to remove excess moisture content. The plant parts are taken from oven crushed and ground into 2mm mesh using commercial blender. The prepared plant powders are stored in polyethylene bags, for the further usage of acid digestion. 1 gram of arid normalized soil sample was digested with 10 ml concentrated HNO3 and 70% concentrated HClO4 for approximately 30-40 min using hotplate. Dried plant samples of 0.5 grams were assimilated with 10 ml concentrated HNO3 and 2-4 ml 70% concentrated HClO4. Later freezing at 25°C, the digest was filtered into 100 ml volumetric flack by Whatman No. 42 filter paper and made up to the mark with distilled water. The blank solution also prepared in the same procedure 9.
Sample Analysis
The pH of soil samples was measured by pH instrument (electrode method). The physico-chemical properties such as pH, texture, EC and organic matter were done by using standard methods. The trace metal concentration was determined for both soil and plant samples using Inductively Coupled Plasma-Optical Emission Spectroscopy (ICP-OES; Model Perkin Elmer 7000DV).
Translocation Factor (TF)
It is representing transfer of metals from roots to above the root parts of plant (shoots), was calculated as the relative concentration of metals in shoots to those in the roots 10, 11, as fallows
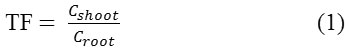
Where Cshoot and Croot are metal attentions in the shoot (mg/kg) and root of plant (mg/kg), singly. TF>1 designates that the plant successfully transfer trace metals from the roots to the shoots 12.
Bioaccumulation Factor (BAF)
BAF is resolute for measurable appearance of metal accumulation with stem, leaves and fruit (plant shoot) from the soil13.

Where Cshoot and Csoil are metal concentration in the plant parts (stem, leaves, fruit) (mg/kg) and soil (mg/kg) correspondingly. The BAF values of plants are characterized as excluder (<1.0), accumulator (1.0-10.0) and hyper- accumulator (>10.0) respectively 14.
Bioaccumulation Coefficient (BAC)
This is considered as the percentage of metal concentration in total plant (roots, stems, leaves and fruits) to the outside medium, such as soil, to enumerate metal buildup strongly in plants 15.

Where Cplant is trace metal levels in plant parts (mg/kg) and Csoil is level of trace metal in soil (mg/kg), correspondingly. On the origin of BAC value as shown in table.2, four classes of trace metal accumulation in plants are proposed16:
Table 2: Bioaccumulation coefficient (BAC) ranges
| S.No |
Bioaccumulation coefficient (BAC) range |
Type of plant |
| 1 |
<0.01 |
non-accumulator |
| 2 |
0.01-0.1 |
low accumulator |
| 3 |
0.1-1.0 |
moderate accumulator |
| 4 |
1.0-10.0 |
high accumulator or hyper-accumulator |
Results and Discussion
Soil Properties
The collected all the soil samples from different locations were studied for physical parameters such as texture, pH, electrical conductivity and organic matter using chemical and instrumental methods by following standard protocols 17. The collected data is presented in Table 3.
Table 3: Soil Physical parameters
|
Site Name |
Texture |
pH |
Electrical conductivity(dS.m-1) |
Organic matter (%) |
| Site-I |
Clay loam |
9.08 |
0.60 |
0.91 |
| Site-II |
Sandy clay loam |
8.95 |
0.52 |
0.56 |
| Site-III |
Clay loam |
9.19 |
0.58 |
0.40 |
| Site-IV |
Clay loam |
9.01 |
0.47 |
0.64 |
| Site-VMEANSD |
Clay loam —- —— |
9.12 9.07 0.09 |
0.53 0.54 0.05 |
0.87 0.67 0.21 |
From the experimental data, the soil pH found to be 8.95-9.19 shows that the fields are moderately alkaline nature. It influences the soil greater retention of metals and trace metal solubility 16. Further, alkaline nature enhance the mobility of metals due to OH− precipitation, CO32- or unsolvable organic complexes development 18 which may maximum uptake of trace metals and transfer into plant parts. The electrical conductivity (EC) of soil range is found to be 0.47-0.60 dS.m-1. The EC estimate the concentration of soluble salts in the soil, like positive ions (cations) Na+, Mg2+, Ca2+, and negative ions (anions) Cl–, SO42-& HCO3–. A good soil EC level will be somewhere above 0.2 dS.m-1and below 1.2 dS.m-1 19. In this study the EC values were found to within the range. Organic matter is an important to soil structure and for nutrient retention and cycling values which is found to be 0.40-0.91. Soil texture will influences soil organic matter by affects on plant growth (inputs) and protection from decomposition (outputs).
Trace metals in selective fields (Soil)
All the digested soil samples were subjected to ICP-OES technique for trace metals estimation and the evaluated data is presented in Table 4.
Table 4: Metal concentration in soil (mg/kg)
|
B |
Ca |
Cu |
Fe |
K |
Mg |
Mn |
Mo |
P |
Zn |
As |
Cd |
Pb |
Se |
Tl |
|
| Site-I |
0.36 |
94.48 |
5.17 |
360 |
134.4 |
42.24 |
2.24 |
0.11 |
3.45 |
0.15 |
0 |
0 |
0.02 |
0 |
0 |
| Site-II |
0.32 |
99.08 |
4.2 |
290 |
110.24 |
37.24 |
1.76 |
0.13 |
4.62 |
0.13 |
0 |
0 |
0.09 |
0 |
0 |
| Site-III |
0.3 |
124.62 |
3.59 |
194 |
96.5 |
33.08 |
1.96 |
0.14 |
3.24 |
0.16 |
0 |
0 |
0.11 |
0 |
0 |
| Site-IV |
0.22 |
108.72 |
2.48 |
296 |
72.64 |
56 |
2.24 |
0.11 |
3.03 |
0.13 |
0 |
0 |
0.12 |
0 |
0 |
| Site-V |
0.42 |
78.7 |
6.42 |
201.12 |
119.6 |
32.72 |
2.5 |
0.14 |
8 |
0.3 |
0 |
0 |
0.1 |
0 |
0 |
| MEAN |
0.32 |
101.12 |
4.37 |
268.22 |
106.67 |
40.25 |
2.14 |
0.12 |
4.47 |
0.17 |
0 |
0 |
0.09 |
0 |
0 |
| SD |
0.07 |
17.03 |
1.5 |
70.14 |
23.5 |
9.6 |
0.28 |
0.01 |
2.06 |
0.06 |
0 |
0 |
0.03 |
0 |
0 |
The trace metal concentrations are found to be in the following range, B: 0.22-0.42 mg/kg; Ca: 78.7-124.62 mg/kg; Cu: 2.48-6.42 mg/kg; Fe: 194-360 mg/kg; K: 72.64-134.4 mg/kg; Mg: 32.72-56 mg/kg; Mn: 1.76-2.5 mg/kg; Mo: 0.11-0.14 mg/kg; P: 3.03-8 mg/kg; Zn: 0.3-0.16 mg/kg; and Pb: 0.02-0.12 mg/kg; the Cd, As, Se and Tl are not present in the selected sites. The average amount of the trace metals were, B: 0.32 mg/kg; Ca: 101.12 mg/kg; Cu: 4.37 mg/kg; Fe: 268.22 mg/kg; K: 106.67 mg/kg; Mg: 40.25 mg/kg; Mn: 2.14 mg/kg; Mo: 0.12 mg/kg; P: 4.47 mg/kg; Zn: 0.17 mg/kg and Pb: 0.09 mg/kg. The fashion of the normal levels of trace metals is: Fe > K >Ca> Mg > P > Cu >Mn> B > Zn > Mo >Pb.
The literature reported 20 values for boron was 20 mg/kg in soils is considered to be more toxic to the crop plants. Therefore, all the sights under investigation are found to lower level of boron as compared with literature value and hence not found any toxicity. The Ca levels in soils of all the sights under investigation are sufficiently available and found to within the range as compared with KARI (Kenya Agricultural Research Institute) reported 21 values of 2-400 mg/kg calcium. The trace elements such as Cu, Zn and Pb values are found to very low concentration in all studied fields when compare with literature 22 values and hence, they are considered as deficient. Fe and K concentration levels are found to good and sufficiently available in all studied fields which were comparable with literature values 23, 24. The Mg mean concentration values are found to moderate concentration available in all examined fields 25. Obtained manganese mean concentration values were not abundant in selected fields compared with USEPA 26 literature value. The mean concentrations of Mo in all examined fields are found to lower than literature reported values 27 and hence it is considered as deficient. The phosphorus mean concentration levels are moderately available in studied fields compared with literature reported value of FAO 28 norms.
The correlation investigation is a bivariate process which is useful to define the relation among two dissimilar metals. The great correlation coefficient (r = higher than 0.7) demonstrations strong correlation among two metals 29. Person Correlation coefficient data for trace metals in soils are depicted in Table. 5.
Table 5: Coefficients of Pearson Correlation (r) among trace metals in soil
| B | Ca | Cu | Fe | K | Mg | Mn | Mo | P | Zn | Pb | |
| B | 1 | ||||||||||
| Ca | -0.74 | 1 | |||||||||
| Cu | 0.99* | -0.81 | 1 | ||||||||
| Fe | -0.2 | -0.14 | -0.14 | 1 | |||||||
| K | 0.86* | -0.61 | 0.85* | 0.23 | 1 | ||||||
| Mg | -0.74 | 0.17 | -0.64 | 0.59 | -0.57 | 1 | |||||
| Mn | 0.39 | -0.58 | 0.48 | -0.08 | 0.16 | 0.13 | 1 | ||||
| Mo | 0.46 | -0.008 | 0.37 | -0.89 | 0.1 | -0.86 | -0.12 | 1 | |||
| P | 0.78* | -0.79 | 0.80* | -0.47 | 0.4 | -0.54 | 0.5 | 0.57 | 1 | ||
| Zn | 0.76* | -0.66 | 0.79* | -0.58 | 0.36 | -0.52 | 0.70* | 0.57 | 0.91* | 1 | |
| Pb | -0.43 | 0.34 | -0.45 | -0.69 | -0.81 | 0.075 | -0.08 | 0.44 | 0.11 | 0.11 | 1 |
From Coefficients of Pearson Correlation (r) data reveal that a strong relation was observed between B & Cu (r = 0.99) as well as between P & Zn (r = 0.91).Similarly high correlation was observed between B-K, B-P, B-Zn, Cu-K, Cu-P, Cu-Zn and Mn-Zn. The remaining metals show weak correlation with other metals, signifying that metals derive into the soil from various types of pollutants like pesticides, fertilizers, manures, and air particles from mining.
Accumulation of Trace Metals with Plants
The trace metals concentration was found in plant samples from cultivated sites and data summarized in Table 6. In this study, we collected and analyzed 20 samples from selecting fields. The dissimilarities of the metal contents observed in these vegetables depend on the nature of the soil (physical and chemical) and fascination capability of each metal by the plant, which is altered by countless environmental and human issues and nature of the plant 30.The concentration of different metals in various parts of the plants is discussed below.
Table 6: Concentration of trace metals (mg/kg) in different vegetable plants
|
Plants |
Plant Parts |
B |
Ca |
Cu |
Fe |
K |
Mg |
Mn |
Mo |
P |
Zn |
As |
Cd |
Pb |
Se |
Tl |
|
Mirchi |
Roots |
1.2 |
48.8 |
3.78 |
58.8 |
74 |
23.4 |
5.6 |
3 |
29.8 |
1.4 |
0 |
0 |
0.7 |
0.16 |
0 |
|
|
Stem |
1.16 |
72 |
4.2 |
62 |
84 |
24 |
6.8 |
3.8 |
31.2 |
1 |
0 |
0 |
0.024 |
0.1 |
0 |
|
|
Leaf |
0.92 |
50 |
3.2 |
59.6 |
77.4 |
20.6 |
5 |
3 |
27 |
1.28 |
0 |
0 |
1.08 |
0.12 |
0 |
|
|
Fruit |
1.08 |
58.12 |
3 |
69.36 |
88.18 |
25.28 |
2.1 |
2.04 |
25.2 |
0.8 |
0 |
0 |
0.64 |
0.01 |
0 |
|
|
Mean |
1.09 |
57.23 |
3.54 |
62.44 |
80.89 |
23.32 |
4.87 |
2.96 |
28.3 |
1.12 |
0 |
0 |
0.61 |
0.097 |
0 |
|
|
SD |
0.12 |
10.68 |
0.54 |
4.8 |
6.38 |
1.97 |
1.99 |
0.72 |
2.7 |
0.27 |
0 |
0 |
0.43 |
0.063 |
0 |
|
Brinjal |
Roots |
0.1 |
61 |
2 |
36 |
82 |
16 |
1.36 |
0.4 |
23.04 |
0.24 |
0 |
0 |
0.1 |
0.01 |
0 |
|
|
Stem |
0.2 |
56.8 |
1.8 |
51.2 |
71.2 |
10.6 |
1.08 |
1.04 |
25.2 |
0.3 |
0 |
0 |
0.05 |
0.016 |
0 |
|
|
Leaf |
0.04 |
42.1 |
0.38 |
62 |
66.4 |
19 |
0.6 |
0.54 |
20.18 |
0.6 |
0 |
0 |
0.078 |
0.008 |
0 |
|
|
Fruit |
1.2 |
52 |
1.06 |
47.8 |
78 |
20 |
1.5 |
0.16 |
22 |
0.56 |
0 |
0 |
0.04 |
0.02 |
0 |
|
|
Mean |
0.38 |
52.97 |
1.31 |
49.25 |
74.4 |
16.4 |
1.13 |
0.53 |
22.6 |
0.42 |
0 |
0 |
0.067 |
0.013 |
0 |
|
|
SD |
0.54 |
8.12 |
0.74 |
10.7 |
6.95 |
4.22 |
0.39 |
0.37 |
2.09 |
0.18 |
0 |
0 |
0.02 |
0.005 |
0 |
|
Tomato |
Roots |
0.17 |
40.76 |
0.37 |
37.52 |
76.04 |
12.28 |
0.44 |
0.84 |
21.38 |
0.43 |
0 |
0 |
0.036 |
0.01 |
0 |
|
|
Stem |
0.12 |
49.4 |
0.39 |
36.63 |
49.4 |
12.87 |
1.42 |
2.53 |
21.88 |
0.29 |
0 |
0 |
0.018 |
0.01 |
0 |
|
|
Leaf |
0.13 |
44.68 |
0.39 |
34.6 |
68.64 |
12.03 |
0.82 |
1.38 |
21.92 |
0.35 |
0 |
0 |
0.022 |
0.014 |
0 |
|
|
Fruit |
0.14 |
47.72 |
0.8 |
40.6 |
76.84 |
12.64 |
1.42 |
2.56 |
21.45 |
0.47 |
0 |
0 |
0.038 |
0.018 |
0 |
|
|
Mean |
0.14 |
45.64 |
0.48 |
37.33 |
67.73 |
12.45 |
1.02 |
1.82 |
21.65 |
0.38 |
0 |
0 |
0.028 |
0.013 |
0 |
|
|
SD |
0.023 |
3.79 |
0.2 |
2.49 |
12.76 |
0.37 |
0.48 |
0.85 |
0.28 |
0.08 |
0 |
0 |
0.009 |
0.003 |
0 |
|
Okra |
Roots |
0.12 |
47 |
0.67 |
34.16 |
79.4 |
13.78 |
0.71 |
1.05 |
24.6 |
0.55 |
0 |
0 |
0.022 |
0.01 |
0 |
|
|
Stem |
0.19 |
43.8 |
0.44 |
39.68 |
78.56 |
20.6 |
0.6 |
1.2 |
22.26 |
0.41 |
0 |
0 |
0.036 |
0.014 |
0 |
|
|
Leaf |
0.14 |
47.72 |
0.64 |
38.62 |
77.4 |
13.02 |
0.79 |
1.19 |
25.09 |
0.53 |
0 |
0 |
0.036 |
0.008 |
0 |
|
|
Fruit |
0.23 |
46 |
0.49 |
45.08 |
84.08 |
19.69 |
0.51 |
1.09 |
20.85 |
0.34 |
0 |
0 |
0.034 |
0.02 |
0 |
|
|
Mean |
0.17 |
46.13 |
0.56 |
39.38 |
79.86 |
16.77 |
0.65 |
1.13 |
23.2 |
0.45 |
0 |
0 |
0.032 |
0.013 |
0 |
|
|
SD |
0.049 |
1.7 |
0.11 |
4.48 |
2.93 |
3.92 |
0.12 |
0.074 |
1.99 |
0.01 |
0 |
0 |
0.006 |
0.005 |
0 |
|
Ground Nut |
Roots |
0.24 |
47.44 |
0.39 |
40.56 |
92.12 |
19.63 |
0.73 |
0.94 |
25.45 |
0.38 |
0 |
0 |
0.042 |
0.014 |
0 |
|
|
Stem |
0.24 |
45.24 |
0.42 |
30.26 |
82.56 |
18.85 |
1.02 |
1.25 |
22.08 |
0.39 |
0 |
0 |
0.044 |
0.014 |
0 |
|
|
Leaf |
0.21 |
44.84 |
0.39 |
35.13 |
90.8 |
19.7 |
0.66 |
0.1 |
23.14 |
0.3 |
0 |
0 |
0.034 |
0.016 |
0 |
|
|
Fruit |
0.25 |
49.48 |
0.61 |
48.49 |
91.72 |
20.97 |
1.04 |
1.43 |
23.92 |
0.35 |
0 |
0 |
0.046 |
0.018 |
0 |
|
|
Mean |
0.23 |
46.75 |
0.45 |
38.61 |
89.3 |
19.78 |
0.86 |
0.93 |
23.64 |
0.35 |
0 |
0 |
0.041 |
0.015 |
0 |
|
|
SD |
0.017 |
2.14 |
0.1 |
7.81 |
4.52 |
0.87 |
0.19 |
0.58 |
1.41 |
0.04 |
0 |
0 |
0.005 |
0.001 |
0 |
Boron
Boron (B) is a micronutrient necessary for plant growth. It is a module of plant cell walls and reproductive structures. The mean concentration of boron in plants classes in the following reducing order: Mirchi (1.09 mg/kg) >Brinjal (0.385 mg/kg) >Ground nut (0.23 mg/kg) >Okra (0.17 mg/kg) > Tomato (0.14 mg/kg) was found. The highest mean concentration of boron (1.09 ± 0.12 mg/kg) was observed in Capsicum annuum (green chilli) at site I and lowest mean concentration (0.14 ± 0.023 mg/kg) in Solanum lycopersicum (tomato) at site III. Gunes et al., 31 reported B concentration is greater than 20 mg/kg appears to be toxic in plant tissues. From the literature reported value, boron concentration in studied planted tissues is within the safe limits and some of the plants are found to deficient.
Calcium
Calcium is a secondary nutrient that is critical to crop growth. It is required in large quantities by all plants for the development of cell walls and cell membranes, and it plays a vital role in soil structure. The mean concentration of calcium in plants species of Mirchi (57.23 mg/kg) >Brinjal (52.97 mg/kg) >Ground nut (46.75 mg/kg) > Okra (46.13 mg/kg) > Tomato (45.64 mg/kg) are found in the following decreasing order. The maximum mean concentration of calcium (57.23 ± 10.68 mg/kg) was found in Capsicum annuum (green chilli) at site I and minimum mean concentration (45.64 ± 3.79 mg/kg) in Solanum lycopersicum (tomato) found at site III. The calcium levels at different regions namely Nigeria, Ethiopia and Pakistan 32 are found to 248.6 mg/kg, 170-320 mg/kg and 22-32 mg/kg respectively. The experimental obtained values in these study areas are above and below the limits of literature reported values.
Copper
Copper is a micronutrient in plants and an important constituent, in small amounts, of the human diet. It is a naturally occurring element in the soil and it can be found as a metal or in a variety of ores. The accumulated average Cu levels found in following decreasing order in plants classes: Mirchi (3.54 mg/kg) >Brinjal (1.31 mg/kg) >Okra (0.56 mg/kg) > Tomato (0.48 mg/kg) > Ground nut (0.45 mg/kg). The obtained mean concentration of copper (3.54 ± 0.54 mg/kg) in Capsicum annuum (green chilli) highest value found at site I and the lowest mean concentration (0.45 ± 0.1 mg/kg) in Arachis hypogaea (ground nut) observed at site V. These values are lower than literature values of Indian Standards 33 [Cu: 30 mg/kg], Pivic RN 34 and FAO/WHO 35 [Cu: 40 mg/kg]. The normal Cu concentrations in plants are found to 3–15 mg/kg and the poisonous level if its concentration is 20 mg/kg. Therefore, Cu levels are found to below the normal values in all the selected sites and deficient and such trend is more likely to be seen in plants grown in sandy, alkaline soils.
Iron
Iron is essential for crop growth and food production, even though only small amounts are required compared to some of the other nutrients such as nitrogen, phosphorus, and potassium. The mean concentration of iron was found in plant types in the following reducing order: Mirchi (62.44 mg/kg) > Brinjal (49.25 mg/kg) >Okra (39.38 mg/kg) > Ground nut (38.61 mg/kg) > Tomato (37.83 mg/kg). The low and high levels of Fe were found (37.33 ± 2.49 mg/kg) in Solanum lycopersicum (tomato) at site III and (62.44 ± 4.8 mg/kg) Capsicum annuum (green chilli) at site I. According to WHO and FAO, the recommended level of iron in plants is 20 mg/kg and 450 mg/kg respectively 35, 36. So, the experimental reported values in all the selective sites are higher the permissible limits and lower the acceptable level when compare with literature value.
Potassium
Potassium is essential for healthy plant growth and is deemed. It plays important roles in photosynthesis and plant food formation as well as transport and storage of plant food. The potassium means concentration in plant types in falling order: Ground nut (89.3 mg/kg) >Mirchi (80.89 mg/kg)>Okra (79.86 mg/kg) >Brinjial (74.4 mg/kg) > Tomato (67.73 mg/kg). The highest (89.3 ± 4.52 mg/kg) and lowest levels (67.73 ± 12.76 mg/kg) of potassium was found in Arachis hypogaea at site V and Solanum lycopersicum (tomato) at site III, respectively. These values were found to lower than the reported values (223 mg/kg) in papaya fruit and within the limits in vegetables of all the sites under investigation 37.
Magnesium
Magnesium is a macronutrient that is necessary to both plant growth and health. It is a constituent of chlorophyll so is required for photosynthesis. It is also a component of many plant enzymes and aids in their function. However, the most important role of magnesium is as the central atom in the chlorophyll molecule. Magnesium concentration of mean values in following decreasing order: Mirchi (23.32 mg/kg) > Ground nut (19.78 mg/kg) >Okra (19.69 mg/kg) >Brinjal (16.4 mg/kg) > Tomato (12.45 mg/kg). The maximum average concentration of magnesium (23.32 ± 1.97 mg/kg) in Capsicum annuum (green chilli) found at site I and lowest mean concentration (12.45 ± 0.37 mg/kg) in Solanum lycopersicum (tomato) found at site III. These Mg values are found to lower than the reported 32 values in all the vegetables of selected sites.
Manganese
Manganese (Mn) is an important plant micronutrient. It plays important role in various biological systems including photosynthesis, respiration, and nitrogen assimilation. Manganese mean concentration in plant species following decreasing order: Mirchi (4.87 mg/kg) >Brinjal (1.13 mg/kg) > Tomato (1.025 mg/kg) > Ground nut (0.86 mg/kg) >Okra (0.65 mg/kg). The concentration levels of Mn in vegetable samples is found to highest in Capsicum annuum (green chilli) (4.87 ± 1.99 mg/kg) at site I and (0.65 ± 0.12 mg/kg) in Abelmoschus esculentus (Okra) at site IV found to lowest concentration. These values are found to very lower the permissible limits with the literature reported 38 values.
Molybdenum
Molybdenum is a trace mineral important for plants and animals. In plant growth, it helps in the nitrogen, oxygen and sulfur cycles. The mean concentration of molybdenum in plant species in decreasing order: Mirchi (2.96 mg/kg) > Tomato (1.82 mg/kg) >Okra (1.13 mg/kg) > Ground nut (0.93 mg/kg) >Brinjal (0.53 mg/kg). Obtained minimum concentration of Mo (2.96 ± 0.72 mg/kg) in Capsicum annuum (green chilli) at site I and maximum concentration (0.53 ± 0.37 mg/kg) in Solanum lycopersicum (tomato) at site III. The take out values in this study within the normal range compared with literature reported 39 values.
Phosphorous
Phosphorus is an important macro-element, necessary for plant nourishment and it contributes in metabolic processes. The accumulated average P concentrations in the following decreasing order were found in plant species: Mirchi (28.3 mg/kg) > Ground nut (23.64 mg/kg) >Okra (23.2 mg/kg) >Brinjal (22.6 mg/kg) > Tomato (21.65 mg/kg). The highest phosphorus mean concentration (28.3 ± 2.7 mg/kg) in Capsicum annuum (green chilli) at site I and lowest concentration (21.65 ± 0.28 mg/kg) in Solanum lycopersicum (tomato) found at site III. These experimental values are found to higher than literature values 40 in all the sites under investigation.
Zinc
Zinc (Zn) is an essential micronutrient for plant life. It is important for production of plant growth hormones and proteins and is involved in sugar consumption. The accumulated normal Zn levels were initiate in vegetable plants in the following falling direction: Mirchi (1.12 mg/kg) >Okra (0.45 mg/kg) >Brinjal (0.42 mg/kg) > Tomato (0.38 mg/kg) > Ground nut (0.35 mg/kg). The highest (1.12 ± 0.27 mg/kg) mean concentration of Zn in Capsicum annuum (green chilli) found at site I and in Arachis hypogaea found at site V is lowest concentration (0.35 ± 0.04 mg/kg). The obtained values are very low levels in vegetables compared with literature reported 33, 35, 41 values in all sites under investigation.
Lead
The accumulated normal Pb deliberations were found in following decreasing order in plant classes: Mirchi (0.61 mg/kg) >Brinjal (0.067 mg/kg) > Ground nut (0.041 mg/kg) >Okra (0.032 mg/kg) > Tomato (0.028 mg/kg). The maximum (0.61 ± 0.43 mg/kg) and minimum (0.028 ± 0.009 mg/kg) levels of Pb was found in Capsicum annuum (green chilli) at site I and in Solanum lycopersicum (tomato) at site III respectively. These experimental values are found to within the permissible limits when compare with literature 41, 42 values except in green chilli in all the study area.
Selenium
Selenium (Se) is an important micronutrient for humans and animals, but lead to harmfulness when taken in too much quantity. In animals, Se acts as an antioxidant and supports in reproduction, immune responses, thyroid hormone metabolism. The Se concentration levels in plant kinds in the following falling order: Mirchi (0.097 mg/kg) > Ground nut (0.015 mg/kg) >Brinjal (0.013 mg/kg) > Tomato (0.013 mg/kg) >Okra (0.013 mg/kg) were found. The highest mean concentration of Se (0.097 ± 0.063 mg/kg) in Capsicum annuum (green chilli) found at site I and lowest mean concentration (0.013 ± 0.003 mg/kg) in Solanum lycopersicum (tomato) found at site III. These values are in good agreement comparable with literature values and found to within the permissible limits 43 in study area.
According to Sharma and Raju 29, the great correlation coefficient (r= higher than 0.7) expressions durable correlation among two dissimilar metals. Among the studied trace metals, B-Ca and B-Zn; Ca-Cu, Ca-Fe, Ca-Mg, Ca-Mn, Ca-P, Ca-Zn and Ca-Pb; Cu-Fe, Cu-Mn, Cu-P, Cu-Zn and Cu-Pb; Fe-Mg, Fe-P, Fe-Zn and Fe-Pb; Mg-P; Mn-Zn and Mn-Pb; P-Pb and Zn-Pb shows strong positive correlation (Table 7). Based on this the remaining elemental pairs exposed no major correlation with other elements.
Table 7: Pearson Correlation coefficients (r) among trace metals in edible parts
| B | Ca | Cu | Fe | K | Mg | Mn | Mo | P | Zn | Pb | Se | |
| B | 1 | |||||||||||
| Ca | 0.81 | 1 | ||||||||||
| Cu | 0.67 | 0.94 | 1 | |||||||||
| Fe | 0.64 | 0.92 | 0.94 | 1 | ||||||||
| K | -0.08 | 0.28 | 0.24 | 0.52 | 1 | |||||||
| Mg | 0.6 | 0.71 | 0.64 | 0.85 | 0.7 | 1 | ||||||
| Mn | 0.68 | 0.88 | 0.85 | 0.69 | -0.05 | 0.31 | 1 | |||||
| Mo | -0.45 | 0.06 | 0.28 | 0.13 | 0.08 | -0.29 | 0.29 | 1 | ||||
| P | 0.43 | 0.83 | 0.75 | 0.85 | 0.7 | 0.73 | 0.66 | 0.24 | 1 | |||
| Zn | 0.78 | 0.93 | 0.95 | 0.83 | -0.01 | 0.5 | 0.92 | 0.18 | 0.62 | 1 | ||
| Pb | 0.54 | 0.88 | 0.97 | 0.96 | 0.39 | 0.68 | 0.75 | 0.35 | 0.78 | 0.87 | 1 | |
| Se | -0.4 | -0.84 | -0.94 | -0.91 | -0.43 | -0.58 | -0.77 | -0.52 | -0.83 | -0.82 | -0.97 | 1 |
Translocation Factor (TF)
Translocation factor (TF) values are given in Table 8. According to Baker and Brooks 12, the higher TF value in any plant of any metal designates the greater association with the plant parts. All metals are shown high TF values in studied plant species, except As, Cd and Tl. In this study Solanum melongena influenced very great TF value for B and Zn. Solanum lycopersicum also great TF value for Mn and Mo. Yoon et.al, 42, reported that plant types with great TF values were measured appropriate for phyto extraction, which commonly needs actual transfer of metals in plant portions (stem, leaves, and fruit). The process of elimination of the pollutants from the soil is known as phytoextraction without any disturbance to the soil structure and fertility.
Table 8: Translocation factor (TF) values for trace metals in vegetable plants
|
Plant types |
B |
Ca |
Cu |
Fe |
K |
Mg |
Mn |
Mo |
P |
Zn |
As |
Cd |
Pb |
Se |
Tl |
|
Mirchi |
2.63 |
3.69 |
2.75 |
3.24 |
3.37 |
2.98 |
2.48 |
2.94 |
2.79 |
2.2 |
0 |
0 |
2.49 |
1.43 |
0 |
|
Brinjal |
14.4 |
2.47 |
1.62 |
4.47 |
2.62 |
3.1 |
2.33 |
4.35 |
2.92 |
6.08 |
0 |
0 |
1.68 |
4.4 |
0 |
|
Tomato |
2.3 |
3.47 |
4.26 |
2.97 |
2.56 |
3.05 |
8.15 |
7.71 |
3.05 |
2.58 |
0 |
0 |
2.16 |
4.2 |
0 |
|
Okra |
4.66 |
2.92 |
2.34 |
3.61 |
3.02 |
3.86 |
2.67 |
3.3 |
2.77 |
2.34 |
0 |
0 |
4.81 |
4.2 |
0 |
|
Ground nut |
2.89 |
2.94 |
3.65 |
2.8 |
2.87 |
3.03 |
3.68 |
2.95 |
2.71 |
2.74 |
0 |
0 |
2.95 |
3.42 |
0 |
Bioaccumulation Factor (BAF)
The BAF values of dissimilar plants for each metal shown in Table 9. The data suggested that total plants are excluders (BAF is <1), accumulators (BAF 1-10), hyper accumulators (BAF>10) of all metals. The studied metals are excluders with Mirchi, except of Fe. The Cu and Fe are excluders; B, Ca, K, Mg, Mn and Pb are good accumulators; Mo, P and Zn are hyper accumulators with Brinjal. The Cu, Fe and Pb are excluders; B, Ca, K, Mg, Mn, and Zn are good accumulators; Mo and P are hyper accumulators with Tomato. The Cu, Fe, Mg, Mn and Pb are excluders; B, Ca, K and Zn are accumulators; Mo and P are hyper accumulators with Okra. Cu and Fe are excluders; B, Ca, K, Mg, Mn, P, Zn and Pg are accumulators; Mo is hyper accumulate with ground nut.
Table 9: Bio-accumulation factor (BAF) values for trace metals in vegetable plants
|
Plant types |
B |
Ca |
Cu |
Fe |
K |
Mg |
Mn |
Mo |
P |
Zn |
As |
Cd |
Pb |
Se |
Tl |
|
Mirchi |
0.11 |
0.52 |
0.49 |
1.88 |
0.53 |
0.6 |
0.161 |
0.012 |
0.041 |
0.05 |
0 |
0 |
0.01 |
0 |
0 |
|
Brinjal |
4.44 |
1.52 |
0.77 |
0.55 |
1.95 |
1.33 |
1.79 |
12.98 |
14.55 |
11.06 |
0 |
0 |
1.78 |
0 |
0 |
|
Tomato |
1.31 |
1.13 |
0.44 |
0.57 |
2.01 |
1.13 |
1.86 |
43.78 |
20.12 |
6.99 |
0 |
0 |
0.69 |
0 |
0 |
|
Okra |
2.57 |
1.26 |
0.64 |
0.41 |
3.3 |
0.95 |
0.85 |
30.65 |
22.48 |
9.37 |
0 |
0 |
0.86 |
0 |
0 |
|
Ground nut |
1.7 |
1.77 |
0.22 |
0.56 |
2.21 |
1.81 |
1.09 |
19.98 |
8.64 |
3.52 |
0 |
0 |
1.24 |
0 |
0 |
Bioaccumulation Coefficient (BAC)
The BAC values in Table 10 appearance that Mirchi was moderate accumulator of Ca, Cu, Fe, K, Mg and Mn in fruit, Pb in stem; hyper accumulator of B, Mn, Mo, P, Zn and Pb. Brinjal moderately accumulate with Ca, Cu, Fe, K, Mg, Mn, B except in fruit and Pb except in root, hyper accumulator with Mo, P and Zn. Tomato plant is moderately accumulate with B, Ca, Cu, Fe, K, Mg, Mn and Pb; hyper accumulate with Mo, P and Zn. The Okra plant moderately accumulate with Ca, Cu, Fe, Mg, Mn, Pb and B except in fruit; hyper accumulate with K, Mo, P and Zn. The ground nut plant moderately accumulate with B, Ca, Cu, Fe, K, Mg, Mn and Pb; hyper accumulate with P, Zn and Mo except in leaf.
Table 10: Bioaccumulation coefficient (BAC) values for trace metals in different vegetable plants
|
Plant types |
Plant parts |
B |
Ca |
Cu |
Fe |
K |
Mg |
Mn |
Mo |
P |
Zn |
As |
Cd |
Pb |
Se |
Tl |
|
Mirchi |
Root |
3.26 |
0.51 |
0.73 |
0.16 |
0.55 |
0.55 |
2.49 |
27.27 |
8.63 |
9.09 |
0 |
0 |
25 |
0 |
0 |
|
|
Stem |
3.15 |
0.76 |
0.81 |
0.17 |
0.62 |
0.56 |
3.02 |
34.54 |
9.04 |
6.49 |
0 |
0 |
0.85 |
0 |
0 |
|
|
Leaf |
2.5 |
0.52 |
0.61 |
0.16 |
0.57 |
0.48 |
2.22 |
27.27 |
7.82 |
8.31 |
0 |
0 |
38.57 |
0 |
0 |
|
|
Fruit |
2.93 |
0.61 |
0.57 |
0.19 |
0.65 |
0.59 |
0.93 |
18.54 |
7.3 |
5.19 |
0 |
0 |
22.85 |
0 |
0 |
|
Brinjal |
Root |
0.3 |
0.61 |
0.47 |
0.12 |
0.74 |
0.42 |
0.76 |
2.98 |
4.97 |
1.81 |
0 |
0 |
1.06 |
0 |
0 |
|
|
Stem |
0.61 |
0.57 |
0.42 |
0.17 |
0.64 |
0.28 |
0.61 |
7.76 |
5.44 |
2.27 |
0 |
0 |
0.53 |
0 |
0 |
|
|
Leaf |
0.12 |
0.42 |
0.09 |
0.21 |
0.6 |
0.51 |
0.33 |
4.02 |
4.36 |
4.54 |
0 |
0 |
0.82 |
0 |
0 |
|
|
Fruit |
3.7 |
0.52 |
0.25 |
0.16 |
0.7 |
0.53 |
0.84 |
1.19 |
4.75 |
4.24 |
0 |
0 |
0.42 |
0 |
0 |
|
Tomato |
Root |
0.57 |
0.32 |
0.1 |
0.19 |
0.78 |
0.37 |
0.22 |
5.67 |
6.59 |
2.7 |
0 |
0 |
0.32 |
0 |
0 |
|
|
Stem |
0.4 |
0.39 |
0.11 |
0.18 |
0.51 |
0.38 |
0.72 |
17.09 |
6.74 |
1.83 |
0 |
0 |
0.16 |
0 |
0 |
|
|
Leaf |
0.43 |
0.35 |
0.11 |
0.17 |
0.71 |
0.36 |
0.41 |
9.35 |
6.76 |
2.22 |
0 |
0 |
0.19 |
0 |
0 |
|
|
Fruit |
0.48 |
0.38 |
0.22 |
0.2 |
0.79 |
0.38 |
0.72 |
17.33 |
6.61 |
2.93 |
0 |
0 |
0.33 |
0 |
0 |
|
Okra |
Root |
0.55 |
0.43 |
0.27 |
0.11 |
1.09 |
0.24 |
0.31 |
9.26 |
8.1 |
3.99 |
0 |
0 |
0.18 |
0 |
0 |
|
|
Stem |
0.87 |
0.4 |
0.18 |
0.13 |
1.08 |
0.36 |
0.26 |
10.56 |
7.33 |
2.98 |
0 |
0 |
0.29 |
0 |
0 |
|
|
Leaf |
0.66 |
0.43 |
0.25 |
0.13 |
1.06 |
0.23 |
0.35 |
10.47 |
8.27 |
3.88 |
0 |
0 |
0.29 |
0 |
0 |
|
|
Fruit |
1.03 |
0.42 |
0.2 |
0.15 |
1.15 |
0.35 |
0.22 |
9.62 |
6.87 |
2.49 |
0 |
0 |
0.27 |
0 |
0 |
|
Ground nut |
Root |
0.58 |
0.6 |
0.06 |
0.2 |
0.77 |
0.6 |
0.29 |
6.76 |
3.18 |
1.28 |
0 |
0 |
0.42 |
0 |
0 |
|
|
Stem |
0.57 |
0.57 |
0.06 |
0.15 |
0.69 |
0.57 |
0.4 |
8.98 |
2.76 |
1.33 |
0 |
0 |
0.44 |
0 |
0 |
|
|
Leaf |
0.51 |
0.56 |
0.06 |
0.17 |
0.75 |
0.6 |
0.26 |
0.78 |
2.89 |
1 |
0 |
0 |
0.34 |
0 |
0 |
|
|
Fruit |
0.61 |
0.62 |
0.09 |
0.24 |
0.76 |
0.64 |
0.41 |
10.22 |
2.99 |
1.18 |
0 |
0 |
0.46 |
0 |
0 |
Conclusion
The study was conducted on metal accumulation and transfer rate among five selective farming crops around the Tummalapalle Uranium mining area. Solanummelongena (B, Zn) and Solanumlycopersicum (Mn, Mo) plants showed high TF values from roots to the shoots. From BAF all scrutinized plants were excluders and good accumulators for all metals excluding Mo. BAC values shows that all studied plants are hyper accumulators of Mo, P and Zn. The results showed that all the trace metals are found to within the limits as per FAO/WHO, EU and Indian standards. But high concentration of Pb was observed in mirchi (0.61 mg/kg). The experimental reported values indicate that all studied vegetables and nuts for trace elements are acceptable for human intake.
Acknowledgement
The authors greatly acknowledged TEQIP-II, MHRD, Govt. of India for providing financial assistance vide reference Proc.No.JNTUACEP/TEQIP-II/TA/01/2014 dated 31.07.2014 in the form of research assistance ship to carry out this research work.
References
- Sharma. R.K, Agarwal. M, Marshall. F.M, Heavy metals in vegetables collected from production and market sites of a tropical urban area of India, Food Chem. Toxicol. 2009, 47, 583–591.
CrossRef - Falandysz. J, Frankowska. A, Mazur. A, Mercury and its bio concentration factors in King Bolete (Boletus edulis), Bull. Fr. J. Environ. Sci.Health, 2007, 42 2089–2095.
CrossRef - Sobukola O. P, Adeniran. O.M., Odedairo. A. A and Kajihausa. O. E, “Heavy metal levels of some fruits and leafy vegetables from selected markets in Lagos, Nigeria.” African Journal of Food Science, 2010 4(2): 389 – 393.
- Ahmad K; Z. Khan; M; Ashraf, E.E.Valeem; Z.A. Shah and L. R. Mcdowell. “Determination Of Forage Concentrations Of Lead, Nickel And Chromium In Relation To The Requirements Of Grazing Ruminants In The Salt Range”, Pakistan. Pakistan Journal of Botany, 2009, 4 (1):61-65.
- Hashmi DR, Ismail S and Shaikh GH, Assessment of the level of trace metals in commonly edible vegetables locally available in the markets of Karachi city. Pakistan Journal of Botany, 2007, 39(3): 747-751.
- Mello. D, JPF Food safety: Contaminants and toxins. Cambridge, CABI Publishing, 2003 32-65.
- Hough, R.L., S.D. Young, and N.M.J. Crout. “Modeling of Cd, Cu, Ni, Pb and Zn Uptake, by Winter Wheat and Forage Maize, from a Sewage Disposal Farm.” Soil Use and Management, 2003 19: 19-27.
CrossRef - Sresty T. V. S., MadhavaRao K. V, Ultrastructural alterations in response to zinc and nickel stress in the root cells of pigeon pea, Environmental and Experimental Botany, 1999, 41(1): 3-13.
CrossRef - Noor-ul Amin and Tauseef ahmad. Contamination of soil with heavy metals from industrial effluents and their translocation in green vegetables of Peshawar, Pakistan. Roy. Soci. of chemi., 2015, 5: 14322-14329
- Liu CW, Chen YY, Kao YH, Maji SK. Bioaccumulation and translocation of arsenic in the ecosystem of the Guandu wetland, Taiwan. Wetlands 2014, 34(1): 129-140.
CrossRef - Malik RN, Husain SZ and Nazir I, Heavy metal concentration and accumulation in soil and wild plant species from industrial area of Islamabad, Pakistan. Pak J Bot 2010, 42(1): 123-127.
- Baker A.J.M and Brooks R.R. Terrestrials higher plants which hyper accumulate metallic elements: a review of their distribution, ecology and phytochemistry. J. of Biorecovery, 1989, 1: 81-126.
- Deram A, Denayer F, Petit D and Haluwyn CV, Seasonal variations of cadmium and zinc in Arrhenatherumelatius, a perennial grass species from highly contaminated soils. Environ pollut. 2006, 140: 62-70.
CrossRef - Ma LQ, Komar KM. Tu C, Zhang W, Cai Y, Kenelly ED, A fern that hyper accumulates arsenic. Nature 2001, 409: 579-582.
CrossRef - Zayed A, Gowthaman S, Terry N, Phytoaccumulation of trace elements by wetland plants, Duckweed. J Environ qual 1998 27: 715-721.
CrossRef - Sekabira K, Oryem-Origa H, Mutumba G, Kakudidi E and Basamba TA, Heavy metal phytoremediation by commelinabenghalensis (L) and cynodondactylon (L) growing in urban stream sediments. Int J Plant PhysiolBiochem 2011, 3(8): 133-142.
- George Estefan, Rolf Sommer, and John Ryan. Soil, Plant and Water Analysis – ICARDA, third edition, 2013, 1-244.
- Smith CJ, Hopmans P, Cook FJ, Accumulation of Cr, Pb, Cu, Ni, Zn and Cd in soil following irrigation with untreated urban effluents in Australia. Environ Pollut. 1996, 94(3): 317–323.
CrossRef - Jitender Kumar Verma, Asha Sharma, Paramanick K.K, to evaluate the values of electrical conductivity and growth parameters of apple saplings in nursery fields. Int. Journal of Applied Sciences and Engineering Research. 2015, 4(3): 321-332.
- Nable, R.O., Banuelos, G.S., and Paul, J.G. Boron toxicity. Plant and Soil 193, (1997), 181–198.
CrossRef - Preston Akenga, Ali Salim, Anam Onditi, Amir Yusuf and Walyambillah Waudo. Determination of selected micro and macronutrients in sugarcanegrowing soils at Kakamega North District, Kenya. IOSR Journal of Applied Chemistry, 2014, 7(7): 34-41.
CrossRef - EU 2002 Heavy metals in wastes (European Commission DG ENV. E3 report). http://ec.europa.eu/environment/waste/studies/pdf/heavy_metalsreport.pdf
- Kabata-Pendias, A., &Pendias, H. Guidline for Fe concentration for food safety. Safe levels of iron to prevent renal toxicity of human subjects. Journal of Nutrition 2010, 77: 791-1174.
- Daniel E Kaiser, Carl J. Rosen, and John A. Lamb, Potassium for Crop Production: Nutrient management, University of Minnesota, 2016, 1-9. http://www.extension.umn.edu/agriculture/nutrient-management
- Mehlich A.: New extractant for soil test evaluationof phosphorus, potassium, magnesium, calcium, sodium, manganese and zinc. Commun. Soil. Sci. Pl.Anal., 1978, 9: 477–492.
CrossRef - USEPA 2010. Risk-based Concentration Table. United State Environmental Protection Agency, Washington, DC.
- Pauline L. Smedley and David G. Kinniburgh, Molybdenum in natural waters: A review of occurrence, distributionsand controls. Applied Geochemistry, 2017, 1, 1-46.
- FAO 1976. A Framework for Land Evaluation. FAO Bulletin 32, FAO/UNESCO, France.
- Sharma MSR, Raju NS, Correlation of heavy metal contamination with soil properties of industrial areas of Mysore, Karnataka, India by cluster analysis. Int Res J Environ Sci. 2013 2(10): 22–27.
- Zurera, G., Moreno, R., Salmeron, J., &Pozo, R. Heavy metal uptake from greenhouse border soils for edible vegetables. Journal of the Science of Food and Agriculture, 1989 49, 307-314.
CrossRef - Gunes, A., Soylemezoglu, G., Inal, A., Bagci, E.G., Coban, S., and Sahin, O. Antioxidant and stomata responses of grapevine (Vitisvinifera L.) to boron toxicity. Scientia Horticulturae, 2006, 110, 279–284.
CrossRef - TesfayeHailemariam, AmareAregahegn, Tariku Bekele, AlleMadhusudhan. Investigation of the Levels of Selected Metals in Edible andMedicinal Fruits Grown in Dilla, Ethiopia. Res J. Chem. Environ. Science, 2015, 3(4), 44-53.
- Awashthi SK 2000 Prevention of food adulteration Act no. 37 of 1954, central and state rules as amended for 1999. Ashoka Law House, New Delhi.
- Pivic RN, Sebic ABS, Josic DL, Assessment of soil and plant contamination by select heavy metals along a major European highway. Pol J Environ Stud 2013, 22: 1465–1472
- FAO/WHO 2007 Joint FAO/WHO food standard programme codex alimentarius commission (Report of the thirty eight session of the codex committee on food hygiene). Houston, USA. ftp://ftp.fao.org/codex/Reports/Alinorm07/al30/13.
- Afzal Shah, Abdul Niaz, NazeefUllah, Ali Rehman, Muhammad Akhlaq, Muhammad Zakir, Muhammad Suleman Khan ;et a. “Comparative Study of Heavy Metals in Soil and Selected Medicinal Plants”, Journal of Chemistry, 2011, 20(13), 1-6.
- O.I. Oloyede. Chemical Profile of Unripe Pulp of Carica papaya. Pakistan Journal of Nutrition, 2005, 4(6), 379-381.
CrossRef - D. Kostova, V. Kanazirska and M. Kamburova. A comparative analysis of different vegetable crops for contentof manganese and molybdenum. Agronomy Research, 2008, 6(2), 477–488.
- Long XX, Yang XE, Ni WZ, Ye ZQ, He ZL, Calvert DV, Stoffella JP. Assessing zinc thresholds for phytotoxicity and potential dietary toxicity in selected vegetable crops. Commun Soil Sci Plant Anal 2003, 34(9, 10): 1421–1434. Doi: 10.1081/CSS-120020454.
CrossRef - Chinese Department of Preventive Medicine, Threshold for Food Hygiene. Beijing: China Standard Press 1994 (In Chinese).
- Codex Alimentarius Commission (FAO/WHO). Food additives and contaminants. Joint FAO/WHO Food Standards Program 2001; ALINORM 01/12A:1-289.
- Yoon J, Cao X, Zhou Q, Ma LQ (2006) Accumulation of Pb, Cu, and Zn in native plants growing on a contaminated Florida site. Sci Total Environ 2006, 368(2–3): 456–464.
CrossRef - Hartikainen, H., T.L. Xue and V. Piironen, Selenium as an anti-oxidant and pro-oxidant in ryegrass. Plant Soil, 2000, 225: 193-200.
CrossRef

This work is licensed under a Creative Commons Attribution 4.0 International License.
![]()
A New Edition of Web of Science
Journal Impact Factor
2022: 0.5
Five Year: 0.8
Journal is Indexed in

Cabells Whitelist
![]()


