Synthesis and Investigation of Electrical Properties of Carbon Nanotube – Porous Matrix Composites near the Percolation Threshold
Andrey Varfolomeev1,2, Valentin Solovey1, Ivan Volkov1 and Thomas Maeder1,3
1Moscow Institute of Physics and Technology, Dolgoprudny, Moscow region, Russia.
2NRC “Kurchatov Institute”, Moscow, Russia.
3École Polytechnique Fédérale de Lausanne, Lausanne, Switzerland.
Corresponding Author E-mail: volkov256@yandex.ru
DOI : http://dx.doi.org/10.13005/ojc/340102
The composites based on single-walled carbon nanotubes (single-walled CNTs or SWCNTs) embedded in porous matrices with different structures were prepared and studied by using the impedance spectroscopy. The contributions of intra-CNT and inter-CNT conduction mechanisms in the composites were evaluated at various contents of SWCNTs from the analysis of their impedance spectra. The electrical percolation thresholds for the composites studied were determined by taking into account the tunneling through the potential barriers between SWCNTs.
KEYWORDS:Single-Walled Carbon Nanotubes; Porous Matrix Composites; Carbon Nanotube Based Dispersions; Impedance Spectroscopy; Conduction Mechanisms; Percolation Threshold
Download this article as:| Copy the following to cite this article: Varfolomeev A, Solovey V, Volkov I, Maeder T. Synthesis and Investigation of Electrical Properties of Carbon Nanotube – Porous Matrix Composites near the Percolation Threshold. Orient J Chem 2018;34(1). |
| Copy the following to cite this URL: Varfolomeev A, Solovey V, Volkov I, Maeder T. Synthesis and Investigation of Electrical Properties of Carbon Nanotube – Porous Matrix Composites near the Percolation Threshold. Orient J Chem 2018;34(1). Available from: http://www.orientjchem.org/?p=43351 |
Introduction
Carbon nanotubes (CNTs) have been intensively investigated due to their combination of outstanding mechanical and electrical characteristics, extremely large interfacial contact area, high aspect ratio, and low mass density. CNTs are considered as the ideal fillers for the composite materials in many cases. The use of CNTs as a filler embedded into various polymer matrices is one of the most promising applications of CNTs, because they can improve and/or impart new properties even at low loadings in the composite (< 1 wt. %)1. Recently, the composites in which CNTs are combined with glass microfibers were suggested and investigated2-4. The local content of CNTs in these composites can be much higher than the average content in the overall material due to their localization on the surface of the fibers. Thus, the conduction paths are influenced by a structure of the fibrous matrix and the conduction threshold can be reduced significantly as compared to the traditional CNT-based polymer composites.
The percolation theory predicts the following dependence of the conductivity σ of the composite on the filler content φ:
σ = σ0·(φ – φc)t (1)
Usually, the experimental results are presented as log σ versus log (φ – φc) and the percolation threshold φc is found from the corresponding linear fitting. The critical exponent t depends on the system dimensionality with calculated values of t ≈ 1.33 for two and t ≈ 2 for three dimensions. Fitting Eq. (1) to experimental data for CNTs/ polymer composites usually yields value of t equal to about 2 in many cases1,2. On the other hand, this approach does not take into account tunneling through the potential barriers between CNTs. It was shown that the variation in the polymer matrix composition causes much higher changes in the conductivity of a composite than that of the filler. This can be explained by the very strong dependence of the tunneling between CNTs1. From this point of view, the method of impedance spectroscopy can serve a useful tool for the detailed analysis of a mechanism of charge transport in the nanocomposites4,5. The impedance spectroscopy allows one to separate the contributions of intrinsic charge transport within CNTs (intra-CNT conductivity) and the charge transport through the potential barriers between CNTs (inter-CNT conductivity)4. In the present paper, we demonstrate that such an approach makes it possible to determine the percolation threshold in the nanocomposites more accurately.
Experimental
Two types of CNT-based composites with different structures of matrices were prepared. The composite of the first type (composite I) represents glass microfiber matrix with deposited single-walled CNTs (SWCNTs)-based nanofibers. The synthesis of this composite is described in details in paper4. Shortly, the water based dispersions with different concentrations of SWCNTs were prepared by using sonication and centrifugation processes. In these dispersions, the sodium dodecylbenzene sulfonate (SDBS) was used as a dispersant and the polyvinyl alcohol (PVA) as a bonding agent. One milliliter of each dispersion was uniformly dispensed over the area of glass microfiber filter paper (Whatman borosilicate glass, GF/F grade) with the diameter of 30 mm by using micropipette. The content of SWCNTs in the obtained samples was ranging from 0.06 to 1.1 wt. %.
The composite of the second type (composite II) represents MF-Millipore membrane (mixed cellulose esters, 0.45 μm pore size) with deposited SWCNT/polymer material. First, the isopropanol based dispersions with different concentrations of SWCNTs were prepared by using sonication and centrifugation processes as described in paper4. In these dispersions, the polyvinyl butyral (PVB) was used as a dispersant and a bonding agent. The single droplets of each dispersion with the diameter of about 5 mm were ejected from the micropipette onto the surface of porous membrane. The content of SWCNTs in the obtained samples was ranging from 0.1 to 10 wt. %.
The structure of the fabricated composites was studied by scanning electron microscopy (SEM) with the use of JEOL JSM-7001F and transmission electron microscopy (TEM) with the use of Zeiss Leo-912 AB Omega.
In order to evaluate the contributions of intra-CNT and inter-CNT conduction mechanisms in the nanocomposites, the method of impedance spectroscopy was utilized. The frequency dependences of impedance parameters (impedance modulus |Z| and phase angle θ) were measured at room temperature in the frequency range from 20 Hz to 2 MHz by means of high precision RLC-meter Agilent E4980A. The analysis of impedance spectra was implemented by using EIS Spectrum Analyser program7.
Results and Discussion
The typical SEM images of the composite I are presented in Fig. 1 (a, b). The glass microfibers are displayed as randomly oriented cylindrical objects with the diameter in the range from 0.3 to 5 μm. The deposited material is represented by fine nanofibers with the diameter below 50 nm, which are spread over the surface of majority of glass microfibers; in some areas between microfibers, the nanofibers are coupled together into a branched network.
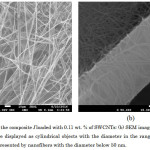 |
Figure 1a: SEM image of the composite I loaded with 0.11 wt. % of SWCNTs; (b) SEM image of its single microfiber. Click here to View figure |
The glass microfibers are displayed as cylindrical objects with the diameter in the range from 0.3 to 5 μm. The deposited material is represented by nanofibers with the diameter below 50 nm.
The typical SEM image of the cross section of the composite II is presented in Fig. 2a. The deposited material forms quite solid layer with the depth of localization in the porous membrane of about few microns. The TEM image of the fragment of the same sample is presented in Fig. 2b.
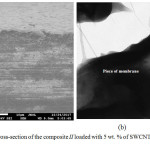 |
Figure 2a: SEM image of the cross-section of the composite II loaded with 5 wt. % of SWCNTs; (b) TEM image of its fragment. Click here to View figure |
The impedance spectra of all samples were simulated with the use of equivalent circuit comprising R1 resistor connected in series with the parallel-connected R2 resistor and the constant phase element (CPE) (Fig. 3). The impedance of CPE is represented as 1/(A(iω)n), where i is the imaginary unit, ω = 2πf, A and n are fitting parameters. The origin of CPE may result from the lognormal time constantdistribution due to the hopping conductivity8. The resistances of R1 and R2 correspond to the intra-CNT dc resistivity (ρs) and inter-CNT dc resistivity (ρp) of the composite, respectively. The intra-CNT resistivity is specified by the mobility and the concentration of delocalized charge carriers in CNTs. The inter-CNT resistivity depends on the parameters of potential barriers between CNTs in the polymer matrix. Due to the inter-CNT conduction mechanism, the conduction paths in the composites exist below the percolation threshold.
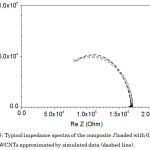 |
Figure 3: Typical impedance spectra of the composite I loaded with 0.06 wt. % of SWCNTs approximated by simulated data (dashed line). Click here to View figure |
The conductivity due to the tunneling between nanoparticles can be described by the following dependence9:
σ = σs·exp(–2x/λ) or 1 + ρp/ρs = exp(2x/λ), (2)
where σs = 1/ρs and σ = 1/(ρp + ρs), x – gap between particles, λ – decay length of the electron wave function. Also we can write for the gap between the particles:
x = 2(rc – r) = 2r·[(Vc/V)1/3 – 1], (3)
where r and V are the radius and the corresponding volume of a single particle, rc – critical radius of percolation for a single particle, Vc – critical volume of a single particle corresponding to the percolation threshold. Also according to the percolation model, the next condition is valid above the percolation threshold: if r > rc and V > Vc, then x = 0 and the inter-CNT resistivity is equal to zero (ρp = 0). As a result, we obtain:
1 + ρp/ρs = exp(4r·[(Vc/V)1/3 – 1] / λ) = exp(4r·[(φc/φ)1/3 – 1] / λ). (4)
Here φ is the content of CNTs in the composite. In this work, Eq. (4) was used for the determination of the percolation threshold φc with 4r/λ as a fitting parameter.
The values of ρs and ρp were determined from the measured impedance spectra. Fig. 4 (a, b) presents ρs and ρp as functions of the content of CNTs in the composites I and II. The intra-CNT resistivity can be fitted by the power law ρs = 4.54·φ–1.96 in the case of the composite I (Fig. 4a). The value of the critical exponent t = 1.96 coincides well with the common value of t ≈ 2 observed for many CNT-based polymer composites1. The inter-CNT resistivity ρp becomes negligible and the transition to the intra-CNT conductivity occurs at a content of SWCNTs of about 0.2 wt. % in this case. On other hand, ρs does not depend on the content of CNTs in the case of composite II (Fig. 4b). Such an unusual behavior implies that only a fixed number of CNTs can form the intra-CNT resistivity in the porous matrix.
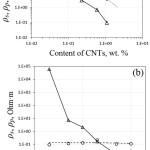 |
Figure 4: Dependences of intra-CNT resistivity (ρs – circles) and inter-CNT (ρp – triangles) resistivity on the content of CNTs in the composite I (a) and II (b). Click here to View figure |
The dependences of the (1 + ρp/ρs) on the content of CNTs in the composites I and II are presented in Fig. 5 (a, b), respectively. The fitting results obtained by using Eq. (4) are shown by dashed curves. It should be noted that better fitting can be achieved if (φc/φ) term is used in Eq. (4) instead of the (φc/φ)1/3 one. Such a behavior assumes that the number of CNTs in the conduction paths increases linearly as a function of the content of CNTs in the composites studied. The percolation threshold can be clearly observed on these plots as a content of CNTs at which (1 + ρp/ρs) is equal to 1. The values of the percolation threshold φc found from the fittings are equal to 0.24 wt. % (composite I) and 3 wt. % (composite II). Since the parameters of the barriers between CNTs effect only on the exponent of the exponential function in Eq. (4), large difference in the percolation thresholds for the composites I and II can be explained by different structures of porous matrices of these two composites.
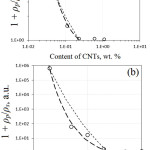 |
Figure 5: Dependences of the (1 + ρp/ρs) on the content of CNTs in the composites I (a) and II (b). Click here to View figure |
Fitting results are calculated by using Eq. (4) (short-dashed curves) and the modified Eq. (4), in which (φc/φ)1/3 term is substituted by the (φc/φ) one (long-dashed curves). The values of the percolation threshold φc are equal to 0.24 wt. % (a) and 3 wt. % (b).
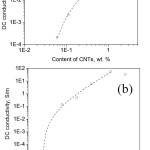 |
Figure 6: Dependences of dc conductivity on the content of CNTs in the composite I (a) and II (b) presented as log-log plot and the corresponding fitting results (dashed line) calculated by using Eq. (1). Click here to View figure |
For comparison, the percolation thresholds were also determined with the use of Eq. (1). The experimental data and corresponding fitting results are presented in Fig. 6 (a, b). The values of the percolation threshold φc found from these fittings are equal to 0.04 wt. % (composite I) and 0.2 wt. % (composite II). These values are much lower than those determined by using Eq. (4), because the tunneling through the potential barriers between CNTs is not taken into account in this case.
Conclusions
The SWCNT-based composites with the glass microfiber matrix (composite I) and the porous polymer matrix (composite II) were fabricated through the stage of preparation of stable dispersions containing single-walled carbon nanotubes, dispersant and binding agent. The structure of composites was investigated by scanning and transmission electron microscopy. The dependences of inter-CNT resistivity and intra-CNT resistivity on the content of SWCNTs in the composites were studied with the use of impedance spectroscopy. It was shown that these dependences depend strongly on the type of the composite.
The electrical percolation thresholds in the composites were determined by taking into account the tunneling through the potential barriers between SWCNTs and the separate contributions of intra-CNT and inter-CNT conduction mechanisms. Such an approach allowed us to determine the percolation thresholds in the composites more accurately. The values of the percolation threshold were found to be 0.24 and 3 wt. % for the composite I and II, respectively.
Acknowledgments
This work was supported by the Ministry of Education and Science of the Russian Federation (Grant No. 14.584.21.0020, unique identifier RFMEFI58416X0020).
References
- Bauhofer, W.; Kovacs, J. Composites Science and Technology 2009, 69, 1486–1498.
CrossRef - Jin, J.; Zhang, L.; Chen, W.; Li, C.-Z. Polymer Composites 2013, 34, 1313–1320.
CrossRef - Gao, S.; Zhuang, R.; Zhang, J.; Liu, J.; Mäder, E. Adv. Funct. Mater. 2010, 20, 1885–1893.
CrossRef - Volkov, I.; Varfolomeev, A.; Krasnoselsky, S.; Ivanov, V.; Maeder, T. Orient. J. Chem. 2016, 32, 2857–2861.
CrossRef - Stassi, S.; Sacco, A.; Canavese, G. J. Phys. D: Appl. Phys. 2014, 47, 1–5.
CrossRef - Islam, M. F.; Rojas, E.; Bergey, D. M.; Johnson, A. T.; Yodh, A. G. Nano Lett. 2003, 3, 269–273.
CrossRef - Lasia, A. Electrochemical impedance spectroscopy and its applications, in Modern Aspects of Electrochemistry (Springer US, New York) 1999, eds. Conway, B. E.; Bockris, J.; White R. E.
- Shklovskii, B; Efros, A. Electronic properties of doped semiconductors, in Springer series in Solid State Science (Springer, Berlin, Heidelberg) 1984, eds. von Klitzing, K; Merlin, R.; Queisser, H.-J.; Keimer, B.

This work is licensed under a Creative Commons Attribution-NonCommercial-ShareAlike 4.0 International License.

This work is licensed under a Creative Commons Attribution 4.0 International License.
![]()
A New Edition of Web of Science
Journal Impact Factor
2022: 0.5
Five Year: 0.8
Journal is Indexed in

Cabells Whitelist
![]()


