Simple and Selective Naked-Eye and visual Detection of Cu2+ and Al3+ Ions using Hibiscus Rosa-Sinensis Linn flower Extract
 , Rungnapa Pimsen, Arnannit Kuyyogsuy and Prawit Nuengmatcha
Nanomaterials Chemistry Research Unit, Department of Chemistry, Faculty of Science and Technology, Nakhon Si Thammarat Rajabhat University, Nakhon Si Thammarat 80280, Thailand.
Corresponding Author E-mail: paweena.n@gmail.com
DOI : http://dx.doi.org/10.13005/ojc/340121
Download this article as:
![]()
A simple and selectively visual detection of Cu2+ and Al3+ using Hibiscus rosa-sinensis Linn extract in aqueous solution was investigated for the first time. It was found that positive visual detections of Cu2+ and Al3+ gave their color change at pH 7. The selectivity of this method was examined using two masking agents, sodium fluoride (NaF) and dimethylglyoxime (DMG). The method exhibits good selectivity when NaF and DMG were used for the determination of Cu2+ and Al3+, respectively. The flower extract could be employed for Cu2+ and Al3+ detection at the lowest concentration of 0.5 mg/L and 1.0 mg/L, respectively. The results from naked-eye detection were also evaluated by comparing with those of using inductively coupled plasma - atomic emission spectrometry (ICP-AES), and there was no significant difference noticed. Moreover, the proposed method could be potentially applied for real water samples with visual detection of Cu2+ and Al3+, which was rapid, convenient, low-cost and environmental friendly.
KEYWORDS:Naked-Eye Detection; Aluminum; Copper; Hibiscus Rosa-Sinensis Linn
Introduction
Copper ion (Cu2+) plays important roles in various biological systems and the environment. It is well known that copper is an essential trace element for humans and other animals. However, its high concentration in domestic water and groundwater becomes a serious threat to human health. The U.S. Environmental Protection Agency (EPA) has set the maximum allowable level of copper in drinking water at 1.3 mg/L (∼20 μM). Cu2+ had highly toxic to humans at high concentrations1-3. People who were exposed to excess uptake Cu2+ tend to experience some diseases such as liver or kidney damage, neurodegenerative disease, gastrointestinal disturbance 4–7. In addition, aluminum ion (Al3+) is found abundantly in nature, such as in drinking water contamination, and can be toxic to humans in excessive amounts as well. Many symptoms of Al toxicity mimic those of Alzheimer’s disease, Parkinson’s disease, and osteoporosis8. According to WHO (Guideline for Drinking Water Quality, 1997) it has recommended the dissolved Al concentrations in waters with near-neutral pH values usually range from 0.001 to 0.05 mg/L but rise to 0.5–1.0 mg/L in more acidic waters or water rich in organic matter. Furthermore, the tolerable daily intake of Al is about 3–10 mg and the acceptable weekly Al dietary intake in the human body is about 7 mg kg-1 of the body weight9. Indirect intake of Al3+ into our body cannot be ignored as the accumulation of Al3+ in brain has been identified to cause diseases, such as Parkinson’s disease (PD)10, Alzheimer’s disease (AD)11, and dialysis encephalopathy12.
Until now, several methods for detection of Cu2+ and Al3+ have been reported including organic fluorophore-based assays13-14, inductively coupled plasma-mass spectrometry (ICP-MS)15-16, flame atomic absorption17, fluorescent probes18-19 and some electrochemical methods20. These methods are available and suitable for the determination of Cu2+ and Al3+ due to their unique advantages such as high selectivity and availability. However, most of them have various limitations with respect to low cost effective, simplicity or toxicity. Thus, visual color detection which is one of the popular methods was chosen for determination of metal ions using natural pigments as green alternative approach for molecular and ion recognition21.
In recent year, the plant extracts were simply used for naked-eye and colorimetric detection of metal ions. For example, cyanidin extracted from red cabbage was used as natural dye reagent for detection of Cu2+, Pb2+, Fe3+ and Al3+ 22. Since cyanidin is the major type of anthocyanin found in many plants such as Hibiscus, this research requires more development for metal ions detection from the plant genus23.
Hibiscus rosa-sinensis Linn (Chinese hibiscus) is a well-known member of the family Malvaceae grown native to Southeastern Asia (China)24. It is appreciat flower color, with the corolla forming a deep-colored heart and a bright red limb25. The main compounds that are responsible for their characteristics of heterogeneous color pattern in red cultivars are anthocyanins, being preferentially accumulated on calyces26-27. Previous studies reported that Chinese hibiscus contains flavonoids, cyanidin, hentriacontane, querecetin, calcium oxalate, thiamine, riboflavin, niacin, ascorbic acid, citric acid, tartaric acid and oxalic acid28-30.
This paper is aimed to focus on developing the simple method for selective detection of Cu2+ and Al3+ in mixed aqueous solutions using Chinese hibiscus flower crude extract, because it is a flower plant growing all year. Moreover, the naked-eye detection method is rapid, simple, low cost, no requirement of sample preparation and is also environmental friendly detection.
Materials and Methods
All chemicals used in this research were analytical reagent grade. Red petals of Chinese hibiscus were extracted by deionized water (DI water). Stock solutions of Cu2+ and Al3+ were prepared from CuSO4.H2O and AlCl3. The interferences of both cations and anions (Co2+, Mn2+, Zn2+, Cr3+, Pb2+, OH–, SO42-, CO32-, NO3–, Ca2+ and K+) were studied. Sodium fluoride (NaF, 0.1 M) and dimethylglyoxime disodium salt octahydrate (DMG, 1% w/v) were used as masking agents for Al3+ and Cu2+, respectively. Concentrated HCl and magnesium ribbon were used to check the presence of flavonoid by Shinoda’s test. Potassium chloride was used for pH 1.0 solution and sodium acetate buffer was used for pH 4.5 for determination of anthocyanin compounds. Working standard of metal ions was prepared daily by appropriate dilution of stock solutions. Fourier transform infrared spectrometer (FTIR), Perkin Elmer (Spectrum One)/ Bruker (Tensor 27) were used to investigate the functional group in the flower extract. Absorption spectra were recorded on a UV-VIS spectroscopy performed with an Evaluation 2100 spectrophotometer (Hitachi, Japan). For method evaluation, the contents of Cu2+ and Al3+ obtained were determined by inductively coupled plasma – atomic emission spectrometer (ICP-AES), Perkin Elmer/Optima 3300DV.
Preparation and Characterization of Chinese Hibiscus flower Extract
The red Chinese hibiscus flowers were collected from Nakhon Si Thammarat Rajabhat University, Nakhon Si Thammarat Province, Thailand. The calyx was removed and only the petals were rinsed with water and oven dried at 60°C for 24 h. 10 g of dried petals and 80 mL DI water were mixed. The mixture was heated at 60°C for 1 h and filtered through Whatman filter paper No. 1. The solvent was removed under vacuum and crude solid mass was obtained. The crude extract was redissolved in DI water prior to use. To confirm hydroxy group of anthocyanin, Shinoda’ s test was applied, using 2 mL of the crude extract, a piece of magnesium ribbon and 1 mL of concentrate HCl31.
Colorimetric detection of Cu2+ and Al3+
The color changes of Chinese hibiscus flower extract response for Cu2+ and Al3+ were detected by naked-eye. 1 mL of Cu2+ or Al3+ (1 – 100 mg/L) solution and 1 mL of the flower extracted (3000 mg/L) were mixed in test tube. The photographs were taken with a digital camera (8 megapixels). The absorption spectra of the extract for metal ions were recorded. To find out the optimum conditions for determination of metal ions, both concentration and ratio volume of Cu2+ and Al3+ with the crude extract in aqueous solution were investigated. Masking agents including NaF and DMG were also considered to confirmthat any metal ion interferences effect for the determination. The lowest concentration for their color chang was investigated.
Determination of Cu2+ and Al3+ in ground water sample
To evaluate the applicability of this proposed method, Cu2+ and Al3+ in ground water sample were determined by naked-eye and colorimetric methods using the flower extract. Ground water samples were obtained from a natural ground well water at Nakhon Si Thammarat Rajabhat University, Nakhon Si Thammarat province, Thailand. They were tested with standard solutions of Cu2+ and Al3+. The results of naked-eye detection were compared with those of Cu2+ and Al3+ determined by ICP-AES.
Results and Discussion
Characterization of the flower Extract
The red-purple crude of the flower extract was used in aqueous solution. They have red color tone in acid solution (pH 1-2) and blue-green color tone in base solution (pH 11-12), indicating that it is characteristics of anthocyanin compounds. The UV–Vis spectrum of the flower extract shows absorption band in range 250-400 nm and 527 nm corresponding to flavonoids and phenolic compounds 28, 32-33. These results are corresponding to Shinoda’s test. Pink red color of the solution appeared, indicating the presence of flavonoids 34. Red shif was obtained after adding AlCl3 into the solution, indicating hydroxy group in the molecule of anthocyanins. Their FTIR spectra of showed the major functional groups; including O-H stretching of carboxilic group at 3293.86 cm-1, asymmetric stretching of C-H vibrational peaks at 2917.06 cm-1 and 2849.32 cm-1, COO– and C = C aromatic conjugates at 1736.27 cm-1 and 1632.49 cm-1, C-O stretching at 1239.99 cm-1 and C-C, C-O stretching of polysaccharide according to other reports34-35. It is emphasized that the flower extract was included flavonoids.
Selectivity and Sensitivity of Cu2+ and Al3+ Detection
The pH of solution is a major parameter affecting the flower extract plant pigments. Figure 1(a) clearly shows that the flower extract was selectively sensitive towards Cu2+ and Al3+. There was no change in color observation after the addition of the other metal ions (Co2+, Cr3+, Mn2+, Pb2+ and Zn2+) in aqueous solution. The effect of pH on the sensing ability of the Chinese hibiscus flower extract was investigated via the naked-eye studied in pH range of 1-13.
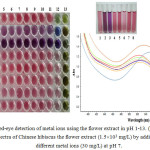 |
Figure 1a: Naked-eye detection of metal ions using the flower extract in pH 1-13. (b) UV-Vis spectra of Chinese hibiscus the flower extract (1.5´103 mg/L) by addition of different metal ions (30 mg/L) at pH 7. |
Mixed solutions of both Cu2+ and Al3+ with the flower extract showed red color solution at pH 1-2. This result, mostly due to anthocyanins, can be easily deprotonated at low pH resulting in their structural changes in the anthocyanin chromophores 29. Moreover, we found that the stable color changed from pink to purple for Cu2+ detection at pH 3-11 and the color change from pink to drak purple was observed for Al3+ detection. Therefore, the complexation of the flower extract with Cu2+ and Al3+ was simply investigated. The change in the UV–Vis spectrum of the flower extract due to the addition of metal ions is shown in Fig. 1(b). A significant absorption at 536 nm is found only for Cu2+ and 544 nm for Al3+ induced by the flower extract among the tested cations. The incremental addition of Cu2+ and Al3+ into the flower extract resulted in the red shift of 527 nm to 536 nm and 544 nm, respectively. The new absorption paek may be due to metal comlexes of the flower extract with Cu2+ and Al3+.
Several research groups have investigated the complex ratio and it was found that the different ratios were up to metal ion types 31. In this work, the ratios of Cu2+ – the flower extract and Al3+ was also 1:1 used for further experiment.
According to effecttively simultaneous naked-eye detection of Cu2+ and Al3+ at pH 7, thus, masking agents were essentially used to mask the unexpected interfering ions. It was found that DMG can completely mask Cu2+ for the determination of Al3+, whereas NaF can be used to mask Al3+ for the determination of Cu2+ (Fig. 2).
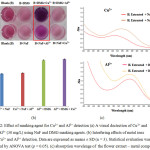 |
Figure 2: Effect of masking agent for Cu2+ and Al3+ detection (a) A visual dectection of Cu2+ and Al3+ (30 mg/L) using NaF and DMG masking agents. (b) Interfering effects of metal ions for Cu2+ and Al3+ detection. Click here to View figure |
Data are expressed as means ± SD (n = 3). Statistical evaluation was performed by ANOVA test (p = 0.05). (c) absorption wavelenge of the flower extract – metal complexes.
The optimum conditions for simultaneous determination were overall performed by using the mixture of the flower extract containing of the masking agent used. In the case of Cu2+ determination, NaF was employed in the pH 7 solution as Al3+ masking agent because F– can interact with Al3+ to give the colorless complex of AlF63-, So NaF was used as masking agent for Cu2+ detection. Wheseas, Al3+ was determined along with DMG solution to get rid of the Cu2+ interference36. After adding 30 mg/L of metal ion into the extracted solution, the chelate extract-Cu2+ complex shifts to longer wavelength from 535 nm to 567 nm in the presence of NaF. The same result obtained from the complexation of the extract of Al3+ in the presence of DMG shifting from 578 nm to 585 nm as shown in Fig 2(c).
To make sure that the target metal ions will not interfere each other. The experiment was carried out by using the optimum conditions of qualitative determination. The target metal ions (Cu2+ and Al3+) in the equimolar concentration (30 mg/L) of standard metal ion solution was used as the interfering ion. It was also found that no significant difference was observed (ANOVA test, p = 0.05) as shown in Fig. 6.2(b)
The interactions of other metal ions and the extract were investigated to prevent undesirable metal ions that could interfere this method. Because the flower extract may bepotentially complexed with many metal ions when using the masking reagent. Cu2+ and Al3+ ions show a strong binding by complexation compared to other sensing metal ions. These results were further confirmed by UV-Vis spectroscopic method. Mn2+, Cr3+, Pb2+, Co2+, and Zn2+ are likely present in the studied samples. The present method was evaluated with the concentration ratio of the desired analyte Cu2+ and Al3+ ions to the potential interference ones. The analytical signals of a solution containing Cu2+ or Al3+ were obtained from each concentration ratio or in higher excess of Mn2+, Cr3+, Pb2+, Co2+ and Zn2+ ions which had no significant effect on the color intensity of Cu2+ and Al3+. Hence, the developed method was then selected for the detection of Cu2+ and Al3+ (Fig 3(a).
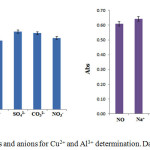 |
Figure 3: Interfering effects of cations and anions for Cu2+ and Al3+ determination. Data are expressed as means ± SD (n = 3). Click here to View figure |
Moreover, the flower extract may also be potentially the complex formation with other metal ions and some anions might associate with Cu2+ and Al3+ as they are anionic ligands. Both Cu2+ and Al3+ at the concentration of 1000 mg/L were prepared in the neutral pH solution. Cations and anions (Na+, K+, Ca2+, CO32-, SO42-, NO3–, F– and Cl–) were prepared as interfering ions in each tested metal ion solution. Figure 3 shows that no significant difference in the absorbance of Cu2+ and Al3+ complexes was noticed except F– did not interrupt Al3+ detection because it can interact with Al3+ to give the colorless complex of AlF63-. This is the reason to use NaF as the masking agent for Al3+ detection.
Determination of Cu2+ and Al3+ in Ground Water Sample
To evaluate the analytical performance, the proposed method was conducted by naked-eye detection when the metal complex of the flower extract occurred. This reaction process can be monitored visually, thus the naked-eye alone can be seen in the presence of Cu2+ and Al3+ ions. The quantitative analysis was done under the optimum conditions by applying 0.1 mL of selective masking agent into the sample solutions (10–1000 mM) followed by 1 mL of the flower extract solution. The solution mixture of NaF and DMG was used for Cu2+ and Al3+ detection, respectively. Naked-eye detection performed as semi-quantitative determination can be divided into different color shades depending on the metal ion concentration ranges. Table 1 and Fig. 4 show the quantitative determination and the lowest concentration measured by naked-eye detection.
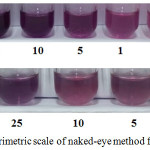 |
Figure 4: Colorimetric scale of naked-eye method for Cu2+ and Al3+. Click here to View figure |
The determination of metal ions was carried out by naked-eye detection (Fig. 4.) giving the lowest concentrations of 1 mg/L and 0.5 mg/L for Cu2+ and Al3+, respectively. From these results, it had lower than that previous report (Warangkhana Khaodee et al., 2014)22.
Table 1: The color and quantity of Cu2+ and Al3+ by naked-eye detection at pH 7.
| Metal ion |
Color and its concentration range (mg/L) |
Lowest concentration (mg/L) |
|
| Cu2+ |
Pink-Purple 1-10 |
Purple >10 |
1 |
| Al3+ |
Purple 0.5-5 |
Dark purple >5 |
0.5 |
Application
The ground water samples from Nakhon Si Thammarat Rajabhat university were collected to detect two target metal ions, Cu2+ and Al3+. The certain amounts of these metal ions were spiked into ground water sample. Color of the spiked water samples were developed under the optimum conditions as described for naked-eye detection. The results of naked-eye detection were compared with those of the metal ions determined by ICP-AES. Form the results shown in Table 2, the actual concentrations of Cu2+ and Al3+ are somewhat close to thsoe of naked-eye measurement and are rather in the same concentration range. So, this method can be applied to determine both Cu2+ and Al3+ in real water samples without any interfering effect.
Table 2: The Cu2+ and Al3+ concentrations in ground water sample
| Metal ion | Concentration (mg/L) | ||
| Spiked water sample | ICP-AESDetection | Naked-eyeDetection | |
| Cu2+ | 0.00 | 0.035 | <0.3 |
| 0.50 | 0.087 | 0.3-1.5 | |
| 1.00 | 0.141 | 0.3-1.5 | |
| 1.50 | 0.193 | 0.3-1.5 | |
| Al3+ | 0.00 | 0.061 | <0.3 |
| 0.50 | 0.114 | 0.3-1.5 | |
| 1.00 | 0.164 | 0.3-1.5 | |
| 1.50 | 0.214 | 0.3-1.5 | |
Conclusion
We successfully developed a simple colorimetric sensor for selective detection of Cu2+ and Al3+ using the Hibiscus rosa-sinensis Linn extract. The appropriate ratio of the flower extract and these metal ions which was optimized to induce clear color was 1:1 at pH 7. The interference of Mn2+, Cr3+, Pb2+, Co2+ and Zn2+ ions had no effect on the color intensity of the Cu2+ and Al3+ complexes. The method selectivity was effectively when using NaF and DMG as masking reagent for Cu2+ and Al3+, respectively. Moreover, the flower extract can be used for water sample where monitoring of Cu2+ and Al3+ is required. The detections of 20 mM Cu2+ and 40 mM Al3+ by visual naked-eye observation are achieved. Most attractively, this method is rapid, convenient and low-cost because no instruments are required and the presence of Cu2+ and Al3+ can be easily monitored by the naked-eye. The usage of low volume for all reagents is green approach for environmental friendly detection. The advantages of this development are very simple, rapid, low cost, and no requirement of sample preparation.
Acknowledgements
This work was financially supported by Nanomaterials Chemistry Research Unit, Department of Chemistry, Faculty of Science and Technology, Nakhon Si Thammarat Rajabhat University.
References
- Wu, P.; Huang, Y.; Du, J. Dalton Trans. 2009, 24, 4735–4740.
CrossRef - U.S. EPA (2007) Aquatic life ambient freshwater quality criteria copper: 2007 revision. Report number: EPA-822/R-07-001; U.S. Environmental Protection Agency, Washington, D.C
- Barranguet, C.; Van den Ende, P.; Rutgers, M.; Breure, M.; Greijdanus, M.; Sinke, J. J.; Admiraal, W.Environ. Toxicol. Chem. 2003, 22, 1340-1349.
- Zietz, P., Dieter, H. H., Lakomek, M., Schneider, H., Kebler-Gaedtke, B., & Dunkelberg, H. Sci. Total Environ. 2003, 302, 127-144.
CrossRef - Georgopoulos, G; Roy, M.; Yonone-Lioy, J.; Opiekun, E.; Lioy, J. J Toxicol Environ Health, Part B. 2001, 4, 341–394.
CrossRef - Li, M.; Zhang, L.; Zhu, C.; Xue, J.; Zhu, Z.; Tan, H. Analyst 136. 2011. 1124–1128.
CrossRef - Johncilla, M.; Mitchell, A. Semin Liver Dis. 2011, 31, 239–244.
CrossRef - Orojloo, M.; Amani, S. Talanta 159. 2016, 292–299.
CrossRef - Krejpcio, Z.; Wójciak, W. Pol. J. Environ. Stud. 2011, 11, 251–254.
- Mendez-Aè lvarez, E.; Soto-Otero, R.; Hermida-Ameijeiras, A.; Lopez-Real, M.;
Labandeira-Garc, J. Biochim, L.; Biophys. Acta. 1586 . 2001, 155–168. - Kepp, P. Chem. Rev. 2012, 112, 5193–5239.
CrossRef - Wills, R.; Savory, J. Lancet 322. 1983, 29–34.
CrossRef - Tang, L.; Cai, M.; Huang, Z.; Zhong, K. Hou, S.; Bian, Y.; Nandhakumar, R. Sens. Actuators, B. 2013, 185, 188-194.
CrossRef - Xu, W.; Zhou, Y.; Huang, D.; Su, M.; Wang, K.; Hong, M. Inorg. Chem. 2014, 53, 6497 −6499.
CrossRef - Zhu,B.; Inagaki, K.; Chiba, K.; J. Anal At Spectrom. 2009, 24, 1179–1183.
CrossRef - Shang, R.; Zhao, F.; Zhai, X.; Ning, S.; Ding, Y.; Sheng, F. Chin. Sci. Bull. 2013, 58, 35, 4437-4442.
CrossRef - Moghimi, A.; Hosseini, S.; Mazlomi, A. Orient. J. Chem. 2015, 31, 1, 263-270.
CrossRef - Mahapatra, K.; Hazra, G.; Das, K.; Goswami, S. Actuators B. 2011, 15, 6456–6462.
- Yu, W.; Zhang, J.; Li, J.; Liu, P.; Wei, P.; Chen, X. Microchim Acta. 2011, 174, 247–255.
CrossRef - Qiu, Y.; Gao, S.; Zhu, X.; Lin, Y.; Qiu, B.; Chen, G.; Analyst 136. 2011, 1580–1585.
CrossRef - Galingana, M.; Organo, V. Orient. J. Chem. 2016, 32, 3, 1347-1352.
CrossRef - Khaodee, W.; Aeungmaitrepirom, W.; Tuntulani, T. Spectrochim. Acta, Part A. 2014, 98–104.
CrossRef - Ukwueze, N. N.; Nwadinigwe, C. A.; Okoye, C.O.B.; Okoye, F.B.C.; Int. J. Phys. Sci. 4. 2009, 58–62.
- Wong, S. K.; Lim, Y. Y.; Chan, E. W. C. J. Trop. For. Sci. 2009, 21, 307 −315.
- Cisse, M.; Vaillant, F.; Acosta, O.; Claudie, D. M.; Dornier, M. J. Agric. Food Chem. 2009, 57, 6285 −6291.
CrossRef - Gauthaman, K. K.; Saleem, M. T.S.; Thanislas, P. T.; Prabhul, V. V.; Krishnamoorthy, K. K.; Devaraj, N. S.; Somasundaram, J. S. BMC Complementary and Alternative Medicine. 2006, 6, 32-39.
CrossRef - Shukla, Y. N.; Mishra, M. Indian Drugs. 2001, 38, 543.
- Trivellini, A.; Gordillo, B.; Rodríguez-Pulido, F. J.; Borghesi, E. Ferrante, A.; Vernieri, P.; Quijada-Morín, N. Gonzalez-Miret, M.L. Heredia, F.J. J. Agric. Food Chem. 2014, 62, 6966 −6974.
CrossRef - Siddiqui, A. A.; Wani, S. M.; Rajesh, R.; Alagarsamy, V. Indian J Pharm Sci. 2006, 68, 127-130.
CrossRef - Siddiqui, A. A.; Wani, S. M.; Rajesh, R.; Alagarsamy, V.; Indian J. Chem. 2005, 44, 806-811.
- Ravishankara, M. N.; Shrivastava, N.; Padh, H.; Phytomedicine, M. R. Phytomedicine. 2002, 9, 153–160.
CrossRef - Melo, M.J.; Moura, S.; Roque, A.; Maestri, M. & Pina, F. J. Photochem. Photobiol., A. 2000, 135, 1, 33-39.
CrossRef - Moncada, M.C.; Fernandéz, D.; Lima, J.C.; Parola, J.; Lodeiro, C.; Folgosa, F.; Melo, J. M.; Pina, F. Org. Biomol. Chem. 2004, 2, 2802-2808.
CrossRef - Wrolstada, R. E.; Dursta, R. W.; Leeb, Food Science & Technology 16. 2005, 423–428.
- Robert, W. D.; Wrolstad, R. E. J.AOAC. Int. 2005, 88, 5, 1269-1278.
- Mak, Y. W.; Chuah, L. O.; Ahmad, R.; Bhat, R. Journal of King Saud University – Science. 2013, 25, 275–282.
CrossRef

This work is licensed under a Creative Commons Attribution-NonCommercial-ShareAlike 4.0 International License.


![]()


