Retarding of Preliminary Chemical Pollutants from Dye Effluent by Metal Nano Particles Synthesized using Flower Extract of Catharanthus Roseus
Vijaya Anandan Veerasamy Alagarsamy1, Kistan Andiyappan1,2 , Saral Abdul Kadar Avuliya2 and Thaminum Ansari Abubacker3
1Research and Development Centre, Bharathiar University, Coimbatore- 641046, Tamil Nadu, India.
2Panimalar Institute of technology, Chennai, India.
3PG and Research Department of Chemistry, Muthurangam Government Arts College, Vellore 632002, Tamil Nadu, India.
Corresponding Author E-mail: vishmikrish@gmail.com
DOI : http://dx.doi.org/10.13005/ojc/340141
The present research discussed usage of 3 inorganic Nano-substances in order to retard chemical pollutants from coloured Dye industry and tannery effluents. These 3 inorganic Nano metal particles from MgSO4, CuSO4.5H2O and FeSO4.75H2O with rose petals extract (Catharanthus roseus). To assess the feasibility of using these Nano particles as low-cost adsorbents for suppressing preliminary chemical pollutants in coloured effluents. Also compared and investigated the ability of these 3 Nano materials due to using flower extract of Catharanthus roseus petals, in order to retard preliminary chemical pollutants quantity such as pH, Alkalinity, hardness, TDS, BOD, COD, Sulphide, Sulphate, Nitrate, Ca, Mg, Phosphate, Na and K. These synthesized 3 Nano materials characterized by UV-Visible spectroscopic analysis, FT-IR Spectroscopic analysis and, X-ray Diffraction (XRD) Studies
KEYWORDS:Nano Materials; Catharanthus Roseus; Low Cost Adsorbent; Preliminary Pollutants; Dye Effluents
Download this article as:| Copy the following to cite this article: Alagarsamy V. A. V, Andiyappan K, Avuliya S. A. K, Abubacker T. A. Retarding of Preliminary Chemical Pollutants from Dye Effluent by Metal Nano Particles Synthesized using Flower Extract of Catharanthus Roseus. Orient J Chem 2018;34(1). |
| Copy the following to cite this URL: Alagarsamy V. A. V, Andiyappan K, Avuliya S. A. K, Abubacker T. A. Retarding of Preliminary Chemical Pollutants from Dye Effluent by Metal Nano Particles Synthesized using Flower Extract of Catharanthus Roseus. Orient J Chem 2018;34(1). Available from: http://www.orientjchem.org/?p=43195 |
Introduction
Now a day we know numerous management approaches to remove contaminants from dye industry and tannery sewage. This removal process can be carried out by Physical, chemical, and biological processes [1].In the chemical management procedure, many advanced process such as UV, H2O2, photo catalyst and Fenton’s agent are often used and have been proven effective in the quick elimination of colours and pollutants from dye solutions [2]. . Over the previous few years adsorption has gained paramount importance in industry and surroundings protection. Adsorbents are generally used for its environment pleasant conduct, availability in nature and are very a good deal-price powerful. Metal Nano particles can be used as effective bio-adsorbent for doing away with dyes metals and natural pollutants from industrial wastewater.
However those technologies usually having some disadvantages, such as complicated procedure, high expenses, forming by-products and removal of those by-products. For example Activated carbon is typically extra effective to adsorb numerous pollutants than other adsorbents which do now not require massive processing [3] . But, commercially available activated carbon is highly-priced and might not be cost effective for colored wastewater remedy. For a cost-effective colored wastewater remedy purpose, therefore the improvement of recent materials from no price or low cost adsorbents obtained domestically is an thrilling alternative. Many research had been investigated the remedy of dye effluents containing a single dye or a aggregate of the identical magnificence of dyes, as well as chemical contaminants however the treatment of mixtures containing distinct lessons of dyes has not been sufficiently addressed[4]. The present look at investigates the effectiveness of adsorption as a treatment manner for a disperse dye, a reactive dye and their aqueous mixtures, in phrases of retardation of chemical parameters consisting of pH, alkalinity, hardness, TDS, BOD, COD reduction the usage of inorganic synthesized Nano substance (MgSO4, CuSO45H2O, FeSO4.7H2o).
Novelty of present study was some inorganic metal Nanoparticles are synthesized by using the flower extract of the plant Catharanthus roseus. Catharanthus roseus (also known as periwinkle) belongs to the family Apocyanaceae; it grows as a shrub in subtropical areas. The plant produces flowers with five petals and the flowers are of three types. Rose purple flowers, White flowers and White flowers with a rose purple spot in the Centre. The first type is most commonly found and it is more cultivated because of its higher alkaloid content. This plant has been taken for study due to its unique properties. This examine was achieved to make use of the steel Nano particles as a low value adsorbent with recognize to numerous parameters together with exclusive doses, contact time and pH. The characterizations of these Nanoparticles were done by FTIR, UV-spectroscopy, and XRD analysis.
Materials and Methods
Preparation of Rose Extracts
Materials used for the synthesis of Nano particles are MgSO4, CuSO4.5H2O, FeSO4.7H2O, were purchased from Merck, India. The flowers of the plant Catharanthus roseus were collected from Rose garden. 10 g wet flowers petals were weighed and washed twice with distilled water followed by Millipore water and then macerated into fine pieces. These fine flower petal pieces taken in a 250ml Erlenmeyer flask, 50ml of Millipore water was added and kept on a water bath for 15 minutes at 750ºC.Then the flowers content was filtered off through What man no – forty clear out paper after which extract become used for the synthesis of diverse metals Nano debris which includes MgSO4, CuSO4.5H2O, and FeSO4.7H2O. This extract stands stable for one week if stored at 30±5ºC.
Synthesis of Metal Nano Particles using Rose Petal Extract
Synthesis of MgSO4 Nano Particle
200 ml of the solution of MgSO4 (4.92g) and then 20ml of rose petal extract is added and then magnetic stirring (1000 Rpm) for 60 minutes and against the titrant through the NaOH solution (0.1N) in 200ml to get through the precipitate is filtered and dried at the oven 150ºC.
Synthesis of CuSO4.5H2O Nano Particle
200ml of the solution of CuSO4.5H2O (4.99g) and then 20ml of extract is added and then magnetic stirring (1000Rpm) for 60mins and against the titrant through the NaOH solution (0.1N) in 200ml to get through the precipitate is filtered and dried at the oven150ºC.
Synthesis of FeSO4.7H2O Nano Particle
200ml of the solution of FeSO4.7H2O (5.56g) and then 20ml of extract is added and then magnetic stirring (1000Rpm) for 60mins and against the titrant through the NaOH solution (0.1N) in 200ml to get through the precipitate is filtered and dried at the oven 150ºC.
Characterization of Metal Nano Particles
UV-Visible Spectroscopic Analysis
UV-Visible spectra of all the Nanoparticle were recorded using de-ionized water (H2O) as solvent[6].The UV-Visible spectra of Rose extract and metal Nanoparticle are given in Fig 1-3, and the values are shown in Table 1.The spectrum reveals the characteristic absorption peaks of Nanoparticle material at 200-590nm respectively. The maximum peak was observed at 380nm and minimum peak was observed at 230nm which corresponds to Nano size of MgSO4. The maximum peak was observed at 590nm and minimum peak was observed at 390nm which corresponds to Nano size of CuSO4.5H2O.The maximum peak was observed at 393nm and minimum peak was observed at 242nm which corresponds to Nano size of FeSO4.7H2O. UV-Visible Spectra revealed that concentration of aqueous extract of Catharanthus roseus plays an important role in the charge transfer from oxygen to the center; one can expect to see the metal field transition in these cases.
Table 1: UV-Visible spectral data of different metal nano particle
| Types of Nano materials | λmax (nm) |
| MgSO4 | 235&380 |
| CuSO4.5H2O | 390 &590 |
| FeSO4.7H2O | 242 &393 |
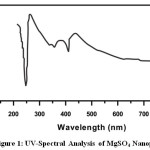 |
Figure 1: UV-Spectral Analysis of MgSO4 Nanoparticle Click here to View figure |
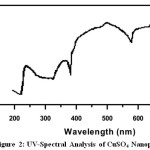 |
Figure 2: UV-Spectral Analysis of CuSO4 Nanoparticle Click here to View figure |
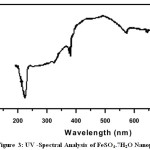 |
Figure 3: UV -Spectral Analysis of FeSO4.7H2O Nanoparticle Click here to View figure |
FT-IR Spectroscopic Analysis
FT-IR spectrum of the metal Nano particles shows peak at 500cm-1 to 650cm-1 which is attributed to the presence of metal in the Nanoparticle. The band at 3850.22 cm-1 – 1481.48cm-1, 1078.41cm-1 – 899.21cm-1 and 3682.12cm-1 988.88cm-1 are attributed toMgSO4,CuSO4.5H2O and FeSO4.7H2O stretching mode of vibration for the benzenoid units of rose extract. The FT-IR spectroscopic analysis of Rose extract and metal Nanoparticle are given in Fig 4-6, and the values are shown in Table 2.
Table 2: IR-Vibration Frequencies for the Rose Extract and Metal Nanoparticle
| Types of Nano materials | Wave number (cm-1) |
| MgSO4 | 3850.22&1481.48 |
| CuSO4.5H2O | 1078.41& 899.21 |
| FeSO4.7H2O | 3682.12&988.88 |
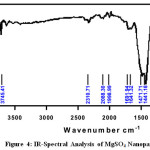 |
Figure 4: IR-Spectral Analysis of MgSO4 Nanoparticle Click here to View figure |
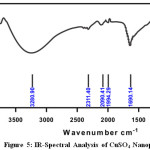 |
Figure 5: IR-Spectral Analysis of CuSO4 Nanoparticle Click here to View figure |
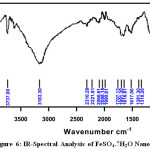 |
Figure 6: IR-Spectral Analysis of FeSO4.7H2O Nanoparticle Click here to View figure |
X-ray Diffraction Studies
Figure 7 -9 shows the XRD pattern of MgSO4, CuSO4.5H2O and FeSO4.7H2Onanoparticles. XRD diffraction patterns of MgSO4, CuSO4.5H2O and FeSO4.7H2ONanoparticles. On comparison with the JCPDS data’s (21-1272,04-0836,85-1436,89-1397,04-0836,) reveals that the crystalline structure of nanoparticles which are Hexagonal, Cubic, Cubic, Spinel Cubic, Hexagonal Structure[7]. Average particle diameter D for specimen was obtained from the main peak using Debye-Scherrer equation (1) for the peak width broadening as a function of the size of the particles.
D=0.89 / βcosθ → (1)
Here λ is the x-ray wavelength(Kα=1.5418a°),k is the system constant(0.89),β is the total width at half most of the peak and θ is the peak function and using the above method we obtained a median length for debris with the greater intense height of the plane for sample [8] . The average size of the nanoparticles was shown in Table-3. XRD study clearly confirms that the formation of rose extract dispersed in nanoparticles which are, MgSO4, CuSO4.5H2O and FeSO4.7H2O.
Table 3: X-ray Diffraction Studies for the Rose Extract and Metal Nanoparticles
| Types of XRD Nanoparticles Compund | Average Crystalline Size (D)nm | 2 |
| MgSO4 | 7.220 | 18.622 |
| CuSO4.5H2O | 35.019 | 18.038 |
| FeSO4.7H2O | 29.98 | 63.718 |
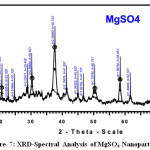 |
Figure 7: XRD-Spectral Analysis of MgSO4 Nanoparticle Click here to View figure |
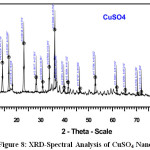 |
Figure 8: XRD-Spectral Analysis of CuSO4 Nanoparticle Click here to View figure |
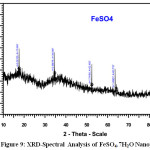 |
Figure 9: XRD-Spectral Analysis of FeSO4.7H2O Nanoparticle Click here to View figure |
Methodology
Analytical Analysis
The Physico-chemical parameters such as pH, TDS, BOD, COD,TotalAlkalinity, Potassium, Calcium, Magnesium, Sulphides, Chlorides, Chromium and Nitrates were determined, the chemical characteristics including heavy metals for examination of water [10].
The Physico-chemical parameters such as pH, TDS, BOD, COD, overall Alkalinity, Potassium, Calcium, Magnesium, Sulphides, Chlorides, Chromium and Nitrate have been measured on the sample web page the usage of hand held analyzing kits. Groundwater samples have been amassed and the samples were saved in a polythene bottle for similarly laboratory analysis of fundamental ions. The extra natural analytical reagents and chemical requirements had been used for the groundwater excellent assessment. The water samples were analyzed in Tamilnadu Water Supply and Drainage Board, Vellore.4.
The analytical techniques are suggested by the American public fitness association [11]. pH was determined by electrometric method by using pH meter. (Alkalinity)Carbonate (CO3–) and bicarbonate (HCO3–) were determined using acid – base titration method; Total alkalinity was measured by Potentiometric titration method. TDS was determined by Gravimetric method. Chloride (Cl–) concentration was measured by Argentometric method, Sulphate(SO42-) and sulphide measured by Colorimetric method using spectrophotometer, Nitrate (NO3–) was analyzed using Kjeldhal flask apparatus. Calcium (Ca2+) and Magnesium (Mg2+) were determined using the EDTA titration method Chromium (Cr3+) were determined by Flame Atomic absorption spectrophotometer (VARIAN SPECTRA A240) in CVR Labs Pvt. Ltd, Saidapet, Chennai-5, Tamilnadu.
Pretreatment with Metal Nano Particles
Waste water samples from equalization cum collection tank were taken in four 1 litre graduated glass jars. To each of the sample with three metal nano particles namely MgSO4,CuSO4.5H2O,and FeSO4.7H2Oat various concentrations (10 mg/lit., 20 mg/lit., 30 mg/lit., and 40 mg/lit, 50mg/lit.) were added and allowed to settle for 12 hours. The supernatant liquid was used for the tests of various parameters such as pH, COD, BOD, chlorides, Sulphide, hardness, alkalinity, Nitrate and TDS by quantitative methods.
Result and Discussion
The waste water samples from equalization cum collection tanks of selected dye industries were collected and characterized for pH, COD, BOD, SS and TDS, the data are presented in Table -4.
The BOD/COD ratio can likely to be increased remaining certain residual non-biodegradable organic materials and chemicals in the dye waste water. The settling rate of sludge appeared from primary liquor was observed to be 0.024. Actually the BOD/COD ratio which is an index of waste water was found to be in the range of 0.15 to 0.35. The settling rate of sludge is a function of particle size and viscosity of the medium. The size of the particles can be increased during adsorption and flocculation due to the addition of adsorbents.
Table 4: Characterization of raw sample
| S.NO | Parameters | Unit | Before adding adsorbents |
| 1. | PH at 25oC | Number | 8.5 |
| 2. | Total Dissolved solids at 180oC | Mg/l | 15,216 |
| 3. | Chlorides as Cl | Mg/l | 3500 |
| 4. | Sulphide as SO4 | Mg/l | 1900 |
| 5. | BOD (at 27oC for 3 days) | Mg/l | 600 |
| 6. | COD | Mg/l | 3400 |
| 7. | Alkalinity | Mg/l | 7000 |
| 8. | Total hardness | Mg/l | 4500 |
| 9. | Calcium | Mg/l | 3000 |
| 10. | Magnesium | Mg/l | 900 |
| 11. | Sulphide | Mg/l | 27 |
| 12. | Phosphate | Mg/l | 1.59 |
| 13. | Sodium | Mg/l | 800 |
| 14. | Potassium | Mg/l | 30 |
| 15. | Nitrate | Mg/l | 5.10 |
Chemical adsorption consists of adding small amount of certain adsorbent to waste water which form flocculation precipitate that coalesce the suspended impurities can cause force to settle out rapidly. Adsorbent consists of a series of operation that result in the destabilization of the colloids leading to their removal from the suspended fluid. Ideally it is possible to distinguish from sequential steps in adsorption namely,
Dispersion of adsorbent
Nucleation
Flocculation and
Phase separation
In current practice, PACL is used as the best adsorbent for dye waste water. The quantity of adsorbent PACL required for adsorption-flocculation of waste water was optimized for the removal of suspended solid and other organics in it. The results that were obtained for optimum dosage of alum as coagulant was already studied
PACL is the best adsorbent for dye effluent. The quantity of the adsorbent was optimized in the preliminary investigations Table – 2. In the acidic location, PACL starts to hydrolyze and paperwork monomeric al hydrolyzed species. Subsequently, soluble cations such as Al3+, Al (Oh)2+ and Al (Oh)2+ are most important within the answer. They play an important role in destabilizing the negatively charged dye debris via fee neutralization. At around impartial pH, Al(III) has constrained solubility because of the precipitation of amorphous hydroxide, which results in the possibility of sweep flocculation as impurities (i.e., dye particles) enmesh inside the developing precipitates and are efficaciously removed. The main purpose of this study is the new adsorbents namely MgSO4, CuSO4.5H2O, FeSO4.7H2O and were introduced and tried for the first time, as adsorbent for textile industry dye effluent to know their removal efficiencies in controlling various pollution causing parameters of dye effluents and their effectiveness were compared with that of PACL
The values presented in the tables were the results obtained for samples with different nano materials in various concentrations. And also the graphs were plotted for reduction of physico chemical pollutants against dosages of synthesized Nano materials Adsorbent.
The present study further extended to employ new adsorbents, metal nano particles synthesized using rose petals (catharanthus roseus) such as MgSO4,CuSO4.5H2Oand FeSO4.7H2Oto compare the results with those obtained with PACL. Data obtained for the different complexes are presented in Tables – 5 to 9.
Effect of MgSO4 Nano Particles on Vat Dye Combined Waste Water
The pH of the raw effluent was 8.5 it was decreases to 8.5, 8.6, 8.8, 8.9, and 9.4 with addition of 10 mg/lit., 20 mg/lit., 30 mg/lit., 40 mg/lit, 50 mg/lit of MgSO4 nano particles respectively Table –5 due to the basic nature of the coagulant. The increase of pH might due to the release of the hydroxide ions in the complexes depict the change of pH as a function of the coagulant concentration.
The Total Dissolved Solid value of the raw effluent was 15,216 mg/L and decrease to 6520 mg/L , 6490 mg/L , 6471 mg/L , 6432 mg/L and 6330mg/L with the addition of 10 mg/lit., 20 mg/lit., 30 mg/lit., 40 mg/lit,50 mg/lit of CuSO4.5H2O nano particles respectively Table – 5. It was observed that there was reduction of TDS was imparted by the MgSO4 nano particles added. The main objective of chemical treatment is to remove colloids carried by the effluent. Since colloidal particles are charged particles, and these charged particle trapped using complexes carrying opposite charges in order to form flock and create density gradient between liquid and suspended solid phase (to reduce zeta potential of suspended colloidal particles).
The chloride value of the raw effluent was 3500 mg/lit. It was decreases to 1194 mg/lit, 1183 mg/lit, 1143 mg/lit., 1168 mg/lit, and 1127 mg/lit with the addition of 10 mg/lit., 20 mg/lit., 30 mg/lit., 40 mg/lit, and 50 mg/lit. of MgSO4 nano particles respectively Table – 5. The reduction in the chloride value might be due to the replacement of chloride by perchlorate ions in plain sedimentation.
The Sulphate value of the raw effluent was 1900 mg/lit. It was decreases to1397 mg/lit, 1351 mg/lit, 1297 mg/lit, 1275 mg/lit and 1243 mg/lit. with the addition of 10 mg/lit., 20 mg/lit., 30 mg/lit., 40 mg/lit,50 mg/lit of MgSO4 nano particles respectively Table – 5. The reduction in the Sulphate value might be due to the oxidation of Sulphate form into elementary sulphur, which formed flocculation and undergo plain sedimentation.
The BOD of the raw effluent was350 mg/lit and decreases to 324 mg/lit, 312 mg/lit , 298 mg/lit, 286 mg/lit, and 273 mg/lit with the addition of 10 mg/lit., 20 mg/lit., 30 mg/lit., 40 mg/lit,50 mg/lit of MgSO4 nano particles respectively Table – 5. The decrease in BOD might be due to coagulating effect of the complex with bio organic compounds. It is evident that heavy metals are toxic to aquatic microorganisms beyond certain concentration.
The COD value of the raw effluent was 2311 mg/lit and decrease to 2198 mg/lit, 2143 mg/lit, 2083 mg/lit, 2041 mg/lit, and 2005 mg/lit with the addition of 10 mg/lit., 20 mg/lit., 30 mg/lit., 40 mg/lit,50 mg/lit of MgSO4 nano particles respectively Table – 5. This reduction in COD might be due to nitrogenous increment in waste water by addition of dosed MgSO4 nano particles.
The Alkalinity of the raw effluent was 2860 mg/lit and decrease to 2630 mg/lit, 2542 mg/lit, 2367 mg/lit, 2277 mg/lit, and 2168 mg/lit with the addition of 10 mg/lit., 20 mg/lit., 30 mg/lit., 40 mg/lit,50 mg/lit of MgSO4 nano particles respectively Table – 5.
The Total Hardness of the raw effluent was 2000 mg/lit and decrease to 1414 mg/lit, 1383 mg/lit, 1375 mg/lit, 1366 mg/lit, and 1361 mg/lit with the addition of 10 mg/lit., 20 mg/lit., 30 mg/lit., 40 mg/lit, 50 mg/lit of MgSO4 nano particles respectively Table – 5.
The Calcium value of the raw effluent was 1080 mg/lit and decrease to 926 mg/lit, 904 mg/lit, 891 mg/lit, 876 mg/lit, and 863 mg/lit with the addition of 10 mg/lit., 20 mg/lit., 30 mg/lit., 40 mg/lit, 50 mg/lit of MgSO4 nano particles respectively Table – 5.
The Magnesium value of the raw effluent was 520 mg/lit and decrease to 462 mg/lit, 448 mg/lit, 422 mg/lit, 409 mg/lit, and 399 mg/lit with the addition of 10 mg/lit., 20 mg/lit., 30 mg/lit., 40 mg/lit, 50 mg/lit of MgSO4 nano particles respectively Table – 5.
The Sulphide value of the raw effluent was 15 mg/lit and decrease to 11 mg/lit, 8 mg/lit, 6 mg/lit, 5 mg/lit, and 3 mg/lit with the addition of 10 mg/lit., 20 mg/lit., 30 mg/lit., 40 mg/lit, 50 mg/lit of MgSO4 nano particles respectively Table – 5.
The Phosphate value of the raw effluent was 0.28 mg/lit and decrease to 0.22 mg/lit, 0.20 mg/lit, 0.17 mg/lit, 0.15 mg/lit, and 0.13 mg/lit with the addition of 10 mg/lit., 20 mg/lit., 30 mg/lit., 40 mg/lit, 50 mg/lit of MgSO4 nano particles respectively Table – 5.
The Sodium value of the raw effluent was 490 mg/lit and decrease to 473 mg/lit, 471 mg/lit, 467 mg/lit, 463 mg/lit, and 458 mg/lit with the addition of 10 mg/lit., 20 mg/lit., 30 mg/lit., 40 mg/lit, 50 mg/lit of MgSO4 nano particles respectively Table – 5.
The Potassium value of the raw effluent was 17 mg/lit and decrease to 13 mg/lit, 12 mg/lit, 11 mg/lit, 9 mg/lit, and 7 mg/lit with the addition of 10 mg/lit., 20 mg/lit., 30 mg/lit., 40 mg/lit, 50 mg/lit of MgSO4 nano particles respectively Table – 5.
The Nitrate value of the raw effluent was 2.00 mg/lit and decrease to 1.90 mg/lit, 1.85 mg/lit, 1.81 mg/lit, 1.77 mg/lit, and 1.74 mg/lit with the addition of 10 mg/lit., 20 mg/lit., 30 mg/lit., 40 mg/lit, 50 mg/lit of MgSO4 nano particles respectively Table – 5.
Table 5: Characterization of Dye effluent with MgSO4nano particle
| S.NO | Parameters | Unit | Raw Sample | 10 Mg/l | 20 Mg/l | 30 Mg/l | 40 Mg/l | 50 Mg/l |
| 1. | PH at 25oC | Number | 8.5 | 8.6 | 8.8 | 8.8 | 8.9 | 9.4 |
| 2. | Total Dissolved solids at 180oC | Mg/l | 15,216 | 8520 | 6490 | 6471 | 6432 | 6330 |
| 3. | Chlorides as Cl | Mg/l | 3500 | 1194 | 1183 | 1143 | 1168 | 1127 |
| 4. | Sulphide as SO42- | Mg/l | 1900 | 1397 | 1351 | 1297 | 1275 | 1243 |
| 5. | BOD (at 27oC for 3 days) | Mg/l | 600 | 324 | 312 | 298 | 286 | 273 |
| 6. | COD | Mg/l | 3400 | 2198 | 2143 | 2083 | 2041 | 2005 |
| 7. | Alkalinity | Mg/l | 7000 | 2630 | 2542 | 2367 | 2277 | 2168 |
| 8. | Total hardness | Mg/l | 4500 | 1414 | 1383 | 1375 | 1366 | 1361 |
| 9. | Calcium | Mg/l | 3000 | 926 | 904 | 891 | 876 | 863 |
| 10. | Magnesium | Mg/l | 900 | 462 | 448 | 422 | 409 | 399 |
| 11. | Sulphide | Mg/l | 27 | 11 | 8 | 6 | 5 | 3 |
| 12. | Phosphate | Mg/l | 1.59 | 0.22 | 0.20 | 0.17 | 0.15 | 0.13 |
| 13. | Sodium | Mg/l | 800 | 473 | 471 | 467 | 463 | 458 |
| 14. | Potassium | Mg/l | 30 | 13 | 12 | 11 | 9 | 7 |
| 15. | Nitrate | Mg/l | 5.10 | 1.90 | 1.85 | 1.81 | 1.77 | 1.74 |
Effect of CuSO4.5H2O Nano Particles on Dye Combined Waste Water
The pH of the raw effluent was 10.2 It was decreases to 9.7, 9.5, 9.4, 9.2 and 8.9 with addition of 10 mg/lit., 20 mg/lit., 30 mg/lit., 40 mg/lit, 50 mg/lit of CuSO4.5H2Onano particles respectivelyTable–6 due to the basic nature of the coagulant. The increase of pH might due to the release of the hydroxide ions in the complexes depict the change of pH as a function of the coagulant concentration.
The Total Dissolved Solid value of the raw effluent was 14,692 mg/lit and decrease to 12,300 mg/lit , 12,000 mg/lit ,11,700 , 11,100 mg/lit and 10,400 mg/lit with the addition of 10 mg/lit., 20 mg/lit., 30 mg/lit., 40 mg/lit,50 mg/lit of CuSO4.5H2Onano particles respectively Table – 6. It was observed that there was reduction of TDS was imparted by the CuSO4.5H2O nano particles added. The main objective of chemical treatment is to remove colloids carried by the effluent. Since colloidal particles are charged particles, and these charged particle trapped using complexes carrying opposite charges in order to form flock and create density gradient between liquid and suspended solid phase (to reduce zeta potential of suspended colloidal particles).
The chloride value of the raw effluent was 2680 mg/lit. It was decreases to 2400 mg/lit, 2325 mg/lit, 2240 mg/lit., 2180 mg/lit, and 2100 mg/lit with the addition of 10 mg/lit., 20 mg/lit., 30 mg/lit., 40 mg/lit, and 50 mg/lit of CuSO4.5H2O nano particles respectively Table – 6. The reduction in the chloride value might be due to the replacement of chloride by per chlorate ions in plain sedimentation.
The Sulphate value of the raw effluent was 4418 mg/lit. It was decreases to 4239 mg/lit, 4180 mg/lit,3972 mg/lit,3680 mg/lit and 3379 mg/lit. with the addition of 10 mg/lit., 20 mg/lit., 30 mg/lit., 40 mg/lit,50 mg/lit of CuSO4.5H2O nano particles respectively Table – 6. The reduction in the Sulphate value might be due to the oxidation of Sulphate form into elementary Sulphur, which formed flocculation and undergo plain sedimentation.
The BOD of the raw effluent was 486 mg/lit and decreases to 430 mg/lit, 425 mg/lit , 415 mg/lit, 405 mg/lit, and 400 mg/lit with the addition of 10 mg/lit., 20 mg/lit., 30 mg/lit., 40 mg/lit,50 mg/lit of CuSO4.5H2O nano particles respectively Table – 6. The decrease in BOD might be due to coagulating effect of the complex with bio organic compounds. It is evident that heavy metals are toxic to aquatic microorganisms beyond certain concentration.
The COD value of the raw effluent was 3560 mg/lit and decrease to 3200 mg/lit, 3120 mg/lit, 3040 mg/lit, 2970 mg/lit, and 2880 mg/lit with the addition of 10 mg/lit., 20 mg/lit., 30 mg/lit., 40 mg/lit,50 mg/lit of CuSO4.5H2Onano particles respectively Table – 6. This reduction in COD might be due to nitrogenous increment in waste water by addition of dosed complexes.
The Alkalinity of the raw effluent was 6900 mg/lit and decrease to 6200 mg/lit, 6175 mg/lit, 6150 mg/lit, 6120 mg/lit, and 6100 mg/lit with the addition of 10 mg/lit., 20 mg/lit., 30 mg/lit., 40 mg/lit,50 mg/lit of CuSO4.5H2Onano particles respectively Table – 6.
The Total Hardness of the raw effluent was 7000 mg/lit and decrease to 6500 mg/lit, 6460 mg/lit, 6400 mg/lit, 6340 mg/lit, and 6300 mg/lit with the addition of 10 mg/lit., 20 mg/lit., 30 mg/lit., 40 mg/lit, 50 mg/lit of CuSO4.5H2Onano particles respectively Table – 6.
The Calcium value of the raw effluent was 2100 mg/lit and decrease to 1400 mg/lit, 1384 mg/lit, 1372 mg/lit, 1367 mg/lit, and 1362 mg/lit with the addition of 10 mg/lit., 20 mg/lit., 30 mg/lit., 40 mg/lit, 50 mg/lit of CuSO4.5H2Onano particles respectively Table – 6.
The Magnesium value of the raw effluent was 840 mg/lit and decrease to 729 mg/lit, 717 mg/lit, 702 mg/lit, 693 mg/lit, and 680 mg/lit with the addition of 10 mg/lit., 20 mg/lit., 30 mg/lit., 40 mg/lit, 50 mg/lit of CuSO4.5H2Onano particles respectively Table – 6.
TheSulphide value of the raw effluent was 18 mg/lit and decrease to 12 mg/lit, 11 mg/lit, 10 mg/lit, 9 mg/lit, and 8 mg/lit with the addition of 10 mg/lit., 20 mg/lit., 30 mg/lit., 40 mg/lit, 50 mg/lit of CuSO4.5H2 On ano particles respectivelyTable – 6.
The Phosphate value of the raw effluent was 0.78 mg/lit and decrease to 0.62 mg/lit, 0.58 mg/lit, 0.47 mg/lit, 0.35 mg/lit, and 0.33 mg/lit with the addition of 10 mg/lit., 20 mg/lit., 30 mg/lit., 40 mg/lit, 50 mg/lit of CuSO4.5H2Onano particles respectively Table – 6.
The Sodium value of the raw effluent was 980 mg/lit and decrease to 900 mg/lit, 885 mg/lit, 872 mg/lit, 861 mg/lit, and 840 mg/lit with the addition of 10 mg/lit., 20 mg/lit., 30 mg/lit., 40 mg/lit, 50 mg/lit of CuSO4.5H2Onano particles respectively Table – 6.
The Potassium value of the raw effluent was 32 mg/lit and decrease to 25 mg/lit, 17 mg/lit, 14 mg/lit, 13 mg/lit, and 11 mg/lit with the addition of 10 mg/lit., 20 mg/lit., 30 mg/lit., 40 mg/lit, 50 mg/lit of CuSO4.5H2Onano particles respectively Table – 6.
The Nitrate value of the raw effluent was 3.03 mg/lit and decrease to 2.37 mg/lit, 2.12 mg/lit, 1.82 mg/lit, 1.74 mg/lit, and 1.60 mg/lit with the addition of 10 mg/lit., 20 mg/lit., 30 mg/lit., 40 mg/lit, 50 mg/lit of CuSO4.5H2Onano particles respectively Table – 6.
Table 6: Characterization of Dye effluent with FeSO4.5H2Onano particles
| S.NO | Parameters | Unit | Raw Sample | 10 mg/L | 20mg/L | 30mg/L | 40 mg/L | 50 mg/L |
| 1. | PH at 25oC | Number | 8.5 | 8.5 | 8.8 | 9.0 | 9.2 | 9.8 |
| 2. | Total Dissolved solids at 180oC | Mg/l | 15,216 | 12,300 | 12,000 | 11,700 | 11,100 | 10,400 |
| 3. | Chlorides as Cl | Mg/l | 3500 | 2400 | 2325 | 2240 | 2180 | 2100 |
| 4. | Sulphide as SO4 | Mg/l | 1900 | 4239 | 4180 | 3972 | 3680 | 3379 |
| 5. | BOD (at 27oC for 3 days) | Mg/l | 600 | 430 | 425 | 415 | 405 | 400 |
| 6. | COD | Mg/l | 3400 | 3200 | 3120 | 3040 | 2970 | 2880 |
| 7. | Alkalinity | Mg/l | 7000 | 6200 | 6175 | 6150 | 6120 | 6100 |
| 8. | Total hardness | Mg/l | 4500 | 6500 | 6460 | 6400 | 6340 | 6300 |
| 9. | Calcium | Mg/l | 3000 | 1400 | 1384 | 1372 | 1367 | 1362 |
| 10. | Magnesium | Mg/l | 900 | 729 | 717 | 702 | 693 | 680 |
| 11. | Sulphide | Mg/l | 27 | 12 | 11 | 10 | 9 | 8 |
| 12. | Phosphate | Mg/l | 1.59 | 0.62 | 0.58 | 0.47 | 0.35 | 0.33 |
| 13. | Sodium | Mg/l | 800 | 900 | 885 | 872 | 861 | 840 |
| 14. | Potassium | Mg/l | 30 | 25 | 17 | 14 | 13 | 11 |
| 15. | Nitrate | Mg/l | 5.10 | 2.37 | 2.12 | 1.82 | 1.74 | 1.60 |
The pH of the raw effluent was 8.5. It was increased to 8.5, 8.8, 9.0, 9.2, and 9.8 with addition of 10 mg/lit., 20 mg/lit., 30 mg/lit., 40 mg/lit, 50 mg/lit of nano adsorbent of FeSO4.7H2O respectively Table –7 due to the basic nature of the coagulant. The increase of pH might due to the release of the hydroxide ions in the complexes depict the change of pH as a function of the coagulant concentration.
The Total Dissolved Solid value of the raw effluent was 15,216 and decrease to 13,172mg/l , 13,041 mg/l ,12,840 mg/l , 12,520 mg/l and 12,163 mg/lit with the addition of 10 mg/lit., 20 mg/lit., 30 mg/lit., 40 mg/lit,50 mg/lit of nano adsorbent of FeSO4.7H2O respectively Table – 7. It was observed that there was reduction of TDS was imparted by the chemicals (complexes) added. The main objective of chemical treatment is to remove colloids carried by the effluent. Since colloidal particles are charged particles, and these charged particle trapped using complexes carrying opposite charges in order to form flock and create density gradient between liquid and suspended solid phase (to reduce zeta potential of suspended colloidal particles).
The chloride value of the raw effluent was3500 mg/lit. It was decreases to 2821 mg/lit, 2735 mg/lit, 2613 mg/lit., 2521 mg/lit, and 2405 mg/lit with the addition of 10 mg/lit., 20 mg/lit., 30 mg/lit., 40 mg/lit, and 50 mg/lit. of nano adsorbent of FeSO4.7H2O respectively Table – 7. The reduction in the chloride value might be due to the replacement of chloride by perchlorate ions in plain sedimentation.
The Sulphate value of the raw effluent was 1900 mg/lit. It was decreases to 1725 mg/lit, 1707 mg/lit,1696 mg/lit,1670 mg/lit and 1649 mg/lit. with the addition of 10 mg/lit., 20 mg/lit., 30 mg/lit., 40 mg/lit,50 mg/lit of nano adsorbent of FeSO4.7H2O respectively Table – 7. The reduction in the Sulphate value might be due to the oxidation of Sulphate form into elementary sulphur, which formed flocculation and undergo plain sedimentation.
The BOD of the raw effluent was 600 mg/lit and decreases to 492 mg/lit, 450 mg/lit , 430 mg/lit, 417 mg/lit, and 402 mg/lit with the addition of 10 mg/lit., 20 mg/lit., 30 mg/lit., 40 mg/lit,50 mg/lit of nano adsorbent of FeSO4.7H2O respectively Table – 7. The decrease in BOD might be due to coagulating effect of the complex with bio organic compounds. It is evident that heavy metals are toxic to aquatic microorganisms beyond certain concentration.
The COD value of the raw effluent was 3400 mg/lit and decrease to 2688 mg/lit, 2640 mg/lit, 2616 mg/lit, 2593 mg/lit, and 2574 mg/lit with the addition of 10 mg/lit., 20 mg/lit., 30 mg/lit., 40 mg/lit,50 mg/lit. of complexes respectively Table – 7. This reduction in COD might be due to nitrogenous increment in waste water by addition of dosed nano adsorbent of FeSO4.7H2O.
The Alkalinity of the raw effluent was 7000 mg/lit and decrease to 6132 mg/lit, 6109 mg/lit, 6094 mg/lit, 6079 mg/lit, and 6050 mg/lit with the addition of 10 mg/lit., 20 mg/lit., 30 mg/lit., 40 mg/lit,50 mg/lit of nano adsorbent of FeSO4.7H2O respectively Table – 7.
The Total Hardness of the raw effluent was 4500 mg/lit and decrease to 3725 mg/lit, 3520 mg/lit, 3415 mg/lit, 3211 mg/lit, and 3113 mg/lit with the addition of 10 mg/lit., 20 mg/lit., 30 mg/lit., 40 mg/lit, 50 mg/lit of nano adsorbent of FeSO4.7H2O respectively Table – 7.
The Calcium value of the raw effluent was 3000 mg/lit and decrease to 2310 mg/lit, 2262 mg/lit, 2174 mg/lit, 2033 mg/lit, and 1983 mg/lit with the addition of 10 mg/lit., 20 mg/lit., 30 mg/lit., 40 mg/lit, 50 mg/lit of nano adsorbent of FeSO4.7H2O respectively Table – 7.
The Magnesium value of the raw effluent was 900 mg/lit and decrease to 834 mg/lit, 815 mg/lit, 793 mg/lit, 784 mg/lit, and 762 mg/lit with the addition of 10 mg/lit., 20 mg/lit., 30 mg/lit., 40 mg/lit, 50 mg/lit of nano adsorbent of FeSO4.7H2O respectivelyTable – 7.
The Sulphide value of the raw effluent was 27 mg/lit and decrease to 19 mg/lit, 15 mg/lit, 13 mg/lit, 10 mg/lit, and 9 mg/lit with the addition of 10 mg/lit., 20 mg/lit., 30 mg/lit., 40 mg/lit, 50 mg/lit of nano adsorbent of FeSO4.7H2O respectivelyTable – 7.
The Phosphate value of the raw effluent was 1.59 mg/lit and decrease to 1.03 mg/lit, 0.95 mg/lit, 0.81 mg/lit, 0.62 mg/lit, and 0.53 mg/lit with the addition of 10 mg/lit., 20 mg/lit., 30 mg/lit., 40 mg/lit, 50 mg/lit of nano adsorbent of FeSO4.7H2O respectively Table – 7.
The Sodium value of the raw effluent was 800 mg/lit and decrease to 713 mg/lit, 685 mg/lit, 661 mg/lit, 632 mg/lit, and 614 mg/lit with the addition of 10 mg/lit., 20 mg/lit., 30 mg/lit., 40 mg/lit, 50 mg/lit of nano adsorbent of FeSO4.7H2O respectively Table – 7.
The Potassium value of the raw effluent was 30 mg/lit and decrease to 26 mg/lit, 23 mg/lit, 17 mg/lit, 15 mg/lit, and 12 mg/lit with the addition of 10 mg/lit., 20 mg/lit., 30 mg/lit., 40 mg/lit, 50 mg/lit of nano adsorbent of FeSO4.7H2O respectively Table – 7.
The Nitrate value of the raw effluent was 5.10 mg/lit and decrease to 4.13 mg/lit, 3.87 mg/lit, 3.65 mg/lit, 3.41 mg/lit, and 3.12 mg/lit with the addition of 10 mg/lit., 20 mg/lit., 30 mg/lit., 40 mg/lit, 50 mg/lit of nano adsorbent of FeSO4.7H2O respectively Table – 7.
Table 7: Characterization of Dye effluent with FeSO4.7H2Onano particles
| S.NO | Parameters | Unit | Raw Sample | 10 Mg/l | 20 Mg/l | 30 Mg/l | 40 Mg/l | 50 Mg/l |
| 1. | PH at 25oC | Number | 8.5 | 8.8 | 9.0 | 9.1 | 9.1 | 9.4 |
| 2. | Total Dissolved solids at 180oC | Mg/l | 15,216 | 13,172 | 13,041 | 12,840 | 12,520 | 12,163 |
| 3. | Chlorides as Cl | Mg/l | 3500 | 2821 | 2735 | 2613 | 2521 | 2405 |
| 4. | Sulphide as SO4 | Mg/l | 1900 | 1725 | 1707 | 1696 | 1670 | 1649 |
| 5. | BOD (at 27oC for 3 days) | Mg/l | 600 | 492 | 450 | 430 | 417 | 402 |
| 6. | COD | Mg/l | 3400 | 2688 | 2640 | 2616 | 2593 | 2574 |
| 7. | Alkalinity | Mg/l | 7000 | 6132 | 6109 | 6094 | 6079 | 6050 |
| 8. | Total hardness | Mg/l | 4500 | 3725 | 3520 | 3415 | 3211 | 3113 |
| 9. | Calcium | Mg/l | 3000 | 2310 | 2262 | 2174 | 2033 | 1983 |
| 10. | Magnesium | Mg/l | 900 | 834 | 815 | 793 | 784 | 762 |
| 11. | Sulphide | Mg/l | 27 | 19 | 15 | 13 | 10 | 9 |
| 12. | Phosphate | Mg/l | 1.59 | 1.03 | 0.95 | 0.81 | 0.62 | 0.614 |
| 13. | Sodium | Mg/l | 800 | 713 | 685 | 661 | 632 | 614 |
| 14. | Potassium | Mg/l | 30 | 26 | 23 | 17 | 15 | 12 |
| 15. | Nitrate | Mg/l | 5.10 | 4.13 | 3.87 | 3.65 | 3.41 | 3.12 |
Conclusion
From this study, we concluded that the retardation of physico chemicals from dye wastewater by adsorption on metal nano particles useful for controlling water pollution. It was confirmed that higher removal of physico chemical pollutants from dye effluents adsorbent dose of more than 50mg/L was favorable. Even though the removal efficiency of these three metal nano particles (MgSO4, CuSO4.5H2O and FeSO4.7H2O) are not much higher than other cheaply available adsorbents and easy synthesis process. An attempt made to surroundings pleasant adsorbent big chemical pollutants elimination may be executed. So it may be substituting different pricey adsorbents. With the experimental data acquired in this study, it’s far viable to design and optimize an economical treatment manner for the undesirable chemical compounds elimination from commercial effluents.
References
- Neamtu. M., Siminiceanu I., Yediler A. and Kettrup A., Dyes Pigments, 2002.,53, 93.
- Jumaasiam. A., Chuab T.G., Gimbon J., Choong T.S. and Azmi I., Desalination, 2005.,186., 57.
- Setamanit S., Fongasatitul P. and Sivadechathep J., ASEAN Acheivement and Future Directions in Pollution Control, Ministry of Science Tech. and Environ., Thailand, 2002.,27., 33.
- Janas P., Buchtora H. and Ruzmarava M., Water Res., 2003.,37., 4938.
CrossRef - Mall I.D. and Upadhyay S.N., Indian J. Environ. Hlth., 1998., 40 ., 177.
- Chen C.C., LiaU H. J., Cheng C.Y., Yen C.Y. and Chung Y.C., Biotechnol. Lett., 2007.,29 ., 391
CrossRef - Saha P., Chowdhury S., Gupta S., Kumar I. and Kumar R., Clean : Soil Air, Water 2010.,38(56) 437 .
CrossRef - Rochat J., Demenge P. and Rerat J.C., Toxicol. Eur. Res., 1978 ., 1 .,23.
- Adamson A.W.,”Physical chemistry of surfaces,”Inter Science publ.Inc.,New york,1960
- Mckay G. , Oterburn M.S. and Sweeney A.G., Water Res., 1980.,14.,15.
CrossRef - Ho, Y.S., Porter, J.F., McKay, G.,. Water Air Soil Pollution, 2002 141, 1–33.
CrossRef

This work is licensed under a Creative Commons Attribution-NonCommercial-ShareAlike 4.0 International License.

This work is licensed under a Creative Commons Attribution 4.0 International License.
![]()
A New Edition of Web of Science
Journal Impact Factor
2022: 0.5
Five Year: 0.8
Journal is Indexed in

Cabells Whitelist
![]()


