Production of Biogas from Palm Oil Mill Effluent at Pilot Scale: Effect of Recycle Sludge
Irvan1,2 , Bambang Trisakti1,2, Seri Maulina1,2 and Hiroyuki Daimon3
1Department of Chemical Engineering, Universitas Sumatera Utara, Medan, 20155, Indonesia.
2Sustainable Energy and Biomaterial Center of Excellence, Universitas Sumatera Utara, Medan, 20155, Indonesia.
3Department of Environmental and Life Sciences, Toyohashi University of Technology, Toyohashi, 441-8580, Japan.
Corresponding Author E-mail: irvan@usu.ac.id
DOI : http://dx.doi.org/10.13005/ojc/340118
An anaerobic digestion of palm oil mill effluent (POME) for production of biogas was carried out at pilot scale under thermophilic condition. The objective of this research is to maintain short hydraulic retention time (HRT) and high degradation of the POME to biogas by applying recycle sludge. Fresh POME from PTPN IV without further treatment was used as feed. The fermentation process occurred in a digester tank with the type of continuous stirred tank reactor has a volume of 3 m3 equipped with electrical heaters, mixer, insulators, and baffles in it. To create continuous operation, fresh POME was fed intermittently. A series of experiments with and without recycle sludge were conducted with 616 litres palm oil mill effluent/day feed rate, temperature of feed tank 70oC, digester tank temperature of 55oC, stirring rate of 37.5 rpm, six days of hydraulic retention time, and 34% of recycle sludge. The result showed that by extending solid retention time in return sludge process where 34% of digested slurry recycled to the digester, improvement of volatile solid (VS) degradation was obtained around 82.83% at HRT of 6 days. Then, chemical oxygen demand (COD) removal efficiency could be reached until 81% by performing recycle sludge.
KEYWORDS:Anaerobic Digestion; Biogas; Palm Oil Mill Effluent; Thermophilic; Pilot Plant; Recycle Sludge
Download this article as:| Copy the following to cite this article: Irvan I, Trisakti B, Maulina S, Daimon H. Production of Biogas from Palm Oil Mill Effluent at Pilot Scale: Effect of Recycle Sludge. Orient J Chem 2018;34(1). |
| Copy the following to cite this URL: Irvan I, Trisakti B, Maulina S, Daimon H. Production of Biogas from Palm Oil Mill Effluent at Pilot Scale: Effect of Recycle Sludge. Orient J Chem 2018;34(1). Available from: http://www.orientjchem.org/?p=43411 |
Introduction
Crude palm oil (CPO) is one of major products in Indonesia. In 2012 Indonesia produced approximately 23.5 million tons of CPO [1]. It makes Indonesia as the largest CPO producer in the world. But in relation with that, the amount of palm oil mill effluent (POME) generated is also bigger, estimated at three times of CPO production. In general, about 675 liter of POME is produced for every tonne of fresh fruit bunches (FFB) processed [2].
The most common method used to process POME is the open ponding systems include the cooling pond, anaerobic pond, facultative pond, and aerobic pond. This method is a cheap and easy operating system but it has some disadvantages such as requires a long retention time, the need of large areas, bad odor and the release of methane emission to the atmosphere[3-5].
Irvan et al in 2012 conducted POME conversion into biogas using anaerobic microbes in a 2 (two) liters continuous stirred tank reactor (CSTR) at temperature of 55°C (thermophilic), closed systems, intermittent, and HRT variation. The results showed that degradation of COD was still less than 80%, at HRT 10 days [6]. In order to improve the COD degradation, they performed similar experiment by recycling the sludge to the digester in the next research [7]. By extending SRT in return sludge process where 25% of digested slurry recycled to the digester, improvement of volatile solid (VS) degradation was obtained around 84% at HRT of 6 days and SRT of 21 days. Then, chemical oxygen demand (COD) removal efficiency could be reached until 85% by performing recycle sludge. In 2016, Irvan et al, has scaled up the process from laboratory scale to pilot scale, they reported the performance of the two different scales under the same conditions and same POME. Therefore this research was aimed to study the effect of recycle sludge in the new methane fermentation system capable of maintaining high speed and high degradation of POME to biogas at pilot scale.
Materials and Method
Palm Oil Mill Effluent
As the raw material for the experimental anaerobic digestion observed, a real POME taken from PTPN IV Mill wastewater treatment installation were used. Table 1 summarizes the main chemical and physical properties of POME.
Table 1: Properties of POME from PTPN IV Mill
|
Parameter |
Unit |
Values |
| Total solid |
mg/L |
65,000 |
| Volatile solid |
mg/L |
54,000 |
| Suspended Solid |
mg/L |
35,000 |
| BOD |
mg/L |
60,000 |
| CODcr |
mg/L |
100,000 |
| TOD |
mg/L |
75,000 |
| Kj-N |
mg/L |
1,200 |
| NH4-N |
mg/L |
80 |
| Oil and grease |
mg/L |
9,000 |
| C |
wt % |
46.5 |
| H |
wt% |
6.5 |
| N |
wt% |
2.2 |
| S |
wt% |
0.43 |
| P |
wt% |
– |
| COD : N : P |
– |
350 : 4.5 : 0.85 |
| Carbohydrate |
wt% |
58.5 |
| Glucide |
wt% |
47.5 |
| Cellulose |
wt% |
6.0 |
| Hemicellulose |
wt% |
0.0 |
| Lignin |
wt% |
4.5 |
| Protein |
wt% |
11.0 |
| Lipid |
wt% |
14.0 |
Supported chemicals used were trace metals (FeCl2, Ni.6H2O and CoCl2.6H2O) and NaHCO3. The purpose of adding NaHCO3 was to maintain digester pH of 6.8-7.2 and M-alkalinity content of ≥ 3.000 mg/l. While the purpose of addition of FeCl2, Ni.6H2O, and CoCl2.6H2O is to minimize H2S production and for anaerobic microbe metabolism.
Pilot Scale of Anaerobic Treatment of POME
The pilot scale plant was located at a Centre of Community Service of Universitas Sumatera Utara. Figure 1 shows the flow sheet of the pilot plant. The pilot plant consists of main equipment such as: the mixture tank, biogas digester, gas storage, compressor, and biogas generator set. There are two main units include in this process, namely the biogas production unit and the power plant unit. The biogas production unit is a unit that converts POME to biogas. Meanwhile, the power plant unit is a unit that converts biogas into electricity.
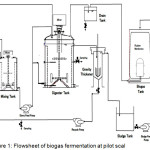 |
Figure 1: Flowsheet of biogas fermentation at pilot scale Click here to View figure |
The biogas production unit consists of several main equipments: 1,000 litres of feed tank, 3,700 litres of digester tank, 160 litres of mixer tank, 260 litres of gravity thickener, biogas catcher tank equipped with 2,800 litres rubber balloon, a compressor and high pressure biogas tank. The power plant was equipped by engine drive and generator. Engine drive is the used engine of Daihatsu car. Originally, a propulsion engine is a gasoline engine-modified fuel so it can use biogas as fuel. While, the electrical generator is a 3 phase motor with a capacity of 12 kWh. Produced gases were then flown into the water trap to collect the unexpected water in the biogas. The flow of the produced biogas was measured by using gas meter. Biogas were sucked by compressor then flown to the generator set to generate the electricity.
Experimental Method
Experiments were performed in two methods: with and without recycle sludge. Mass balance of recycle sludge in the continuous stirred tank reactor (CSTR) was analyzed in previous study [7]. Loading up was carried out based on the increased production of biogas which measured by using a wet gas meter (SHINAGAWA, Model W-NK-0.5B). Hydraulic retention time (HRT) of both methods was maintained at 6 days. If biogas production raised by 20%, then the loading up was increased by 20% as well, until HRT 6 days was achieved.
Digested slurry was allowed to settle in a 260 liters of gravity thickener before 34% of it was recycled to the digester. After that, the recycled sludge was analyzed by chemical oxygen demand (COD), total solid (TS), volatile solid (VS), alkalinity, and pH. Concentrations of H2S and CO2 in the biogas were measured by using a suction gas injector (GASTEC, type GV-100S) and inspection tube (GASTEC, 25 ~ 1600 ppm).
Results and Discussions
Biogas Production in Anaerobic Fermentation Process with and Without Recycle Sludge
Biogas production in the anaerobic fermentation process without recycle sludge needs to be compared with recycle sludge process to see the increase of biogas production due to recycle sludge. For this purpose, experiment of POME fermentation on pilot scale with 616 L/day feed rate, feed temperature at 70oC feed tank, 55oC digester temperature, stirring rate 37,5 rpm, HRT target 6 days and recycle sludge 34% was performed. The biogas production rate per mg VS degraded for POME fermentation both with recycle sludge and without recycle are presented in Figure 2.
During the observation for non-recycle sludge system, it was obtained that the production rate of biogas per mg VS degraded fluctuated. At the beginning of the fermentation, biogas began to increase but at the end of the fermentation period the gas progressively stable. For fermentation without recycle, biogas production rate ranged from 0.0006 to 0.0013 L/mgVS days.
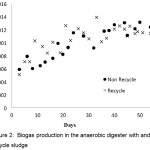 |
Figure 2: Biogas production in the anaerobic digester with and without recycle sludge Click here to View figure |
The similar trend is shown by the graph for fermentation with recycle sludge, at first gas production in recycle sludge is slightly higher than that produced by non recycle sludge. For fermentation with recycle sludge, biogas production rate ranged from 0.0005 to 0.0014 L/mgVS days. The same results are also shown by previous study at laboratory scale, where the recycle sludge does not have a significant effect on biogas production [7].
As shown in figure 2, for fermentation with recycle sludge the gas starts to rise slowly until it reaches a stable condition on day 43. However, after a stable period of gas production achieved, it starts to decrease. This is due to the recycle of sludge continuously into the digester, so that the ammonium content in the digester is increased due to the addition of ammonium bicarbonate (NH4HCO3). The ammonium content allowed in the digester is a maximum of 200 mg/L [9]. However, in this study the ammonium concentration contained in the reactor was 300 mg/L. Excess value of high ammonium in the digester can be toxic to microbes so that microbial performance becomes ineffective. Biogas production rate ranged from 0.0005 to 0.0015 L/mgVS days.
Effect of Recycle Sludge on M-alkalinity and pH
POME obtained from PTPN IV was acidic with pH ranged 3.9 – 4.6. For effective anaerobic digestion process, alkalinity values should range between 2,000 to 5,000 mg/L [8]. This range is intended to neutralize volatile acids (VS) and also to maintain the pH change, which should range between 6.8 – 8.5. In order to maintain to these ranges, additional substance such as sodium bicarbonate (NaHCO3) was put into the digester [9-10]. In the feed preparation of this experiment, 2.5 g/l of NaHCO3 was added to the fresh POME. The pH in the digester with recycle sludge increased to 7.5 from an initial value of 4.0. While, pH in the digester without recycle sludge increased from 4.0 to 7.7. The effect of recycle sludge on M-alkalinity POME fermentation process both with recycle sludge and without recycle are shown in Figure 3.
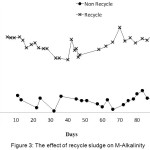 |
Figure 3: The effect of recycle sludge on M-Alkalinity Click here to View figure |
Alkalinity in the digester without recycle sludge was lower than with recycle sludge. This is due to the sludge which recycled into the digester has high concentration of bicarbonate, whereas the addition of NaHCO3 in the fresh POME was still performed, so that the bicarbonate accumulated in the digester. From the experimental results, the alkalinity range of fermentation with recycle sludge is in the range 3,000-5,000 mg/L, which is still within the optimum range for the bacteria working effectively between 2,000 – 5,000 mg/L.
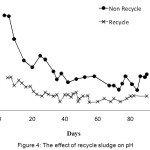 |
Figure 4: The effect of recycle sludge on pH
|
Figure 4 shows the effect of recycle sludge on pH digester, it can be seen that the fermentation with recycle sludge, pH ranged from 7.32 to 7.70. As for fermentation without recycle, pH ranged 7.50 to 8.46. The fermentation pH with or without recycle sludge is in the range of pH allowed for anaerobic fermentation to produce methane gas, between 6.8 – 8.5 [9]. The pH in recycle sludge is more stable than non recycle, the fluctuation of pH refers to the microbial conditions present in the digester.
Alkalinity of the wastewater has a relationship to the pH, if the alkalinity of the waste is high, then the pH will also increase. However, the graph obtained on figure 4 has unsuitable relationship where the high alkalinity is on the fermentation with recycle but high pH is in fermentation without recycle. This is due to the fermentation with recycle sludge has higher acidity level by the accumulation of acids formed due to sludge recovery.
Effect of Recycle Sludge on Total Solid and Volatile Solid
Changes in the amount of TS and VS values during the anaerobic fermentation process with recycle sludge need to be compared with the process without recycle to see the change in the amount of TS and VS due to recycle sludge. The effect of recycle sludge on changes in TS and VS values in POME fermentation process both with and without recycle is presented in Figure 5.
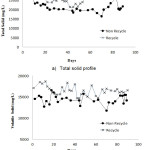 |
Figure 5: Effect of recycle sludge on total solid and volatile solid Click here to View figure |
As shown in Figure 5, in the fermentation without recycle sludge, TS decreased from 29,700 mg/L to at about 19,800 mg/L, then relatively constant at 20,000 mg/L. While, with recycle sludge TS relatively constant at value range 21,000 – 28,000 mg/L. TS in the digester with recycle sludge was higher than without recycle, this is because the sludge recycled to the digester came from the bottom of the gravity thickener that are still containing material with high TS. A similar profile is also shown for VS, where VS in the digester with recycle sludge was higher than without recycle. This occurs because the recycle of organic materials are degraded more than fermentation without recycle.
Effect of Recycle Sludge on VS Degradation Rate
The effect of recycle sludge on the rate of VS degradation in POME fermentation process with and without recycle sludge is shown in Figure 6.
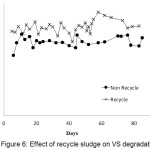 |
Figure 6: Effect of recycle sludge on VS degradation Click here to View figure |
As shown in Figure 6, in the fermentation process without recycle sludge at HRT 6 days, VS degradation had the highest value of 65% and the lowest value of 48.6%. While in the fermentation process with recycle sludge, due to the increase of solid retention time, VS degradation reached maximum value at 82.8 %, while the lowest value of 59% was achieved. In other words, the longer sludge time in the reactor increases the degradation rate at the same HRT by recycling the sludge into the digester. It can be concluded that fementation with recycle sludge has better performance than fermentation without recycle. Similar results were also obtained in previous study at laboratory scale [7].
Effect of Recycle Sludge on COD Removal
Many parameters have been used to measure the efficiency of an anaerobic process in terms of quality and quantity of biogas produced, however we still need the parameter that serve as an indicator to measure the quality of the liquid waste discharged from the digester which are also very important and should take into account for the standard quality of applicable industrial effluent. The most commonly used parameter in this case is COD (chemical oxygen demand), which is the indirect measure of the number of organic compounds, both biodegradable and non-biodegradable.
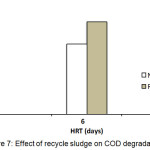 |
Figure 7: Effect of recycle sludge on COD degradation Click here to View figure |
Figure 7 shows the effect of recycle sludge on COD degradation. At HRT 6 days, fermentation of POME to biogas using recycle sludge, COD removal efficiency was 81%, while using non recycle sludge COD removal efficiency was only 76 %. This proves that the fermentation with recycle sludge can increase the COD removal in anaerobic process. This was confirmed by previous researchers who have demonstrated that COD removal efficiency in the fermentation with recycle sludge was lower than fermentation without recycle sludge [11-13].
Conclusions
This study has demonstrated the feasibility of anaerobic digestion of POME with recycle sludge at pilot scale. During the fermentation with recycle sludge, biogas generation was decreased due to the increasing of ammonium content. Alkalinity, TS, VS, and VS degradation in the digester with recycle was higher than without recycle sludge. In the same HRT, degradation rate of COD in fermentation with recycle was higher than without recycle, 81% and 76%, respectively.
Acknowledgment
The authors gratefully acknowledge the support from Metawater Co. Ltd – Japan.
References
- Directorate General Estate Crop, Agricultural Statistics Database, Jakarta: Ministry of Agriculture, 2016
- Ma, A.N.; Toh, T.S.; Chua, N.S.; “Renewable energy from oil palm industry,” in G. Singh, K.H. Lim, T. Leng, L.K. David, (Eds.), Oil Palm and the Environment: A Malaysian Perspective. Malaysia Oil Palm Grower’s Council, Kuala Lumpur, 1999, 113-126
- Igwee, J.C.; Onyegbado, C.C.; Global J. of Environ. Res. 2007, 1(2): 54-62
- King, L.S.; Yu, L.C.; Eur. Int. J. Sci. Tech. 2013, 2 106-114
- Yacob, S.; Hassan, M.A.; Shirai, Y.; Wakisaka, M.; Subash, S.; Chemosphere, 2005, 59 1575–1581
CrossRef - Irvan, Trisakti, B.; Wongistani, V.; and Tomiuchi, Y.; Int. J. Sci. Eng. 2012, 3 32-35
- Irvan, Trisakti B.; Tomiuchi, Y.;, Harahap, U.; Daimon, H.; IOP Conf. Series: Materials Sci. Eng. 2017, 206 012094
- Olvera, J.R.; and Lopez, A.L.; Biogas production from anaerobic treatment of agro-industrial wastewater, Rijeka: Intech, 2012
- Metcalf and Eddy, Inc. Wastewater engineering: Treatment and reuse, McGraw-Hill New York, 2003
- Gerardi, M.H.; Wastewater bacteria, Wiley-Interscience New Jersey, 2006
- Lee, D.Y.; Ebie, Y.; Xu, K.Q.; Li, Y.Y.; and Inamori, Y.; Bioresour. Technol. 2010, 101 S42-S47
- Busu, Z.; Sulaiman, A.; Hassan, M.A.; Shirai, Y.; Aziz, S.A.; Yacob, S.; and Wakisaka, M.; Pertanika J. Trop. Agric. Sci. 2010, 33 27-37.
- Gnanapragasam, G.; Senthilkumar, M.; Arutchelvan, V.; Sivarajan, P.; and Nagarajan, S.; World J. Microbiol. Biotechnol. 2010, 26 1093-1098.
CrossRef

This work is licensed under a Creative Commons Attribution-NonCommercial-ShareAlike 4.0 International License.

This work is licensed under a Creative Commons Attribution 4.0 International License.
![]()
A New Edition of Web of Science
Journal Impact Factor
2022: 0.5
Five Year: 0.8
Journal is Indexed in

Cabells Whitelist
![]()


