Optimization of Struvite Crystallization and Heavy Metal Recovery in Wastewater using Response Surface Methodology
D. S. Perwitasari1,3 , S. Muryanto2, J. Jamari3 and A. P. Bayuseno3,2
1Department of Chemical Engineering, Universitas Pembangunan National “Veteran” Jawa Timur, Surabaya 60294 Indonesia.
2Department of Chemical Engineering, UNTAG University in Semarang, Bendhan Dhuwur Campus, Semarang 50233, Indonesia.
3Department of Mechanical Enginering, Diponegoro University, Tembalang Campus, Semarang 50275, Indonesia.
Corresponding Author E-mail: saridyah05@gmail.com
DOI : http://dx.doi.org/10.13005/ojc/340136
In this study, the recovery of heavy metal (Cu2+, Pb2+, and Zn2+) concentrations and the yield of struvite from MAP precipitation in the wastewater were optimized by SRM (surface response methodology). Struvite was a major mineral precipitated with an impurity of sylvite (KCl) as confirmed by the XRPD Rietveld method, and struvite crystal has a prism-like shape morphology according to the SEM/EDX analysis. The SRM estimates that the concentration of Pb2+ has a significant effect of retarding the yield of the struvite mass, while insignificant effects were related to the Cu2+ and Zn2+concentration. The optimum yield of struvite was reached at 8.342 mg, of which 59.4564 ppm of Cu2+; 70.7930 ppm of Pb2+ and 77.2114 ppm of Zn2+ could be recovered from wastewater. These optimized conditions could be valuable input data for engineering-design software in an equipment of the effluent treatment plant.
KEYWORDS:MAP Precipitation; Struvite; Surface Response Methodology (SRM); Heavy Metals; Wastewater Treatment
Download this article as:| Copy the following to cite this article: Perwitasari D. S, Muryanto S, Jamari J, Bayuseno A. P. Optimization of Struvite Crystallization and Heavy Metal Recovery in Wastewater using Response Surface Methodology. Orient J Chem 2018;34(1). |
| Copy the following to cite this URL: Perwitasari D. S, Muryanto S, Jamari J, Bayuseno A. P. Optimization of Struvite Crystallization and Heavy Metal Recovery in Wastewater using Response Surface Methodology. Orient J Chem 2018;34(1). Available from: http://www.orientjchem.org/?p=42163 |
Introduction
MAP (Magnesium Ammonium Phosphate) precipitation could occur spontaneously on the surface of process pipes, pumps and other industrial equipment leading to scale deposition of struvite (MgNH4PO4·6H2O) minerals1,2. The scale deposition of MAP bearing minerals may decrease the performance of equipment and increase the maintenance cost. In contrast, the induced MAP precipitation in the wastewater promotes the beneficial crystallization of struvite, which is potentially as fertilizer1. Such precipitation technology has been widely implemented in wastewater treatment units for enhancing phosphate (PO4-P) recovery3.
In addition to phosphate, the heavy metals and organic pollutants (such as PCB and polycyclic aromatic hydrocarbon) are frequently available in the wastewater, which must be subsequently treated prior to its discharge into the environment. Conversely, their accumulation in the soil becomes a serious problem for sustainable agriculture. Also, strict regulations have been imposed on heavy metal concentrations in fertilizer products. On the other hand, MAP precipitation is known as the best approach to heavy metals and phosphate recovery, which is related to the nucleation and growth of struvite crystals in the solution, whereas desirable amounts of struvite can be precipitated typically through the gravitational settling process1.
Further, the conventional removal of toxic heavy metals from wastewaters may involve precipitation, cementation, sedimentation, filtration, coagulation, flotation, complexing, solvent extraction, membrane separation, electrochemical technique, biological process, reverse osmosis, ion exchange and, adsorption4. In the precipitation method, heavy metal and phosphate can be recovered by the crystallization of hydroxyl calcium phosphate and magnesium ammonium phosphate. However, the crystallization of hydroxyl calcium phosphate requires a long crystallization induction time and a large amount of seed crystal materials, hence leading to the difficulty for wide application of technology in the recovery of phosphate5. Recently, MAP crystallization for phosphate recovery offers its good separation performance, quick response rate, and high phosphorus recovery efficiency. This method is widely applied for phosphate removal from calf manure, leather tanning wastewater, swine wastewater, wasted sludge, industrial wastewater, municipal landfill leachate and poultry manure wastewater5, 6, 7.
MAP crystallization in aqueous solution with a 1:1:1 molar ratio of ions of [Mg2+], [NH4+] and [PO42-], can be expressed as the following equation (1)1:

The pH value, supersaturation, the temperature of the wastewater and the presence of metal ions could affect the extent of struvite production and its morphological characteristics3, 8, 9. Specifically, the high heavy metal content makes slower kinetic of the struvite crystallization in term of reduction in value of constant rate6, 10. While the value of constant rate decreases, the crystal growth also decreases due to the presence of a metal ion inhibitor. For instance, Zn was reported to the most effective in inhibiting crystal growth8. Correspondingly, a low or very low concentration of Cu, Pb, and Zn can be adsorbed on struvite surface. Moreover, the more concentrations of metal ions available in the solution make the decrease in the production of struvite8, 9, 11. Accordingly, the possibility of increasing the struvite production eventually requires a compromising stage between optimizing metal removal and the need for increasing phosphorus recovery during crystallization. In such case, the improvement of struvite production could be achieved through better control of process parameters influencing on MAP precipitation for metal recovery in the solution.
Correspondingly, the efficiency of MAP precipitation for recovering heavy metals could be influenced by many process parameters including pH, temperature, time, starting molar ratio, and metal concentration. In this way, multiple variables controlling the removal efficiency could be optimized using an effective method, namely the response surface methodology (RSM). The availability of the experimental design software makes this method in the most efficient way of modifying the experimentation required to optimize many parameters. Here SRM has been successfully used to model and optimize crystallization processes related to wastewater systems2, 12 and it may be an effective design of the experimental method to optimize struvite production and heavy metal removal from wastewater.
In the SRM approach, the experimental domain (D) could be specified with a number of factors (k-factors), which are represented by independent variables (x1, x2,….xk) and a polynomial model could be governed. Correspondingly, designs for an experimental run could be obtained, i.e. sets of experimental conditions, which present the estimates of less variance for coefficients and response. The polynomial model, with a p + 1 coefficient, is given to relating the experimental response to be optimized, y, with the k factors through the p variables (p ≥ k) as shown in Eq.(2).
Yi = b0 + b1x1 + b2x2 + … + bkxk ++ b11x12 + b22x22 + … + bkkxk2 + b12x1x2 + … + b1kx1xk + … + bk-1,k xk-1xk x1 (2)
Where xk+1,xk+2, …, xp are the cross-products and powers of the k factors,
x1, x2…xk, are the codified factors.
In such method, central composite, Dohelert, and Box Behnken designs are commonly employed in SRM, while the researcher can select the most suitable one for approaching the optimization problem.
The present research was undertaken to optimize MAP precipitation by SRM for struvite production and its effect on the metal ion uptake in wastewater. In this study, the central composite design (CCD) was employed to examine the effects of three metal concentrations (Cu, Pb, and Zn) on the optimization of mass yield response of struvite. The crystalline solid product was then characterized using the XRPD Rietveld method for mineral composition and SEM-EDX for morphology and chemical element analysis.
Materials and Methods
Preparation of Crystal-Forming Solution
The supersaturated solutions for the experiments were prepared by diluting the powder of MgCl2·6H2O and NH4H2PO4 with analytical grade chemicals (MerckTM), without further purification. In this way, both powder crystals were separately dissolved in a double-distilled water to provide the equimolar of 0.25 M for each ion Mg2+, NH4+, and PO4-3. The pH of both solutions was adjusted to be 6.5 by adding 0.5 N KOH solution. Cu2+, Pb2+ and Zn2+ stock solution was prepared by dissolving a specified mass of the corresponding CuCl2, PbCl2, and ZnCl2 in deionized water. Accordingly, the solution containing 0, 10 and 100 ppm of those metals was subsequently diluted into the stock standard of the MgCl2·6H2O solution. All solutions were then mixed in a 500 ml-glass beaker and stirred at 200 rpm and pH change was monitored by an Orion SA520 pH meter with a gel epoxy probe. The experiments for struvite crystallization was conducted by the gravitational settling process at ambient temperature. The precipitate was then obtained by filtering off in a paper (Schleicher and Schuell no. 604), washed with distilled water, and dried directly on the paper at room temperature. The time required the precipitation and filtration of struvite were about 90 minutes. The mass of dried precipitate was weighed using Sartorius weigh-scale.
Materials Characterization
Scanning electron microscopy (SEM) (JEOL JSM 5200) and energy dispersive X-ray spectroscopy (EDX) were used to examine the precipitate for recovering the ion-metal particles on the surface of struvite mineral. In this way, the dried precipitates with different particle sizes below 100 µm were previously embedded in epoxy on an Al-sample holder and sputtered with carbon for SEM/EDX analysis.
Phase identification of the precipitate was conducted by X-ray powder diffraction (XRPD) method through the data obtained from the Bragg-Brentano diffractometer (Philips 1830/40) measurement. The scan parameters (5-85O 2q, 0.020 steps, 15 s/step) were set-up for recording XRPD data of the sample. A PC-based search- match program (MATCH software) was initially employed for identifying candidate crystalline phases, which was subsequently verified by the Rietveld method available in the program13, 14, 15. The refined values of the cell parameters were used to calculate (wt. %) levels of mineralogical phases, which were performed by the program16.
Experimental Design and Optimization of Parameters
In this present study, the input variables (Cu2+, Pb2+, Zn2+ concentrations) and the yield response of the optimum mass (mg) was investigated by SRM and are given in Table 1. A multiple regression data analysis was conducted by the statistical v.6 software packages (StatSoft, Tulsa, OK, USA). The optimum values of the selected input variables were found by solving the regression equation and also by examining the response surface contour plots using equation [3]:

where Y is the estimated response; β0, βj, βij and βjj constant coefficients; Xi and Xj are the coded independent variables or factors; ε is random error.
Table 1: Range and level of independent variables.
| Independent variables |
Low Level (-1) |
Range and Level Center Level (0) |
High Level (+1) |
| Concentration Cu2+(ppm) |
0 |
10 |
100 |
| Concentration Pb2+(ppm) |
0 |
10 |
100 |
| Concentration Zn2+(ppm) |
0 |
10 |
100 |
Results and Discussion
Properties of the Solid Precipitate
The corresponding solids were then subjected to the XRPD Rietveld method as given in Figure 1a. The crystals are primarily composed of struvite and sylvite (KCl). Upon the quantitative Rietveld analyses, struvite was precipitated in the wastewater streams as the major mineral (about 99 wt.%) with a small amount of sylvite (< 0.5 wt.%). Although all data are not shown, obviously, the presence of three metal ions made unchanged the mineral composition of the precipitates (only 50 ppm of Cu, Pb, and Zn is shown in Figure 1b). Figure 2 shows the SEM image of the crystals obtained exhibiting aggregate formations of irregular prismatic-like crystalline of struvite. This formation was also confirmed again by EDX analysis in Figure 2, showing the chemical elements of Mg, O, and P corresponds to struvite composition. Moreover, the uptake of Cu2+ on the struvite surface was indicated by the element of Cu in the EDX spectrum. The similar results of metals (Pb and Zn) captured on the struvite surface were also observed by SEM/EDX, although the results were not shown in this paper. Accordingly, MAP precipitation demonstrated the recovery of metals and phosphate from the solution. An economic return of this precipitation process has been previously reported for the struvite production in the wastewater17. Therefore, this precipitation technology is potentially adapted to yield optimum struvite, which has its capability of heavy metal recovery, and the precipitating product can be used for fertilizer.
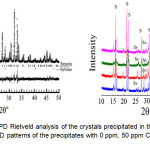 |
Figure 1a: Plot of XRPD Rietveld analysis of the crystals precipitated in the absence of metal ions. b) XRPD patterns of the precipitates with 0 ppm, 50 ppm Cu, 50 ppm Pb, and 50 ppm Zn. Click here to View figure |
The peaks are S (struvite) and Sv (sylvite) respectively.
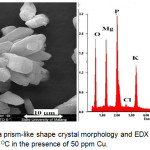 |
Figure 2: SEM image of a prism-like shape crystal morphology and EDX spectra obtained from the precipitates at the 30°C in the presence of 50 ppm Cu. Click here to View figure |
Predicted Model and Statistical Analysis
Model of response variables was optimized using SRM with the input data (Table 1), which consisted of 3 factorial design 2(3) providing nc = 8; ns = 6; no = 2 and run = 16. Correspondingly, the concentration range of Cu2+ (X1, 0-100ppm), Pb2+ (X2, 0-100ppm) and Zn2+ (X3, 0-100ppm) was selected for the calculation. Factors and their levels for SRM correspond to the low level (-1) = 0, high level (+1) = 100, and the center point (0) = 10. The whole design of yield response of mass precipitate (mg) is presented in Table 2.
Table 2: Design of experiments with independent variables.
| Run | Independent variables | Zn2+(ppm) | Responses | |
| Cu2+(ppm) | Pb2+ (ppm) | The mass of precipitate (mg) | ||
| 1 | 50 | 50 | 50 | 8.875 |
| 2 | 50 | 50 | 100 | 9.36 |
| 3 | 50 | 100 | 50 | 8.21 |
| 4 | 50 | 100 | 100 | 8.105 |
| 5 | 100 | 50 | 50 | 9.105 |
| 6 | 100 | 50 | 100 | 9.665 |
| 7 | 100 | 100 | 50 | 8.225 |
| 8 | 100 | 100 | 100 | 8.825 |
| 9 | 32.9552 | 75 | 75 | 8.605 |
| 10 | 117.0448 | 75 | 75 | 9.525 |
| 11 | 75 | 32.9552 | 75 | 9.445 |
| 12 | 75 | 117.0448 | 75 | 8.01 |
| 13 | 75 | 75 | 32.9552 | 9.075 |
| 14 | 75 | 75 | 117.0448 | 9.515 |
| 15 | 75 | 75 | 75 | 8.26 |
| 16 | 75 | 75 | 75 | 8.26 |
Regression analysis of the mathematical model for the optimization of independent variables was fitted to the polynomial Eq. [3], and the adjusted model obtained for struvite production (Y) can be expressed as Eq.(4).
Y = 14.56481 – 0.05912 X1+ 0.00035 X12– 0.03652 X2+ 0.00016 X22 – 0.06896 X3+ 0.00048 X32 + 0.00004 X1X2 + 0.00016 X1X3 – 0.00011 X2X3 (4)
Analysis of variance (ANOVA) was performed for determining the significance of the model given in Table 3. The function of more significant variables obviously fits with the quadratic regression model, because the calculated coefficient of determination (R2) was quite high (0.982). Moreover, the proposed model is considered statistically significant, according to the F-test with 95 % of confidence. Here F-value is defined as the ratio between MSF (mean squares of the factor) of the MSE (mean squares of error). Correspondingly the F-value of 86.362041 is much greater than the value of F-table (4.1) confirming that the model is significant at 95 % of confidence. Only 1.8 % of the total variation did not fit the model.
Table 3: ANOVA analyses of the yield response of crystalline mass.
|
Source |
Sum of squares (SS) |
Degree of freedom (DF) |
Mean Square (MS) |
F-value |
F-table |
R2 |
| S.S. RegressionS.S. ErrorS.S. Total |
5.141284 0.357191 5.498475 |
9 6 15 |
5.141284 0.059532 |
86.362041 |
4.1 |
0.982
|
The experimental results were also analysed in chart Pareto (Figure 3). Upon the analysis, p-value less than 0.05 is considered to have an insignificant effect contributed to the response. On the basis of the results given in Figure 4, it can be seen that concentrationof Pb2+ (X2) has major linear (L) effect for controlling struvite production, followed by concentration (L) of Cu2+ (X1) and Zn2+ (X3); and their quadratic effects (Q) for concentrations of Zn (X3)2; Cu2+ (X1)2 and Pb2+ (X2)2. However, the quadratic effect of concentration of Pb2+ (X2)2 can be ignored because they provide insignificant factor on the yield response of struvite precipitated.
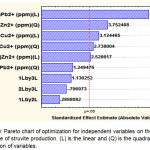 |
Figure 3: Pareto chart of optimization for independent variables on the yield response of struvite production. (L) is the linear and (Q) is the quadratic interaction of variables. Click here to View figure |
Optimization of Independent Variables for the Optimum Struvite Production
The graphical results of interactive independent and dependent variables are depicted by 3D and 2D contour plots, which enable to determine the optimum recovery of struvite (mass in mg) (Figs. 4-6). Different forms of the contour plots indicate the different interactive effects, where the significant interactions between the variables are shown in an elliptical contour plot. In contrast, a circular contour plot shows the insignificant interactive effects. Figure 4 presents the interaction between concentrations of Cu2+ and Pb2+ for the yield of struvite. As expected, the increased yield of struvite occurred at the highest concentration of Cu2+. However, the increased concentration of Pb2+in the solution made the reduced production of struvite. Additionally, Figure 5 presents the interactive effects of Cu2+ and Zn2+ concentrations on the yield of struvite. When increasing the concentrations of Cu2+ and Zn2+ were reached at 70 ppm, the high amount of struvite could be produced. In contrast, the concentrations of Cu2+and Zn2+ increased to above 70 ppm leading to the reduced production of struvite. Therefore, both Cu2+and Zn2+ have significant effects on retarding the struvite production. Conversely, the effect of Pb2+ on the struvite production was more apparent than Cu2+ and Zn2+ removal.
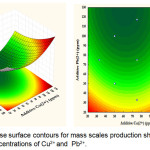 |
Figure 4: Response surface contours for mass scales production showing effects of interactive concentrations of Cu2+and Pb2+. Click here to View figure |
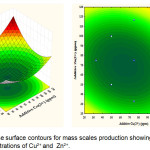 |
Figure 5: Response surface contours for mass scales production showing effects of interactive concentrations of Cu2+and Zn2+. Click here to View figure |
Furthermore, the interaction between the concentration of Pb2+ and concentration of Zn2+ on the yield of the mass of precipitate are shown in Figure 6. Apparently, the increase of concentrations of Pb2+ from 50 to 100 ppm made a decrease in the struvite production. Conversely, the more concentrations of Zn2+ available in the solution could be recovered at the increase of struvite production. Of the three metal ions, Zn2+could be the most insignificant effect in promoting crystal growth of struvite. This result was in close agreement with the previous reports in the literature8, 17.
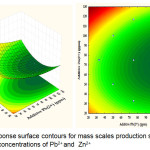 |
Figure 6: Response surface contours for mass scales production showing effects of interactive concentrations of Pb2+ and Zn2+ Click here to View figure |
Further, the use of the statistical v.6 software enabled to obtain the response surfaces which in turn allow the determination of optimum concentration from 2D and 3D contours. It can be concluded from Figures 4–6 that the optimum mass of struvite was quite effective to trap metals and the computed results are shown in Table 4.
Table 4: Optimum the mass of struvite (mg).
| Factor |
Optimum concentration (ppm) |
Optimum mass of precipitate (mg) |
| Concentration Cu2+(ppm) |
59.4564 |
|
| Concentration Pb2+(ppm) |
70.7930 |
8.342 |
| Concentration Zn2+(ppm) |
77.2114 |
Validation of the Predicted Value for the Optimal Variables
To validate the predicted value was performed by conducting experimental run with the optimum values of the process variables. Table 4 presents the optimum yield of struvite calculated using the input data of each concentration of Cu2+ (59.4564 ppm), Pb2+ (70.7930 ppm) and Zn2+ (77.2114 ppm), and hence providing 8.342 mg of the mass of precipitate. Referring to the experimental results is shown in Table 5, the mass precipitated at these concentrations was reached at 8.562 mg. Here the calculated % error in the mass of precipitate response was 2.56 %. This result implies that the calculated response of struvite production has an accuracy of 97.44 %.
Table 5: The predicted and experimental value of the response at the optimum level of metal concentration
|
Optimum variables |
|
Optimum Result (mg) |
Experimental Result (mg) |
% Relative error |
| Concentration Cu2+(ppm) | 59.4564 | |||
| Concentration Pb2+(ppm) |
70.7930 |
8.342 |
8.562 |
2.56% |
| Concentration Zn2+(ppm) |
77.2114 |
Relative error (%) = [(Experimental result– Optimum result by SRM)/Experimental result] × 100%.
It is noteworthy that the induced MAP precipitation through the formation of struvite from the synthetic wastewater offers an opportunity to recover nutrients and heavy metals. This method produced struvite which can be potential as a slow-release fertilizer. It is not only employed for sustainable recovery of wastewater phosphorus, but also for absorbing metals and organics which can enhance the property of fertilizer product with environmentally friendly. Moreover, a series of batch experiments had been conducted to assay the effect of heavy metals on the optimal struvite product. It demonstrates that the high concentration of metal ions in the range of 50 -80 ppm could be recovered with the optimum struvite crystals produced. Nevertheless, remaining works related to the agronomic bioavailability of struvite should be performed in a greenhouse experiment in order to be admitted as a synthetic plant fertilizer. Agronomic assays showed that struvite found in this study is similar to that of synthesis ammonium phosphate fertilizers.
In terms of the proposed study, pH of 6.5 was found to be a desirable value for removing heavy metal from wastewater by MAP precipitation18, 19, while changes in temperature may have no influence on the struvite production. In wastewater systems containing heavy metals with other inorganic substance, the presence of K+ in the solution may have no significant effect on the efficiency. However, the presence of Ca2+ may decrease the percentage of Mg2+ and NH4+ removal. Additionally, the presence of metal ions in the solution resulted in a reduction of mass and the crystal size of struvite20,21.
In general, the induced MAP precipitation was applied in this study offering various benefits such as their low and rapid processes, simple operation and control, flexibility to change of temperature. Unlike in biological systems, the precipitation can facilitate variable input loads and flow such as seasonal flows and complex discharge. Whenever it is needed, a chemical plant for wastewater treatment could be easily developed. Besides, the treatment system developed involves only a lower space and installation cost. Their advantages, however, are outweighed by a number of disadvantages such as their high operational costs due to the chemicals required, high-energy consumption and handling costs for sludge disposal. Nevertheless, in reducing additional cost of chemicals for the induced MAP precipitation, an industrial-grade (IG) MgO and Mg (OH)2 has been proposed as the low-cost magnesium sources, which can result in struvite to be prevalent in the precipitate21.
Conclusions
SRM optimization of variable concentrations of heavy metals in the wastewater provided that the availability of Pb2+ has the significant effect on the mass yield of struvite during precipitation. The optimum result of the mass response scale (8.342 mg) was reached at the concentration of Cu2+ of 59.4564 ppm, Pb2+of 70.7930 ppm, Zn2+ of 77.2114 ppm, respectively. Accordingly, a good achievement of modelling and optimization of struvite precipitation for heavy metal recovery was presented in this paper. The influence of selected parameters and thus model validation with insignificance parameters could be confirmed. Finally, an easy, simple, and cost-effective precipitation method could be implemented for wastewater treatment containing heavy metals, whereas the induced MAP precipitation provided the valuable fertilizer product rich in phosphorous.
Acknowledgments
The authors express their gratitude to the University of Pembangunan National “Veteran” Surabaya, East Java, Indonesia for providing this PhD research project.
References
- Doyle, J.D.; Parsons S.A. Water Res. 2002, 36, 3925-3940.
CrossRef - Capdeviellea, A.; Sykorová, E.; Biscans, B.; Bélinea, F.; Daumer, M-L. J. Hazard. Mater. 2013, 244-245, 357-369.
CrossRef - Doyle, J.D.; Oldring, K.; Churchley, J.; Price C.; Parsons, S.A. J. Environ. Eng.-ASCE, 2003, 129, 419-426.
CrossRef - Barakat, M.A. Arabian J. Chem. 2011, 4, 361–377.
CrossRef - Ge, F.; Li, M-M.; Ye, H.; Zhao, B-X. J. Hazard. Mater. 2012, 211– 212, 366– 372.
- Ronteltap. M.; Maurer, M.; Gujer, W. Water Res. 2007, 41, 977–984.
CrossRef - Wilsenach, J.; Schuurbiers C.; Van Loosdrecht, M.C.M. Water Res. 2007, 41, 458–466.
CrossRef - Muryanto, S.; Bayuseno, A.P. Powder Technol. 2014, 253, 602-607.
CrossRef - Stratful, I.; Scrimshaw, M.D.; Lester, J.N. Water Environ. Res. 2004, 76, 437-4199.
CrossRef - Saidou, H.; Atef, K.; Sami, B.M.; Mohamed, B.A. Open J. Inorg. Chem. 2015, 5, 41-51.
CrossRef - Suzuki, K.; Tanaka, Y.; Kuroda, K.; Hanajima, D.; Fukumoto, Y. Bioresour. Technol. 2005, 96, 1544-1550.
CrossRef - Demeestere, K.; Smet, E.; Van Langenhove, H.; Galbacs, Z. Environ. Technol. 2001, 22, 1414-1428.
- Rietveld, H.M. J. Appl. Crystallogr. 1969, 2, 65-71.
CrossRef - Rodriguez-Carvajal, J. Program Fullprof 2k, version 3.30, Laboratoire Leon Brillouin, France, June 2005.
- Caglioti, G.; Paoletti, A.; Ricci, F.P. Nucl. Instrum. 1958, 35, 223-228.
CrossRef - Mahieux, P.-Y.; Aubert, J.-E.; Cyr, M.; Coutand, M.; Husson, B. Waste Manage. 2010, 30, 378-388.
CrossRef - Shalaby, M.S.; El-Rafie, Sh.; Hamzaoui, A.H.; M’nif, A. Chem. Biochem. Eng. Q. 2015, 29, 35-46.
CrossRef - El-Gawad, H.A.; Kattab, I.A.; Mahdy, A.N.; Moselhy, H.; Ibrahim, O.A. RJPBCS, 2017, 8,1366-1380.
- Wang, H.; Wang, X-J.; Wang, W-S.; Yan, X-B.; Xia, P.; Chen, J.; Zhao. J-F. J. Chem. Technol. Biotechnol. 2016, 91, 3045-3052
CrossRef - Ivanetsa, A.I.; Kitikova, N.V.; Shashkova, I. L; Oleksiienko, O.V.; Levchuk. I.; Sillanpaa, M.; JECE. 2014, 2, 981-987.
- Peng, C.; Chai, L-Y.; Tang, C-J.; Min Ali, X-B. M.; Song, Y-X.;Qi, W-M. J. Chem. Technol. Biotechnol. 2017, 92, 325-333.
CrossRef

This work is licensed under a Creative Commons Attribution-NonCommercial-ShareAlike 4.0 International License.

This work is licensed under a Creative Commons Attribution 4.0 International License.
![]()
A New Edition of Web of Science
Journal Impact Factor
2022: 0.5
Five Year: 0.8
Journal is Indexed in

Cabells Whitelist
![]()


