Method, Development and Validation for the Estimation of Magnesium Content in Esomeprazole-magnesium by Atomic Absorption Spectrophotometer
 and Sundararajan Raja
GITAM Institute of Pharmacy, GITAM University - Rushikonda, Visakhapatnam, India.
Corresponding Author E-mail: sivasaikiran143@gmail.com
DOI : http://dx.doi.org/10.13005/ojc/340155
Download this article as:
![]()
A simple, fast and efficient validated method is developed for determination of Magnesium content in Esomeprazole Magnesium by using atomic absorption spectrophotometer (AAS). The method was developed on atomic absorption spectrometer with 0.2nm slit width with high speed deuterium (D2) lamp. The read time was set at 3.0 second with 285.2 nm wavelength. The system performance was evaluated by performing the system suitability parameters. The Limit of Detection and Limit of Quantification were found to be 0.01 µg/mL and 0.03 µg/mL respectively. The percentages of recovery for low, medium and high spiked concentration levels of Magnesium in Esomeprazole Magnesium were found to be 91.85, 95.02 and 97.89 respectively. With the developed method the Magnesium content in Esomeprazole Magnesium bulk sample was found to be 3.48 % which compliance the United States Pharmacopoeia standard.
KEYWORDS:Esomeprazole Magnesium; Magnesium; AAS; Validation
Introduction
Esomeprazole Magnesium Trihydrate is an official drug in USP [1] belongs to a category of proton pump inhibitor and is used in treating various acid related disorders [2]. Esomeprazole (Fig 1), is a S‐isomer of omeprazole which is the first drug in its category developed as a single optical isomer [3]. The literature review revealed that various analytical methods in single and combined dosage form involving spectrophotometer [4-6], RP-HPLC [7-14], HPTLC [15], UPLC [16], LC-MS [17]. Form the literature review it is found that there is no reported method for the estimation of Magnesium in Esomeprazole Magnesium as Magnesium excess and lower levels in body will cause hyper magnesaemia and hypomagnesaemia. In the present study a validated method is developed by using AAS to determine Magnesium content in Esomeprazole Magnesium Trihydrate.
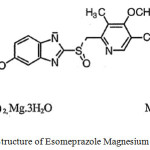 |
Figure 1: Structure of Esomeprazole Magnesium Trihydrate Click here to View figure |
Materials and Methods
Reagents
Esomeprazole Magnesium is obtained as a gift sample from varun herbals. Magnesium Standard Used in the study was purchased from Merck. Lanthanum Chloride and Hydrochloric Acid of Sd fine chem were used .and the water used is Milli Q Water
Working Standards and Solutions Preparation
Preparation of Lanthanum solution (4%)
Transfer 4 g of lanthanum chloride in to a 100 mL volumetric flask and add 50mL of Milli Q water and dilute up to volume with Milli Q water.
Magnesium Standard Stock Solution Preparation
Pure 1000 µg/mL of Magnesium standard was purchased from NIST Traceable Material which is considered as stock solution A.
Transfer 0.5 mL of above Magnesium standard stock solution (1000 µg/mL) into a 20 mL volumetric flask and add 4 mL of 1 N hydrochloric acid and make up the volume with Milli Q water which is used as stock solution B. Transfer 0.1 mL, 0.2 mL, 0.3 mL, 0.4 mL and 0.5 mL of above stock solution B (25 µg/mL) to a separate 25mL volumetric flask add 1 mL of Lanthanum Chloride to each flask and dilute up to volume with Milli Q water i.e., 0.1 µg/mL, 0.2 µg/mL, 0.3 µg/mL, 0.4 µg/mL and 0.5 µg/mL of Magnesium respectively. From this solution a linear graph is plotted.
Sample Preparation
Take 100 mg of sample (Esomeprazole Magnesium) to a clean and dry 100 ml volumetric flask and add 20 ml of 1 N hydrochloric acid and dilute up to volume with Milli Q water which is considered as a stock solution A. Allow the solution to stand for 30 min after that transfer 0.25 ml of this solution to a 25 ml volumetric flask and add 1 mL of Lanthanum Chloride to each flask and dilute up to volume with Milli Q water.
Preparation of Blank
Transfer 1 mL of lanthanum Chloride solution to a 25 mL volumetric flask dilute up to the mark with Milli Q water and mix.
Instrumental Conditions
An AA-6300 atomic absorption spectrometer equipped with fully integrated atomizers of Shimadzu make was used for the analysis. The system was operated from an interfaced computer running Wizard software. The following are the optimal operating conditions for flame atomization of Magnesium are presented in table 1
Table 1: Optimal operating conditions for flame atomization of Magnesium
|
Element |
Magnesium |
|
Wavelength |
285.2 nm |
|
Read Time |
10 Sec |
|
Lamp Current |
12 MA |
|
Recommended Flame |
Air-Acetylene |
|
Fuel gas Flow |
2.0 |
|
Support gas Flow |
17.0 |
|
Slit Width |
0.2 nm |
|
Signal type |
Atomic Absorption |
|
Atomization site |
Burner Head |
|
Equation |
Linear through Zero |
|
Flame Type |
Air-Acetylene |
|
Pre Spray time |
3 sec |
|
Integration time |
5 sec |
Results and Discussion
System Suitability
System suitability is a measure to ensure the performance of the system. The results obtained for standard deviation of absorption values (n=6) for Magnesium working standards were presented in Table 2 and was within range of acceptance criteria (%RSD ≤ 5).
Table 2: System Suitability
| S.No | Magnesium Concentration (µg/mL) | Absorbance |
|
1 |
0.4 |
0.3390 |
|
2 |
0.4 |
0.3397 |
|
3 |
0.4 |
0.3428 |
|
4 |
0.4 |
0.3458 |
|
5 |
0.4 |
0.3475 |
|
6 |
0.4 |
0.3453 |
|
Average |
0.3434 | |
|
SD |
0.0035 | |
|
% RSD |
1.01 | |
Specificity
Specificity is the ability to assess the analyte in sample with presents of unexpected other elements which interfere the results of analyte in sample. The results presented in table 3
Table 3: Specificity
| Magnesium Concentration (ppm) | Wavelength | Average Concentration (n=6) |
| Blank Solution | 285.2 | 0.0020 |
| Standard Solution | 285.2 | 0.3532 |
| Sample Solution | 285.2 | 0.3582 |
LOD
LOD is the lowest amount of analyte that can be detected which is determined by aspirating various concentrations with their respective absorbance shown in the table 4. Flow the below table the LOD was found to be 0.01 µg/mL
Table 4: Limit of Detection
| S.No | Concentration | Absorbance |
| 1 | 0.05 µg/mL | 0.0241 |
| 2 | 0.04 µg/mL | 0.0213 |
| 3 | 0.03 µg/mL | 0.0170 |
| 4 | 0.02 µg/mL | 0.0088 |
| 5 | 0.01 µg/mL | 0.0059 |
| 6 | 0.005 µg/mL | – 0.0466 |
LOQ
LOD is the lowest amount of analyte that can be quantitatively determined with suitable precision and accuracy
LOQ = LOD * 3.3
= 0.01 * 3.3
= 0.03 µg/mL
Precision at LOQ Level
Precision reported as percentage relative standard deviation (%RSD) by aspirating the 0.033 µg/ mL Magnesium standard for 6 times. The results were presented in table 5 and were within range of acceptance criteria (%RSD ≤ 5).
Table 5: Precision at LOQ Level
| S.No | Concentration | Absorbance |
| 1 | 0.033 µg/ mL standard | 0.0166 |
| 2 | 0.033 µg/ mL standard | 0.0164 |
| 3 | 0.033 µg/ mL standard | 0.0165 |
| 4 | 0.033 µg/ mL standard | 0.0173 |
| 5 | 0.033 µg/ mL standard | 0.0177 |
| 6 | 0.033 µg/ mL standard | 0.0169 |
|
Average |
0.0169 | |
|
SD |
0.005 | |
|
%RSD |
3.02 | |
Linearity and Range
The concentration of standard solution is directly related and proportional to absorption in their lower and upper limits. The calibration curve is shown in fig. 2 and regression equation presented in table 6.
The range was plotted between Magnesium standard solution 0.03 µg/ mL to 0.5 µg/ mL (The range plotted from LOQ level to 150% with respect to sample solution). The results were presented in table 6 and were within range of acceptance criteria (Correlation Coefficient ≤ 0.99).
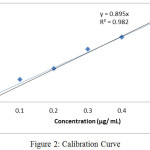 |
Figure 2: Calibration Curve Click here to View figure |
Table 6: Calibration Curve
| Concentration (µg/ mL) | Absorbance |
| 0.0300 | 0.0165 |
| 0.1 | 0.1253 |
| 0.2 | 0.1818 |
| 0.3 | 0.2892 |
| 0.4 | 0.3537 |
| 0.5 | 0.4309 |
| Correlation Coefficient | 0.9929 |
Accuracy/ Recovery
Accuracy is the closeness of the test results obtained by the method to the true value which was obtained by spiking 50%, 100% and 150% of Esomeprazole Magnesium working standard concentrations, in triplicates and accuracy/ recovery was shown in Table 7. The results were presented in table 7 and was within range of acceptance criteria (Accuracy/ %Recovery in between 80 % – 120% ) and the %RSD for 3 spiked sample preparation should be NMT 5%).
Table 7: Accuracy
| S.No | Sample | % Recovery | %RSD |
| 1 | 50 % Spiked | 91.85 | 1.84 |
| 2 | 100 % Spiked | 95.02 | 1.62 |
| 3 | 150 % Spiked | 97.89 | 0.38 |
Sample Analysis
The sample was prepared and aspirated as per the above method and the Magnesium content (on anhydrous basis) found in the given sample is 3.48 % which is within acceptance criteria (USP NF 40).
Conclusion
In the present study a validated simple, accurate, and precise method is developed to determine the content of Magnesium in Esomeprazole Magnesium bulk drug. The allowed Magnesium content is present between 3.30 % to 3.55 % on anhydrous basis (USP NF 40). The sample which is analyzed by using the method developed is 3.48 % so the Magnesium content in the given sample is inacceptable range.
References
- United States Pharmacopeia NF 40.
- Andersson, T.; Hassan-Alin, M.; Hasselgren, G.; Rohss, K.; Weidolf, L. Clin Pharmacol .2001, 40, 411-426
CrossRef - Lind, T.; Rydberg, L.; Kyleback, A.; Jonsson, A.; Andersson, T.; Hasselgren, G.; Holmberg, J.; Rohss, K. Aliment Pharmacol. Ther. 2000,14,861‐867
CrossRef - Patil, S. S.; Dhabale, P. N.; Kuchekar, B. Asian Journal of Research in Chemistry,2009,2 , 154–156
- Gawande, V. V.; Chandewar A. V.; International Journal of Pharmacy & Technology, 2010, 2, 617–622
- Prabu, S.L.; Shirwaikar, A.; Shirwaikar, A.; Kumar, C.D.; Joseph, A.; Kumar, R. Indian J Pharm Sci, 2008, 70, 128-31.
CrossRef - Dilip, G.; Maheshwari.; Trivedi, P. D. Int. J Appl Sci Eng, 2011, 9, 187-94.
- Deepak Kumar, J.; Nitesh, J.; Rita, C.; Nilesh, J. Pharm Methods, 2011, 2, 167–72.
CrossRef - Imran, A.; Jat R.K.; Rambir, S.; Srivastava, V.; Srivatsava S. Int Res J Pharm, 2012, 3,111-113.
- Zarna, D.; Ronak, D.; Vaishali, K.; Vidya Sagar, G.; Meeta, B.; Sheth, N. R. Asian J Research Chem, 2009, 2,108-111.
- Meyyanathan, S.N.; Nagasamy Venkatesh, D.; Krishnaveni, N.; Babu, B.; Jeyaprakash, MR.; Rajanikanth, B. R. Int J Health Allied Sci, 2012, 1, 129-32
CrossRef - Onal, A.; Oztunç A. Journal of Food and Drug Analysis,2006, 14, 12–18
- Sripal Reddy, P.; Sait, S.; Vasudev murthy, G.; Vishwanath, B.; Prasad, V.; Jayapal Reddy, S. Der Pharma Chemica, 2011, 3, 553–564
- Shetty, R.; Subramanian, G.; Kumar, R.A.; Pandey, S.; Udupa, N. Indian Drugs, 2005, 42, 158-161.
- Sharma, S.; Sharma, M. C. American—Eurasian Journal of Toxicological Science, 2011, 3,143–148.
- Nalwade, S. U.; Reddy, V. R.; Rao, D.D.; Morisetti, N.K. J. Pharm. and Biomed, 2012, 57, 109-114.
CrossRef - Hultman, I.; Stenhoff, H.; Liljeblad, M. J Chromatography B, 2007, 848, 317-22.
CrossRef

This work is licensed under a Creative Commons Attribution-NonCommercial-ShareAlike 4.0 International License.


![]()


