Measurement and Thermodynamic Modelling of Erythritol Solubility in Aqueous Solvents
Sirichot Krajangsod1, Sumitta Chotikamas2, Atthasit Tawai1 and Malinee Sriariyanun1
1The Sirindhorn International Thai-German Graduate School of Engineering (TGGS), KMUTNB, Bangkok, 10800 Thailand.
2Department of Chemical Engineering, Faculty of Engineering, KMUTNB, Bangkok, 10800 Thailand.
Corresponding Author E-mail: macintous@gmail.com
DOI : http://dx.doi.org/10.13005/ojc/340129
Purification process of erythritol in industrial production are currently composed of multiple steps. To improve the purification efficiency and to operate the working condition precisely, the solubility property of erythritol should be monitored. In this study, the erythritol solubilities in aqueous solvents including methanol, ethanol and 2-propanol were experimentally measured by using the gravimetric method within the temperature range of 273.15 K to 283.15.15 K (with 2 K interval) and 283.15 K to 323.15 K (with 10 K interval). The experimental results showed that erythritol solubility increased due to the increase of temperature but decrease of mass fraction of organic solvent. The solubility was also depended on polarities of solvents. The lowest solubility was obtained when using aqueous ethanol. To generate solubility model of erythritol, Apelblate equation, Buchowski-Ksiazaczak λh equation and Van’t Hoff model were applied to explain correlation and behavior of erythritol solubility. Based on statistical analysis, Apelblate equation obtained the best correlation to the experimental data compared to Buchowski-Ksiazaczak λh equation and Van’t Hoff model. The solubility model with the estimated parameters could be further applied for optimizing purification processes of erythritol in industries.
KEYWORDS:Erythritol; Solubility; Purification; Gravimetric Method
Download this article as:| Copy the following to cite this article: Krajangsod S, Chotikamas S, Tawai A, Sriariyanun M. Measurement and Thermodynamic Modelling of Erythritol Solubility in Aqueous Solvents. Orient J Chem 2018;34(1). |
| Copy the following to cite this URL: Krajangsod S, Chotikamas S, Tawai A, Sriariyanun M. Measurement and Thermodynamic Modelling of Erythritol Solubility in Aqueous Solvents. Orient J Chem 2018;34(1). Available from: http://www.orientjchem.org/?p=42850 |
Introduction
Erythritol, with its chemical name 1, 2, 3, 4-butanetetrol or meso-erythritol [C4H10O4], is classified as a sugar alcohol with white crystal appearance. The molecular structure of erythritol is shown in Fig. 1. It is noncarolic biological sweetener (0.2 kcal/g) that has similar taste to sucrose with approximately 70% of sucrose’s sweetness. Thus, it is considered to be one of the safe food condiment for consumers with diabetes [1]. Erythritol is naturally found in various fruits, vegetables, such as mushroom, melon, and some fermented foods, such as soy sauce, beer and sake [2]. Erythritol has broad applications in food and pharmaceutical industries, including to modify taste and texture of foods and beverages, as well as to use as a flavor enhancer, a formulation aid, a stabilizer and a thickener. It is resistant to be metabolized by oral bacteria, and thus, is tooth-friendly.
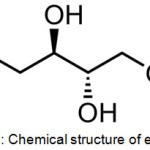 |
Figure 1: Chemical structure of erythritol. Click here to View figure |
There are several market players in erythritol production including Bolak Corporation (Korea), Cargill Food & Pharm Specialties (USA) and Mitsubishi Chemical Corporation (Japan) [2]. Currently, erythritol is produced by chemical and fermentation process. Via chemical reactions, erythritol is synthesized from dialdehyded starch using nickel catalyst at high temperature [3]. However, this chemical process has never been applied in industrial production due to its low efficiency and high cost. On the other hand, fermentation process is preferably selected for large-scale industrial production. Glucose derived from hydrolysis reactions of corn and wheat starch is mainly used as a major carbon source for fermentation of yeast-like fungi, such as Torula sp. and Moniliella pollinis. One of the concern for the fermentation production is how to improve the efficiency of separation and purification because fermentation broth has large amounts and various types of undesired by-products.
To recovery and purify erythritol from fermentation broth, the separation trains are conventionally composed of filtration, ion exchange chromatography, concentration, and crystallization. After membrane filtration of fermentation broth, ion exchange chromatography using cation and anion exchange resins is immediately performed to remove charged impurities. The solution is then concentrated and allowed to form crystal, which has purity more than 99.5% [4]. Therefore, the crystallization is a key determination to obtain the qualified erythritol products. Consequently, the solubility data of erythritol is a prerequisite information in order to properly operate the crystallization process to get the desired yield and purity of erythritol [5]. In this study, the solubilities of erythritol in different aqueous solvents, including methanol, ethanol and 2-propanol were monitored within the temperature range of 273.15 to 323.15 K. The experimental data were correlated to different models, including the modified Apelblate model, the Buchowski-Ksiazaczak λh equation and Van’t Hoff equation. The behavior of erythritol solubility was interpreted to select a suitable aqueous solvent to improve the separation process of erythritol.
Materials and Methods
A white crystalline powder of erythritol (purity > 99.75%) was purchased from NOW Foods (Bloomingdale, IL, USA). It has molecular weight (MW) of 122.12. The solubility of erythritol at 20°C is 54 wt% in water and is slightly soluble in alcohol. It melting temperature was 394.65 K. The methanol, ethanol and 2-propanol (analytical grade with purity > 99.5%) were purchased from RCI Labscan (Bangkok, Thailand). The relative polarity of each solvent is shown in the following order: methanol (0.762) > ethanol (0.654) > 2-propanol (0.546), respectively. The analytical stirred-flask method was conducted to determine the solubilities of erythritol in different aqueous organic solvents. The advantages of the stirred-flask method are its experimental simplicity and dependable due to the possibility of measuring many samples simultaneously, however it is a long-time-consuming experiment.
To set up the solubility experiment, the different concentrations of erythritol, as a solute, ranging from 10 wt% – 40 wt% were separately prepared in aqueous solvents of methanol, ethanol and 2-propanol that mixed with distilled water. Each mixture was prepared in a screw-capped bottle using magnetic stirrer to provide continuous agitation. To generate the system of the solid–liquid equilibrium, the solid–liquid mixing was continuously stirred for 24 h at the set temperature, and then the solution was kept for 30 min to allow the undissolved solids to settle down in the lower portion of the bottle. Then, each prepared mixture was statically placed for 24 h in controlled cooling water bath with a temperature stability of ±0.05 K (LAUDA Alpha RA24, Germany).
The solubility of erythritol was measured as mole fraction by using gravimetric method. To monitor the progress of solubility in tested solvents wintin 24 h period, 10 ml of the mixture was sampling every 3 h, and immediately dried in hot air oven at 80°C. The dried mass of the erythritol was weighed using an analytical balance with an accuracy of ±0.01 g (Scout™ Pro, Ohaus, USA ). The value of erythritol solubility was calculated and reported in the term of mole fraction solubilities of erythritol (xe) base on the equation 1.
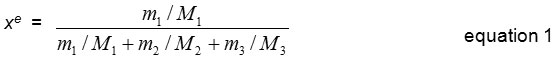
Where m1, m2 and m3 represent the mass of the solute, solvent (ethanol, methanol and 2-propanol) and water, respectively. And M1, M2 and M3 are the molecular weight of the solute, solvent and water, respectively.
Results and Discussion
Erythritol Solubility Data
In this study, the mixtures of erythritol in different types of aqueous solvents (methanol, ethanol and 2-propanol) were prepared in different mass fraction of solvent ranging from 30 wt% – 45 wt%. The mole fractions of solubilized erythritol were quantitated and calculated under varied temperatures (273.15 K to 323.15 K). The measured xe in each aqueous solvent, methanol, ethanol and 2-propanol, were listed in Table 1-3. The correlations between temperature and xe were graphically illustrated in Fig 2-4. Obviously, it could be described that erythritol solubility was depended on the function of temperature and mass fraction of solvent. That is, the mole fraction solubilities of erythritol were increased upon the increasing of temperature, suggesting the endothermic solubility property of erythritol. On the other hand, the mole fraction solubilities were decreased when the mass fraction of solvent increased. Therefore, these correlation of erythritol solubility, system temperature and solvent mass fraction allowed us to create the solubility model to study in more details of erythritol solubility behavior.
Table 1: Mole fraction of erythritol solubilities (xe) in aqueous methanol (w is the methanol’s mass fraction).
| T/K | xe | RD (x 10)* | ||
| w = 45% | Apelblat equation | Buchowski-Ksiazaczak λh equation | Van’t Hoff equation | |
| 273.15 | 1.28 x 10⁻³ | -0.521 | -2.187 | -1.839 |
| 275.15 | 1.32 x 10⁻³ | -0.817 | -1.916 | -1.674 |
| 277.15 | 1.47 x 10⁻³ | -0.252 | -0.792 | -0.657 |
| 279.15 | 1.67 x 10⁻³ | 0.517 | 0.414 | 0.465 |
| 281.15 | 1.83 x 10⁻³ | 0.945 | 1.17 | 1.158 |
| 283.15 | 1.69 x 10⁻³ | -0.215 | 0.346 | 0.274 |
| 293.15 | 2.11 x 10⁻³ | 0.524 | 1.835 | 1.598 |
| 303.15 | 1.93 x 10⁻³ | -0.977 | 0.463 | 0.141 |
| 313.15 | 2.09 x 10⁻³ | 0.061 | 0.454 | 0.273 |
| 323.15 | 1.95 x 10⁻³ | 0.245 | -1.291 | -1.091 |
| w = 40% | ||||
| 273.15 | 1.27 x 10⁻³ | 1.634 | 1.322 | -1.008 |
| 275.15 | 1.27 x 10⁻³ | 0.463 | -1.996 | -1.758 |
| 277.15 | 1.51 x 10⁻³ | 0.918 | -0.685 | -0.553 |
| 279.15 | 1.56 x 10⁻³ | 0.113 | -0.95 | -0.89 |
| 281.15 | 1.51 x 10⁻³ | -1.414 | -1.972 | -1.983 |
| 283.15 | 1.56 x 10⁻³ | -2.269 | -2.261 | -2.344 |
| 293.15 | 2.78 x 10⁻³ | -0.641 | 0.915 | 0.664 |
| 303.15 | 4.65 x 10⁻³ | 1.404 | 2.855 | 2.624 |
| 313.15 | 4.49 x 10⁻³ | -0.686 | 0.263 | 0.085 |
| 323.15 | 5.21 x 10⁻³ | 0.037 | -1.1 | -0.914 |
| w = 35% | ||||
| 273.15 | 1.29 x 10⁻³ | 0.571 | -0.661 | -0.313 |
| 275.15 | 1.29 x 10⁻³ | -0.526 | -1.614 | -1.305 |
| 277.15 | 1.70 x 10⁻³ | 1.108 | 0.409 | 0.607 |
| 279.15 | 1.78 x 10⁻³ | 0.572 | 0.041 | 0.192 |
| 281.15 | 1.70 x 10⁻³ | -0.927 | -1.326 | -1.213 |
| 283.15 | 1.86 x 10⁻³ | -1.026 | -1.234 | -1.177 |
| 293.15 | 3.07 x 10⁻³ | -0.553 | -0.127 | -0.265 |
| 303.15 | 5.31 x 10⁻³ | 0.903 | 1.427 | 1.246 |
| 313.15 | 6.51 x 10⁻³ | -0.506 | -0.125 | -0.271 |
| 323.15 | 9.33 x 10⁻³ | 0.083 | -0.178 | -0.081 |
| w = 30% | ||||
| 273.15 | 1.54 x 10⁻³ | 1.717 | -1.047 | -0.743 |
| 275.15 | 1.57 x 10⁻³ | 0.633 | -1.796 | -1.54 |
| 277.15 | 1.88 x 10⁻³ | 1.032 | -0.712 | -0.541 |
| 279.15 | 1.95 x 10⁻³ | 0.143 | -1.221 | -1.101 |
| 281.15 | 2.01 x 10⁻³ | -0.843 | -1.817 | -1.749 |
| 283.15 | 2.20 x 10⁻³ | -1.176 | -1.709 | -1.696 |
| 293.15 | 3.89 x 10⁻³ | -0.724 | 0.178 | 0.017 |
| 303.15 | 6.60 x 10⁻³ | 0.412 | 1.549 | 1.358 |
| 313.15 | 8.70 x 10⁻³ | 0.007 | 0.742 | 0.605 |
| 323.15 | 1.090 x 10⁻² | -0.038 | -0.616 | -0.509 |
*RD represented relative deviations between model and experimental values.
Table 2: Mole fraction of erythritol solubilities (xe) in aqueous ethanol (w is the ethanol’s mass fraction).
| T/K | xe | RD (x 10)* | ||
| w = 45% | Apelblat equation | Buchowski-Ksiazaczak λh equation | Van’t Hoff equation | |
| 273.15 | 1.29 x 10⁻³ | -0.873 | -2.883 | -2.498 |
| 275.15 | 1.52 x 10⁻³ | 0.162 | -1.001 | -0.76 |
| 277.15 | 1.47 x 10⁻³ | -0.785 | -1.449 | -1.284 |
| 279.15 | 1.49 x 10⁻³ | 1.224 | -1.372 | -1.289 |
| 281.15 | 2.03 x 10⁻³ | 1.352 | 1.593 | 1.599 |
| 283.15 | 2.03 x 10⁻³ | 0.968 | 1.53 | 1.485 |
| 293.15 | 2.09 x 10⁻³ | -0.175 | 1.411 | 1.175 |
| 303.15 | 2.15 x 10⁻³ | -0.337 | 1.187 | 0.885 |
| 313.15 | 2.13 x 10⁻³ | 0.045 | 0.478 | 0.263 |
| 323.15 | 1.88 x 10⁻³ | 0.069 | -1.753 | -1.634 |
| w = 40% | ||||
| 273.15 | 1.09 x 10⁻³ | -0.006 | -3.759 | -3.4 |
| 275.15 | 1.32 x 10⁻³ | 0.551 | -1.994 | -1.778 |
| 277.15 | 1.32 x 10⁻³ | -0.73 | -2.657 | -2.525 |
| 279.15 | 1.61 x 10⁻³ | 0.081 | -0.948 | -0.911 |
| 281.15 | 1.85 x 10⁻³ | 0.337 | -0.049 | -0.08 |
| 283.15 | 1.69 x 10⁻³ | 1.758 | -1.599 | -1.704 |
| 293.15 | 3.10 x 10⁻³ | 0.129 | 1.78 | 1.536 |
| 303.15 | 4.51 x 10⁻³ | 0.989 | 2.672 | 2.425 |
| 313.15 | 4.41 x 10⁻³ | -0.747 | 0.263 | 0.083 |
| 323.15 | 5.00 x 10⁻³ | 0.138 | -1.231 | -1.027 |
| w = 35% | ||||
| 273.15 | 1.12 x 10⁻³ | -2.158 | -5.179 | -4.746 |
| 275.15 | 1.66 x 10⁻³ | 0.819 | -0.832 | -0.609 |
| 277.15 | 1.69 x 10⁻³ | -0.038 | -1.249 | -1.102 |
| 279.15 | 1.90 x 10⁻³ | 0.112 | -0.575 | -0.511 |
| 281.15 | 2.06 x 10⁻³ | -0.048 | -0.305 | -0.31 |
| 283.15 | 2.18 x 10⁻³ | -0.41 | -0.285 | -0.352 |
| 293.15 | 3.25 x 10⁻³ | -0.317 | 0.959 | 0.711 |
| 303.15 | 5.15 x 10⁻³ | 1.343 | 2.546 | 2.308 |
| 313.15 | 4.76 x 10⁻³ | -1.347 | -0.544 | -0.731 |
| 323.15 | 6.22 x 10⁻³ | 0.307 | -0.615 | -0.425 |
| w = 30% | ||||
| 273.15 | 1.27 x 10⁻³ | -2.283 | -4.668 | -4.246 |
| 275.15 | 1.80 x 10⁻³ | 0.282 | -1.141 | -0.895 |
| 277.15 | 1.87 x 10⁻³ | -0.445 | -1.536 | -1.355 |
| 279.15 | 2.12 x 10⁻³ | -0.246 | -0.938 | -0.832 |
| 281.15 | 2.40 x 10⁻³ | -0.026 | -0.38 | -0.337 |
| 283.15 | 2.43 x 10⁻³ | -0.927 | -1.005 | -1.017 |
| 293.15 | 4.49 x 10⁻³ | 0.836 | 1.578 | 1.41 |
| 303.15 | 6.88 x 10⁻³ | 1.469 | 2.314 | 2.116 |
| 313.15 | 6.37 x 10⁻³ | -2.214 | -1.535 | -1.716 |
| 323.15 | 1.016 x 10⁻³ | 0.483 | -0.042 | 0.089 |
*RD represented relative deviations between model and experimental values.
Table 3: Mole fraction of erythritol solubilities (xe) in aqueous 2-propanol (w is the propanol’s mass fraction).
| T/K | xe | RD (x 10)* | ||
| w = 45% | Apelblat equation | Buchowski-Ksiazaczak λh equation | Van’t Hoff equation | |
| 273.15 | 1.81 x 10⁻³ | 0.091 | -1.226 | -0.922 |
| 275.15 | 1.84 x 10⁻³ | -0.201 | -1.085 | -0.86 |
| 277.15 | 1.96 x 10⁻³ | 0.013 | -0.448 | -0.304 |
| 279.15 | 2.26 x 10⁻³ | 1.001 | 0.899 | 0.969 |
| 281.15 | 2.06 x 10⁻³ | -0.221 | -0.029 | -0.01 |
| 283.15 | 2.02 x 10⁻³ | -0.754 | -0.277 | -0.312 |
| 293.15 | 2.36 x 10⁻³ | -0.253 | 0.944 | 0.731 |
| 303.15 | 2.44 x 10⁻³ | -0.266 | 0.895 | 0.617 |
| 313.15 | 2.69 x 10⁻³ | 0.958 | 1.306 | 1.118 |
| 323.15 | 2.09 x 10⁻³ | -0.68 | -1.977 | -1.897 |
| w = 40% | ||||
| 273.15 | 1.77 x 10⁻³ | 1.995 | 0.01 | 0.321 |
| 275.15 | 1.66 x 10⁻³ | 0.525 | -1.153 | -0.904 |
| 277.15 | 1.97 x 10⁻³ | 1.184 | 0.159 | 0.298 |
| 279.15 | 1.46 x 10⁻³ | -3.061 | -3.9 | -3.811 |
| 281.15 | 1.92 x 10⁻³ | -0.858 | -1.064 | -1.071 |
| 283.15 | 2.03 x 10⁻³ | -1.168 | -0.953 | -1.031 |
| 293.15 | 3.32 x 10⁻³ | 0.313 | 1.592 | 1.342 |
| 303.15 | 4.40 x 10⁻³ | 0.673 | 2.025 | 1.752 |
| 313.15 | 4.54 x 10⁻³ | -0.51 | 0.237 | 0.056 |
| 323.15 | 5.16 x 10⁻³ | 0.094 | -0.951 | -0.736 |
| w = 35% | ||||
| 273.15 | 1.77 x 10⁻³ | 1.224 | 0.091 | 0.416 |
| 275.15 | 1.57 x 10⁻³ | -0.912 | -1.988 | -1.681 |
| 277.15 | 1.91 x 10⁻³ | 0.134 | -0.569 | -0.369 |
| 279.15 | 2.13 x 10⁻³ | 0.297 | -0.158 | -0.031 |
| 281.15 | 2.13 x 10⁻³ | -0.611 | -0.881 | -0.809 |
| 283.15 | 2.22 x 10⁻³ | -1.106 | -1.176 | -1.164 |
| 293.15 | 3.69 x 10⁻³ | 0.065 | 0.617 | 0.435 |
| 303.15 | 5.73 x 10⁻³ | 1.023 | 1.649 | 1.431 |
| 313.15 | 6.28 x 10⁻³ | -0.917 | -0.479 | -0.648 |
| 323.15 | 8.90 x 10⁻³ | 0.189 | -0.173 | -0.04 |
| w = 30% | ||||
| 273.15 | 1.91 x 10⁻³ | 1.075 | -0.008 | 0.327 |
| 275.15 | 1.79 x 10⁻³ | -0.552 | -1.557 | -1.245 |
| 277.15 | 2.29 x 10⁻³ | 0.885 | 0.232 | 0.435 |
| 279.15 | 2.55 x 10⁻³ | 0.977 | 0.524 | 0.664 |
| 281.15 | 2.33 x 10⁻³ | -0.855 | -1.194 | -1.09 |
| 283.15 | 2.48 x 10⁻³ | -1.184 | -1.344 | -1.298 |
| 293.15 | 4.19 x 10⁻³ | -0.133 | 0.292 | 0.141 |
| 303.15 | 6.00 x 10⁻³ | -0.236 | 0.329 | 0.108 |
| 313.15 | 8.83 x 10⁻³ | 0.361 | 0.704 | 0.563 |
| 323.15 | 1.115 x 10⁻³ | -0.107 | -0.384 | -0.274 |
*RD represented relative deviations between model and experimental values.
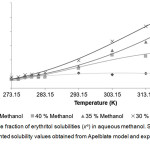 |
Figure 2: Mole fraction of erythritol solubilities (xe) in aqueous methanol. Click here to View figure |
Solid lines and dots represented solubility values obtained from Apelblate model and experiments, respectively.
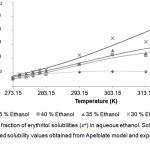 |
Figure 3: Mole fraction of erythritol solubilities (xe) in aqueous ethanol. Click here to View figure |
Solid lines and dots represented solubility values obtained from Apelblate model and experiments, respectively.
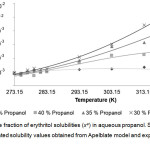 |
Figure 4: Mole fraction of erythritol solubilities (xe) in aqueous propanol. Click here to View figure |
Solid lines and dots represented solubility values obtained from Apelblate model and experiments, respectively.
Modelling of Erythritol Solubility
In this study, three different solubility models, including the modified Apelblat equation, the Buchowski-Ksiazaczak λh equation and the Van’t Hoff equation, were applied to evaluate the correlations of experimental data and operational parameters, including mole fraction solubility of erythritol, mass fraction of aqueous solvent and temperature. The modified Apelblat equation is frequently used to monitor the correlation of solubility and temperature in solid-liquid equilibrium. Most systems that are composed of solute and solvent could be preferably fit well with the modified Apelblat equation [6, 7, 8]. The Buchowski-Ksiazaczak λh equation is an alternative method to describes the solid-liquid equilibrium behavior by only two adjustable parameters, λ and h, that firstly developed in an eutectic system of solute in saturated solution [9]. The Van’t Hoff equation describes the change in the equilibrium constant of reaction depending upon the change of temperature with the assumption that the constant enthalpy is valid over a certain temperature range [10]. Based on these principles, these three models were selected to evaluate the correlation of erythritol solubility in the solvent systems here.
Apelblat Model
This solubility model was firstly proposed by Apelblat and Manzurola based on the behavior of solute and solvent in solid-liquid phase equilibrium [6]. The mole fraction of erythritol, as a solute, in the solvent depends on the system temperature and could be correlated as the following equation [11].
![]()
where T is the absolute temperature (K). A, B and C are model parameters, x is the mole fraction of the erythritol at the temperature T. The coefficient variations of the solutions are represented by constant A and B that indicating the influence of non-ideal solution on the solubility of solute. While, constant C reflects the effect of temperature on the fusion enthalpy [12]. The values of the three parameters of A–C are listed in Table 4.
λh Model
Using the Buchowski-Ksiazaczak λh equation, there are only two adjustable parameters, λ and h, are required to fit the experimental data [12, 13, 14]. This model expresses the relationship between mole fraction of the solute as a function of temperature as follows,

where T is the absolute temperature (K), λ and h are the model parameters, x is the mole fraction of erythritol, as a solute, in solvent and Tm is the melting temperature of erythritol. The values of the two parameters, λ and h, are listed in Table 5, respectively.
Van’t Hoff Model
The Van’t Hoff equation was proposed previously as an alternative model to describe the solubility of erythritol in the selected solvents [15]. The equation expresses the dependency of the solubility to the function of temperature as the following equation.
![]()
where x is the mole fraction of the solubility. a and b are the model parameters, which are presented in Table 6.
Because three selected models contain different model parameters that need to be adjusted and calculated, the computing software, MATLAB (The Mathwork, Inc, USA), was employed to determine each model parameter based on the experimental data. In this study, an estimation of model parameters (A, B and C of the modified Apelblat equation, λ and h of the λh equation, a and b of the Van’t Hoff equation) was conducted by using nonlinear regression method approach. To evaluate the correlation quality of the solubility models, the root-mean-square deviations (RMSD) and the average absolute deviation (RAD) were calculated [16] as in equation 5 and 6, and listed in Table 4-6.
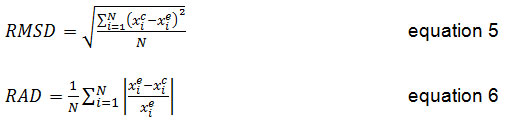
The relative deviations (RDs) was calculated based on the following equation.
![]()
Where N is the number of experiment data point, xe and xc present the experimental and calculated solubility values, respectively.
Table 4: Parameters of the Apelbalte equation derived from solubility behavior of erythritol in different mass fractions of aqueous methanol, ethanol and 2-propanol.
| %wt | A | B | C | RAD | RMSD (x104) |
| Methanol | |||||
| 45% | 466.228 | -21464.334 | -70.277 | 0.051 | 1.032 |
| 40% | 632.41 | -30674.663 | -93.932 | 0.096 | 2.812 |
| 35% | 171.167 | -10883.508 | -24.605 | 0.068 | 2.217 |
| 30% | 467.172 | -24176.652 | -68.685 | 0.067 | 1.922 |
| Ethanol | |||||
| 45% | 557.338 | -25412.354 | -83.934 | 0.06 | 1.345 |
| 40% | 713.35 | -34146.305 | -106.089 | 0.055 | 2.052 |
| 35% | 478.093 | -23679.35 | -70.945 | 0.069 | 3.198 |
| 30% | 326.017 | -17431.728 | -47.89 | 0.092 | 5.952 |
| Propanol | |||||
| 45% | 388.463 | -17818.621 | -58.744 | 0.044 | 1.314 |
| 40% | 493.899 | -24075.418 | -73.497 | 0.104 | 2.501 |
| 35% | 193.419 | -11411.471 | -28.183 | 0.065 | 2.923 |
| 30% | 160.559 | -10191.042 | -23.106 | 0.064 | 2.062 |
Table 5: Parameters of the Buchwski-Ksiazaczak λh equation derived from solubility behavior of erythritol in in different mass fractions of aqueous methanol, ethanol and 2-propanol.
| %wt | λ | h | RAD | RMSD (x 104) |
| Methanol | ||||
| 45% | -0.001 | 1306633.318 | 0.109 | 2.099 |
| 40% | 0.01 | 187293.052 | 0.143 | 5.009 |
| 35% | 0.04 | 76871.677 | 0.071 | 2.774 |
| 30% | 0.048 | 63546.255 | 0.114 | 4.872 |
| Ethanol | ||||
| 45% | -0.002 | 1425014.37 | 0.147 | 2.685 |
| 40% | 0.008 | 203508.052 | 0.17 | 5.106 |
| 35% | 0.011 | 168169.982 | 0.131 | 4.951 |
| 30% | 0.031 | 84205.63 | 0.151 | 6.768 |
| Propanol | ||||
| 45% | -0.002 | 1439843.165 | 0.091 | 2.309 |
| 40% | 0.006 | 228318.009 | 0.12 | 4.204 |
| 35% | 0.025 | 99178.707 | 0.078 | 3.568 |
| 30% | 0.041 | 68932.348 | 0.066 | 3.019 |
Table 6: Parameters of the Van’t Hoff equation derived from solubility behavior of erythritol in in different mass fractions of aqueous methanol, ethanol and 2-propanol.
| %wt | λ | h | RAD | RMSD (x 104) |
| Methanol | ||||
| 45% | -0.001 | 1306633.318 | 0.109 | 2.099 |
| 40% | 0.01 | 187293.052 | 0.143 | 5.009 |
| 35% | 0.04 | 76871.677 | 0.071 | 2.774 |
| 30% | 0.048 | 63546.255 | 0.114 | 4.872 |
| Ethanol | ||||
| 45% | -0.002 | 1425014.37 | 0.147 | 2.685 |
| 40% | 0.008 | 203508.052 | 0.17 | 5.106 |
| 35% | 0.011 | 168169.982 | 0.131 | 4.951 |
| 30% | 0.031 | 84205.63 | 0.151 | 6.768 |
| Propanol | ||||
| 45% | -0.002 | 1439843.165 | 0.091 | 2.309 |
| 40% | 0.006 | 228318.009 | 0.12 | 4.204 |
| 35% | 0.025 | 99178.707 | 0.078 | 3.568 |
| 30% | 0.041 | 68932.348 | 0.066 | 3.019 |
From the Table 1-3, it could be described that solubility of erythritol in all solvents increased as a function of system temperature. The higher of temperature provided the better solubility of erythritol as shown in Fig 2-4. In this study, the temperature ranges within 283.15 – 323.15 K were tested. The results showed that within lower range of temperature at 273.15 – 283.15 K, the solubility of erythritol slightly increased due to increment of temperature. While, within higher range of temperature at 283.15 – 323.15 K, the solubility of erythritol apparently increased. This behavior could be hypothetically explained that the lattice structure of erythritol required the certain amount of heat to be initially broken down and then solubilized in solvent. After that, the outer surface of lattice was disturbed, it was easier for inner shell of lattice was disintegrated and dissolved.
The mass fraction of solvent was demonstrated to be an important factor to control erythritol solubility. In Table 1-3 and Fig 2-4, the erythritol solubility in aqueous methanol, ethanol and propanol solvents decreased with increasing mass fractions of solvents at constant temperature. It could be explained that the more fractions of solvents were in the system, the more competition to grab water molecules to proximity of solvents, and therefore less water molecules available for erythritol to solubilize. In addition, the types of solvents also affected the degree of erythritol solubility. Previously, erythritol solubility was monitored in pure methanol, ethanol and acetone, and the solubility models indicated that the erythritol solubility was the lowest in acetone [1].
In this study, the combining effects between the types and mass fractions of solvents on erythritol solubility were observed. At 35% mass fraction of solvent, the lowest erythritol solubility was obtained when using ethanol, which was only 66.67 and 69.88% of mole fraction solubilities in methanol and propanol, respectively, at 323.15 K. While, at 30% and 40%, although the lowest solubility was found in ethanol, but the mole fraction were not so different from methanol and propanol, at 323.15 K. Interestingly, at lower range of temperature, between 273.15 – 283.15 K, the mole fraction solubilities in three types of solvents were similar. Normally, to predict the possibility of solubilization and to assist in selection purification process, there is the “the like dissolve like” principle that could be used widely. In this study, the solvent’s polarity is in the following order: methanol> ethanol> propanol, and in our system, the erythritol solubility was the lowest in ethanol, the medium polarity solvent. This finding suggested that the solubility of erythritol were influenced by combination of factors, including temperature, mass fraction of solvent and type of solvent.
In Table 4-6, three solubility models, including Apelblate model, Buchwski-Ksiazaczak λh equation and Van’t Hoff model, were applied to fit with experimental data. The degree of correlation of model and experimental data was evaluated based on RMSD values. Comparing among three models, it was observed that the Apelblate model provided the smallest RMSD suggesting that the Apelblate model gave the better correlation and accuracy than the Buchwski-Ksiazaczak λh equation and the Van’t Hoff model.
Conclusions
In this study, the erythritol solubility of in aqueous solvents, including methanol, ethanol and 2-propanol, were experimentally monitored within the temperature range of 273.15 K – 323.15K. The solubility behaviors were comparatively correlated with Apelblat model, Buchwski-Ksiazaczak λh equation and Van’t Hoff model, and the results suggested that Apelblat model provided the best correlation to the experimental data. Altogether, the conclusion could be drawn as follows; 1) the solubilities of erythritol in the selected solvent increased when temperature increased, but the slopes of increments varied upon the types of solvents; 2) the erythritol solubilities in aqueous methanol and propanol were more than that in ethanol; 3 ) the modified Apelbalt equation was more reliable than the other two tested equations; 4 ) the experimental data and model parameter could be used for predicting solubilities of the solute and determining optimum operational condition in purification process of erythritol.
Acknowledgements
The authors would like to thank Thailand Research Fund (TRF: Grant No. PHD59I0065), Mitrphol Biofuel Co., LTD. and King Mongkut’s University of Technology, North Bangkok for jointed financial support of this work.
References
- Hao HX, Hou BH, Wang JK, Zhang MJ. Solubility of erythritol in different solvent. J.Chem. Eng.Data. 2005; 50: 1454–1456.
CrossRef - Moon HJ, Jeya M, Kim IW, Lee JK. Biotechnological production of erythritol and its applications. Appl. Microbio. Biotechnol. 2010; 86: 1017–1025.
CrossRef - Pfeifer V, Sohns V, Conway H, Lancaster E, Dabic S, Griffin E. Two stage process for dialdehyde starch using electrolytic regeneration of periodic acid. Ind. Eng. Chem. Res. 1960; 52: 201–20.
CrossRef - Cerestar Holding BV. Application for assessment of erythritol prior to its authorization. Mitubishi Chemical Corporation and Nikken Chemicals Co. Ltd, 1999.
- Long BW, Li J, Zhang RR, Wan L. Solubility of benzoic acid in acetone, 2-propanol, acetic acid and cyclohexane: Experimental measurement and thermodynamic modeling. Fluid. Phase. Equilib. 2010; 297: 113–120.
CrossRef - Apelblat A, Manzurola E. Solubilities of o-acetylsalicylic, 4-aminosalic, 3,5, dinitrosalicylic, and p-toluic acid and magnesim D,L,-aspartate in water from T (278 to 348) K. J. Chem. Thermodyn. 1991; 31: 85–91.
CrossRef - Wang YN, Fu SX, Jia YX, Qian C, Chen XZ. Solubility of benzyl disulfide in five organic solvents between (283.45 and 333.15) K. J.Chem. Eng.Data. 2013; 58: 2483−2486.
CrossRef - Shi YL, Qian C, Chen XZ. Solubility measurement and correlation of (+)-biotin intermediate lactone in different organic solvents from 287.15 to 323.75 K. J.Chem. Eng.Data. 2016; 61: 1509−1516.
CrossRef - Buchowski H, Ksiazczak A, Pietrzyk S. Solvent activity along a saturation line and solubility of hydrogen-bonding solids. J. Phys. Chem. A. 1980; 84: 975–979.
CrossRef - van’t Hoff JH. L’équilibre chimique dans les systémes gazeux ou dissous à l’état dilué. Arch Néerl Sci. Exact. Nat. 1886; 20: 239-302.
- Gandhi PJ, Murthy ZVP. Solubility and crystal size of Sirolimus in different organic solvents. J.Chem. Eng.Data. 2010; 55: 5050–5054.
CrossRef - Heryanto R, Hasan M, Abdullaha EC, and Kumoro AC. Solubility of stearic acid in various organic solvents and its prediction using non-ideal solution models. Science Asia. 2007; 33: 469–472.
CrossRef - Buchowski H, Ksiazczak A, Pietrzyk S. Solvent activity along a saturation line and solubility of hydrogen-bonding solids. J. Phys. Chem. A. 1980; 84: 975–979.
CrossRef - Ksiazczak A, Kosinski J. Vapour pressure of binary, three-phase (S-L-V) systems and solubility. Fluid. Phase. Equilib. 1988; 44: 211–219.
CrossRef - Xiao M, Shao YD, Yan WD, Zhang ZZ. Measurement and correlation of solubilities of apigenin and apigenin 7-O-rhamnosylglucoside in seven solvents at different temperatures. J. Chem. Thermodyn. 2011; 43: 240–243.
CrossRef - Nti-Gyabaah J, Gbewonyo K, Chiew YC. Solubility of artemisinin in different single and binary solvent mixtures between (284.15 and 323.15) K and NRTL interaction parameters. J.Chem. Eng.Data. 2010; 55: 3356–3363.
CrossRef

This work is licensed under a Creative Commons Attribution-NonCommercial-ShareAlike 4.0 International License.

This work is licensed under a Creative Commons Attribution 4.0 International License.
![]()
A New Edition of Web of Science
Journal Impact Factor
2022: 0.5
Five Year: 0.8
Journal is Indexed in

Cabells Whitelist
![]()


