Inhibition Studies of the Synergistic Effect of Rosemary oil and Zinc Oxide on S41003 Ferritic Steel Corrosion in Dilute Sulphuric and Hydrochloric Acid Solutions
Roland Tolulope Loto
Department of Mechanical Engineering, Covenant University, Ota, Ogun State, Nigeria.
Corresponding Author E-mail: tolu.loto@gmail.com
DOI : http://dx.doi.org/10.13005/ojc/340127
Corrosion inhibition studies of the synergistic properties of the combined admixture of rosemary oil and zinc oxide (ROZ) on S41003 ferritic steel in 1M HCl and H2SO4 acid was done with potentiodynamic polarization, weight loss analysis, open circuit potential measurement, optical microscopy and ATR-FTIR spectroscopy. Results showed the admixed compound to be highly effective with maximum inhibition efficiencies of 93.68% and 93.26%, 98.93% and 90.5% in HCl and H2SO4 acid solutions from the electrochemical tests with dominant cathodic type inhibition characteristics. ROZ addition significantly shifts the corrosion potential values of S41003 to cathodic potentials from open circuit potential evaluation in both acid media signifying specific corrosion inhibition behavior without applied potential. Identified functional groups of alcohols, phenols, 1°, 2° amines, amides, carbonyls (general), esters, saturated aliphatic, carboxylic acids, ethers, aliphatic amines, alkenes, aromatics, alkyl halides and alkynes within ROZ compound aggregated completely on S41003 steel surface in HCl and partially in H2SO4 solution. Thermodynamic calculations showed physisorption molecular interaction and adsorption according to Langmuir and Frumkin isotherm models. Optical microscopy images of ROZ inhibited and uninhibited S41003 samples slightly differ from each other due to pre-adsorbed corrosive anions on the steel surface before ROZ inhibition.
KEYWORDS:Corrosion; Inhibitor; Steel; Acid; Adsorption
Download this article as:| Copy the following to cite this article: Loto R. T. Inhibition Studies of the Synergistic Effect of Rosemary oil and Zinc Oxide on S41003 Ferritic Steel Corrosion in Dilute Sulphuric and Hydrochloric Acid Solutions. Orient J Chem 2018;34(1). |
| Copy the following to cite this URL: Loto R. T. Inhibition Studies of the Synergistic Effect of Rosemary oil and Zinc Oxide on S41003 Ferritic Steel Corrosion in Dilute Sulphuric and Hydrochloric Acid Solutions. Orient J Chem 2018;34(1). Available from: http://www.orientjchem.org/?p=42942 |
Introduction
Stainless steels have a wide variety of industrial applications. They are corrosion resistant in specific environments due to the formation of a thin protective film on their surface. Deterioration of these films results in localized corrosion reactions responsible for corrosion failures such as pitting, intergranular, hydrogen embrittlement corrosion etc. in aqueous environments containing sufficient amounts of chlorides and sulphates anions. The ability of the protective film to reform on the steel surface after deterioration determines their resistance against localized failures. Chlorides and sulphates containing solutions are widely used in various technological processes in industry such as in pickling baths, mineral extraction and processing, oil and gas refinery, and chemical and petrochemical processing industries. In some cases they appear as a result of hydrolysis of salts which is catastrophic to equipment made of steel. Corrosion problem in these industries is a major problem as it represents a significant portion of loss due to lost production, high cost of maintenance and corrosion control1. Chemical compounds known as inhibitors are commonly used to reduce the corrosion attack on metallic materials2, 3. Application of corrosion inhibitors has been widely studied to solve metallic corrosion problems4, 5. Chemical compounds of natural and organic origin are the most promising for metallic corrosion inhibition due to their environmentally safe properties. The inhibition efficiency of these compounds is strongly dependent on the structure and chemical properties of the layer formed on the metal surface. Physiochemical properties of the compounds such as functional groups, steric factors, aromaticity, and their electronic structure influence their performance. In view of the toxic effect of most chemical inhibitors, this research aims to study the synergistic effect of rosemary oil and zinc oxide on S41003 stainless steel in dilute HCl and H2SO4 acid media.
Materials and Methods
Materials and Preparation
S41003 stainless steel (S41003) has a nominal composition (wt%) of 0.03% C, 1.5% Mn, 1% Si, 0.04% P, 0.015% S, 13% Cr, 1% Ni, 0.03% N and Fe (balance). The steel has a cylindrical shape with dimensions of 1.8 cm diameter and 1 cm length. Steel specimens were machined and abraded with silicon carbide papers (80, 320, 600, 800 and 1000 grits) before washing with distilled water and acetone, and kept in a desiccator for potentiodynamic polarization and weight loss measurement test according to ASTM G1 – 036. Rosemary oil obtained from NOW Foods, USA is a golden, translucent, oily liquid with major compositions such as p-cymene (44.02%), linalool (20.5%), gamma-terpinene (16.62%), thymol (1.81%), beta-pinene (3.61%), alphapinene (2.83%) and eucalyptol (2.64%). It is also composed of monoterpenic hydrocarbons, oxygenated monoterpenes and sesquiterpene hydrocarbons7. It has a molar mass (active groups) of 691.14 g/mol. Zinc oxide obtained from the University of Lagos, Nigeria, has a molar mass of 81.38 g/mol. It is a greyish white powder, insoluble in water and is widely used as an additive in numerous materials and products. The combined admixture of the compounds (ROZ) was prepared in molar concentrations of 6.47x 10³, 1.29 x 10², 1.94 x 10², 2.59 x 10², 3.24 x 10² 3.88 x 10²in 200 mL of 1M HCl and H2SO4 solutions, prepared from analar grade of both acids (37% HCl and 98% H2SO4) with distilled water.
Potentiodynamic Polarization Test
Polarization measurements were carried out at 30 ◦C ambient temperature with a three electrode system, conical glass cell containing 200 mL of the acid test solution and Digi-Ivy 2311 potentiostat. S41003 steels embedded in resin mounts with an unconcealed surface area of 2.54 cm2 were prepared according to ASTM G59-978. Potentiodynamic polarization curves were produced at a scan rate of 0.0015 V/s between potentials of -1 V and +1.5 V according to ASTM G102-899. Platinum rod was used as the counter electrode and silver chloride electrode (Ag/AgCl) as the reference electrode. Corrosion current density (Jcr, A/cm2) and corrosion potential (Ecr, V) values were obtained using the Tafel extrapolation method whereby the estimated corrosion current, Icr, was obtained from the intercept of the two linear segment of the Tafel slope of the cathodic and anodic polarization plots10, 11. The corrosion rate (CR) was calculated from the mathematical relationship;
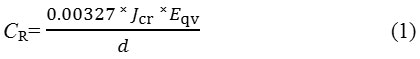
where Eqv is the sample equivalent weight in grams, 0.00327 is a constant for corrosion rate calculation (mm/y)12 and D is the density (g/cm3) The inhibition efficiency (η, %) was calculated from the corrosion rate values according to equation 2;
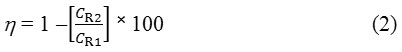
CR1and CR2 are the corrosion rates of the uninhibited and inhibited steel specimens. Polarization resistance (Rp, Ω) was calculated from equation 3 below;
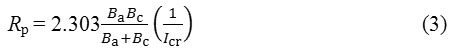
Where Ba is the anodic Tafel slope and Bc is the cathodic Tafel slope, both are measured as (V/dec).
FTIR spectroscopy and optical microscopy characterization
ROZ/1M HCl and H2SO4 solution (before and after the corrosion test) was exposed to specific range of infrared ray beams from Bruker Alpha FTIR spectrometer at wavelength range of 375 to 7500 cm-1 and resolution of 0.9 cm-1. The transmittance and reflectance of the infrared beams at various frequencies were decoded and transformed into an ATR-FTIR absorption plot consisting of spectra peaks. The spectral pattern was evaluated and equated with the theoretical ATR-FTIR absorption table to identify the functional groups responsible for corrosion inhibition. Micro-analytical images of the corroded and inhibited S41003 steel surface morphology from optical microscopy were analysed after the electrochemical test with Omax trinocular with the aid of ToupCam analytical software.
Weight loss and open circuit potential measurement
Measured S41003 coupons separately immersed in 200 mL of the dilute acid test solution for 240 h at 30oC were weighed at 24 h interval according to ASTM G31-7213. Corrosion rate (CR) was determined as follows as14;
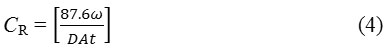
ω is the weight loss (mg), D is the density in g/cm3, A is the total surface area of the coupon in cm2 and 87.6 is a constant for corrosion rate determination. t is the time in h. Inhibition efficiency (η) was determined from the mathematical relationship;
![]()
ω1 and ω2 are the weight loss at specific ROZ concentrations. Surface coverage was determined from the relationship15, 16:
where θ is the degree of ROZ compound, adsorbed per gram of the steel samples. ω1 and ω2 are the weight loss of each steel coupon at specific concentrations of ROZ in the acid solution. OCP measurements were obtained at a step potential of 0.05V/s with two-electrode electrochemical cell consisting of Ag/AgCl reference electrode and resin mounted steel specimens (exposed surface of 2.54 cm2) as the working electrode, connected to Digi-Ivy 2311 potentiostat according to ASTM G69 – 1217. The electrodes were fully immersed in 200 ml of the test media at specific concentrations of ROZ for 2400s
Results and Discussion
Potentiodynamic Polarization Studies
The potentiodynamic polarization plots for S41003 in 1M HCl and H2SO4 solutions are shown in Figs. 1 and 2. Experimental results are presented in Table 1. The corrosion rate values of the inhibited S41003 samples (0.5% – 2.5% ROZ) in both acids significantly contrasts the values obtained for S41003 specimen at 0% ROZ due to the inhibiting action of ROZ compound on S41003. The observed differences in corrosion rate coincide with decrease in corrosion current density and increase in polarization resistance values with increase in ROZ concentration. ROZ maintained effective inhibition efficiency values with optimal inhibition efficiency of 93.68% (2.5% ROZ) and 94.49% (1.5% ROZ) in HCl and H2SO4 solution. The corrosion rate results for S41003 in HCl are significantly lower than values in H2SO4 due to the ability of H2SO4 to completely ionize in solution releasing two protons that strongly react with the steel surface compared to HCl which releases one proton. This also explains the comparatively similar inhibition efficiencies of ROZ in both acids as ROZ protonates strongly in H2SO4 allowing more molecules to release electrons, this phenomenon increases the reactivity of ROZ compound enabling strong interaction with the steel surface18.
ROZ shifts the polarization plots of S41003 in HCl to cathodic potentials with respect to its concentration due to suppression of electron flow across the metal–solution interface. The higher the concentration of ROZ, the greater the cathodic shift. This phenomenon is responsible for the low anodic Tafel slope values in comparison to values for cathodic Tafel slope (Table 1), as a result ion transfer processes of anodic reaction are also restricted. ROZ probably adsorbed selectively on cathodic areas to limit the diffusion of reducing species, increasing the surface impedance of the alloy. In H2SO4 solution, there is a large cathodic shift of the polarization plot at 0.5% and 2.5% ROZ i.e. at the highest and lowest concentration studied. The cathodic shift at 1% – 2% ROZ is limited, however the cathodic inhibition property of ROZ is clearly visible. The cathodic inhibition property of ROZ occurred due to electrostatic attractive forces between the ionic charges or dipoles on the adsorbed ROZ molecule and the electric charge on S41003 at the metal-solution interface.
The functional groups and structure of ROZ binds to the metal surface by electron transfer to form a coordinate type of linkage responsible for the strong bonding and effective inhibition. The zinc component of ROZ compound reacts with the products of the cathodic reaction (OH−) to form insoluble Zn(OH)2 which precipitates at cathodic sites on S41003 surfaces as the local environment becomes more alkaline due to the reduction reaction at these sites19-21. Zinc particles enhance the inhibition performance of ROZ through formation of a barrier between the acid solution and the alloy surface. Zinc being more electrochemically active than iron, serves as the anode for the steel in the acid solution preventing the formation of small anodic and cathodic sites on the metal surface. The anodic Tafel slope values obtained signifies the presence of surface oxides from the slow electron transfer step which remained generally the same due to minimal variation in electrode substrate, rate controlling step and influence of potential controlled conditions22, 23. The maximum change in corrosion potential value in HCl and H2SO4 solution 173mV and 135mV in the cathodic direction, thus ROZ is a cathodic inhibitor.
Table 1: Potentiodynamic polarization results for S41003 in 1M HCl and H2SO4 (0% -2.5 % ROZ)
| HCl | ||||||||||
| Sample | ROZ Conc. (%) | ROZ Conc. (M) | Corrosion Rate (mm/y) | ROZ Inhibition Efficiency (%) | Corrosion Current (A) | Corrosion Current Density (A/cm2) | Corrosion Potential (V) | Polarization Resistance, Rp (Ω) | Cathodic Tafel Slope, Bc, (V/dec) | Anodic Tafel Slope, Ba, (V/dec) |
| A | 0 | 0 | 6.78 | 0 | 1.49E-03 | 5.85E-04 | -0.039 | 10.29 | -10.620 | 1.968 |
| B | 0.5 | 6.47E-03 | 0.83 | 87.83 | 1.81E-04 | 7.12E-05 | -0.048 | 106.31 | -8.327 | 2.282 |
| C | 1 | 1.29E-02 | 0.62 | 90.81 | 1.37E-04 | 5.37E-05 | -0.132 | 180.50 | -8.480 | 2.811 |
| D | 1.5 | 1.94E-02 | 0.55 | 91.82 | 1.22E-04 | 4.78E-05 | -0.153 | 103.97 | -8.620 | 2.364 |
| E | 2 | 2.59E-02 | 0.43 | 93.62 | 9.48E-05 | 3.73E-05 | -0.176 | 192.26 | -9.254 | 3.413 |
| F | 2.5 | 3.24E-02 | 0.43 | 93.68 | 9.38E-05 | 3.69E-05 | -0.212 | 350.15 | -8.065 | 3.648 |
| H2SO4 | ||||||||||
| Sample | ROZ Conc. (%) | ROZ Conc. (M) | Corrosion Rate (mm/y) | ROZ Inhibition Efficiency (%) | Corrosion Current (A) | Corrosion Current Density (A/cm2) | Corrosion Potential (V) | Polarization Resistance, Rp (Ω) | Cathodic Tafel Slope, Bc, (V/dec) | Anodic Tafel Slope, Ba, (V/dec) |
| A | 0 | 0 | 35.93 | 0 | 7.87E-03 | 3.10E-03 | -0.064 | 20.50 | -9.526 | 8.594 |
| B | 0.5 | 6.47E-03 | 4.15 | 88.45 | 9.09E-04 | 3.58E-04 | -0.178 | 209.15 | -9.186 | 8.266 |
| C | 1 | 1.29E-02 | 4.33 | 87.95 | 9.48E-04 | 3.73E-04 | -0.063 | 249.12 | -9.171 | 8.418 |
| D | 1.5 | 1.94E-02 | 1.98 | 94.49 | 4.33E-04 | 1.71E-04 | -0.071 | 238.05 | -8.537 | 7.170 |
| E | 2 | 2.59E-02 | 3.36 | 90.66 | 7.35E-04 | 2.89E-04 | -0.095 | 284.16 | -8.822 | 8.040 |
| F | 2.5 | 3.24E-02 | 2.42 | 93.26 | 5.30E-04 | 2.09E-04 | -0.199 | 202.90 | -8.921 | 7.490 |
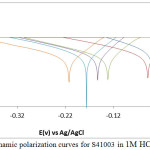 |
Figure 1: Potentiodynamic polarization curves for S41003 in 1M HCl (0% -2.5 % ROZ) Click here to View figure |
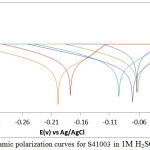 |
Figure 2: Potentiodynamic polarization curves for S41003 in 1M H2SO4 (0% -2.5 % ROZ) Click here to View figure |
Adsorption Isotherm
The inhibition efficiency of a corrosion inhibiting compounds is majorly a product of its adsorption strength on the alloy surface. The surface protection of ROZ depends upon the orientation of adsorption of the inhibitor molecule on the metal surface, and also the ionization and polarization of ROZ molecules24. Adsorption isotherms give valuable information about the molecular interaction between the adsorbed inhibitor molecules and the valence electrons of the alloy surface. The adsorption mechanism occurs when liquid solute aggregates on metallic surfaces, forming a molecular or atomic film. The mechanism of ROZ inhibition on S41003 was studied through adsorption isotherms models which show the phenomenon governing the retention of a substance from aqueous solution to solid interphase at a constant temperature and pH25, 26. Langmuir and Frumkin gave the best fitting for ROZ adsorption in HCl and H2SO4 as shown from Figs. 3(a) – 4(b) according to equations (7-9).
Graphical plots of
![]()
vs CROZ aligns with the Langmuir isotherm [Fig. 3(a) and 3(b)], with a correlation coefficient of 0.9974 in HCl solution and 0.9981 in H2SO4 according to the Langmuir equation below.
θ is the degree of ROZ adsorbed per unit weight on S41003 surface at equilibrium. CROZ is ROZ concentration and KROZ is the equilibrium constant of adsorption. Langmuir isotherm assumes monomolecular layer adsorption at specific reaction areas on the alloy surface. The molecular adsorptions are similar, proportionate and no lateral interaction between the adsorbed molecules exists27.
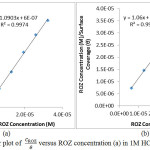 |
Figure 3: Langmuir plot of CROZ/θ versus ROZ concentration (a) in 1M HCl, (b) in 1M H2SO4 Click here to View figure |
The Frumkin adsorption isotherm assumes heterogeneous nature of the steel surface i.e. the effect of lateral interaction apparent according to the equation below28;
![]()
Rearranging the equation becomes
![]()
α is the interaction parameter which describes the molecular interaction in adsorbed layer, and calculated from the slope of the Frumkin isotherm plot. Taking into account, the attraction (α>0), repulsion (α<0) and no interaction (α=0) between the adsorbed species, the isotherm becomes equivalent to the Langmuir isotherm. For +ve α, adsorption energy increases with θ whereas for negative α adsorption energy decreases with θ. KROZ is the equilibrium constant of adsorption. Plots of log [θ / (1-θ) CROZ] versus θ in Fig. 4(a) and (b) showed a correlation coefficient of 0.8614 in HCl and 0.8135 in H2SO4.
![Figure 4: Frumkin isotherm plot of log [θ / (1-θ) c] versus θ (a) in (a) 1M HCl, (b) 1M H2SO4](http://www.orientjchem.org/wp-content/uploads/2018/02/Vol34No1_Inh_Rol_fig4-150x150.jpg) |
Figure 4: Frumkin isotherm plot of log [θ / (1-θ) c] versus θ (a) in (a) 1M HCl, (b) 1M H2SO4 Click here to View figure |
Thermodynamics of the Corrosion Inhibition
The adsorption strength and nature of inhibition mechanism of ROZ on S41003 was determined from the thermodynamics of ROZ molecular interaction with the alloy surface through the equilibrium constant of adsorption from the Langmuir Isotherm due to its correlation coefficient being cloeser unity. Calculated results of Gibbs free energy of adsorption in HCl and H2SO4 solution is shown in Table 2, from the following equation29.
ΔGads = – 2.303 RT log [55.5 KROZ] (10)
55.5 is the molar concentration of water in the acid solution, R is the universal gas constant, T is the absolute temperature and KROZ is the equilibrium constant of adsorption. Negative values of ΔGoads signify spontaneous and stable adsorption reactions. In HCl solution, the lowest ΔGoads value is -25.13 kJmol-1 at 3.24 x 10²M and the highest ΔGoads value of -27.34 kJmol-1 at 6.47 x 10³ M on S41003 surface. The lowest and highest values in H2SO4 are -24.96 kJmol-1 at 3.24 x 10²M and -27.51 kJmol-1 at 6.47 x 10³ M. These ΔGoads values in both acid media depict physisorption adsorption reaction mechanisms i.e. physical interaction of ROZ molecules through Vander Waals forces on the steel’s surface30, 31. The result also proves that the inhibition mode is through surface coverage of the steel surface in accordance to Langmuir and Frumkin adsorption isotherm.
Table 2: Results for Gibbs free energy (ΔGoads), surface coverage (θ) and equilibrium constant of adsorption (KROZ) for ROZ adsorption on S41003 in 1M HCl and H2SO4 acid solution
| HCl | ||||
| Sample | ROZ Concentration (M) | Surface Coverage (θ) | Equilibrium Constant of adsorption (KROZ) | Gibbs Free Energy, ∆G (kJmol-1) |
| A | 0 | 0 | 0 | 0 |
| B | 6.47E-03 | 0.878 | 1115.2 | -27.34 |
| C | 1.29E-02 | 0.908 | 766.0 | -26.41 |
| D | 1.94E-02 | 0.918 | 578.6 | -25.71 |
| E | 2.59E-02 | 0.936 | 566.6 | -25.66 |
| F | 3.24E-02 | 0.937 | 457.8 | -25.13 |
| H2SO4 | ||||
| Sample | ROZ Concentration (M) | Surface Coverage (θ) | Equilibrium Constant of adsorption (KROZ) | Gibbs Free Energy, ∆G (Jmol-1) |
| A | 0 | 0 | 0 | 0 |
| B | 6.47E-03 | 0.885 | 1183.8 | -27.49 |
| C | 1.29E-02 | 0.88 | 566 | -25.66 |
| D | 1.94E-02 | 0.945 | 884.6 | -26.77 |
| E | 2.59E-02 | 0.907 | 374.6 | -24.64 |
| F | 3.24E-02 | 0.933 | 427.3 | -24.96 |
ATR-FTIR Spectroscopy Analysis
Molecular functional groups responsible for the characteristic chemical reactions of corrosion inhibition of S41003 steel within ROZ compound and the bond type within their molecular structure in HCl and H2SO4 solution was identified by ATF-FTIR spectroscopy as shown on Tables 3 and 4 after being matched with the ATR-FTIR Theoretical Table32, 33. The spectra curves of the acid test solution before and after corrosion from both acids are shown in Fig. 5. The calculated wavenumbers of identified functional groups of alcohols, phenols, 1°, 2° amines, amides, carbonyls (general), esters, saturated aliphatic, carboxylic acids, ethers, aliphatic amines, alkenes, aromatics, alkyl halides and alkynes within ROZ molecules in HCl solution (Table 3) before corrosion (without S41003 steel) slightly increased to higher wavenumbers after corrosion (in the presence of S41003). This show the functional groups aggregated on the steel surface did not chemisorb, confirming the inhibition mode to be through surface coverage as a result of molecular attraction by Van der waals forces whereby the diffusion of corrosive anions onto the steel are effectively hindered. The observation agrees with result from thermodynamics of corrosion inhibition. The bonds within their molecular structure of the earlier mentioned functional groups consists of O–H stretch, H–bonded, N–H stretch, C=O stretch, C–O stretch, C–H wag (–CH2X), C–N stretch, =C–H bend, N–H wag, C–H “oop”, C–Cl stretch, C–Cl stretch, –C≡C–H, C–H bend and C–Br stretch which are responsible for attachment to the valence electron of S41003 steel.
The observation for ROZ adsorption and inhibition in H2SO4 solution contrast the earlier observation in HCl solution. Functional groups of carboxylic acids, alkanes, carbonyls (general), esters, saturated aliphatic, alcohols, ethers, alkyl halides, aliphatic amines, alkenes, 1°, 2° amines, aromatics and alkyl halides consisting of specific bond types (Table 4) significantly adsorbed onto S41003 steel. The calculated wavelengths values after corrosion (with S41003 steel) shows the functional groups in H2SO4 solution partially adsorbed onto the steel while simultaneously forming a protective covering on the steel.
Table 3: ATR-FTIR spectroscopic data of frequencies and adsorption peaks of ROZ/1M HCl solution before and after S41003 corrosion
| Theoretical wavenumber (cm–1) | Calculated Wavenumber, Before Corrosion (cm-1) | Calculated Wavenumber, After Corrosion (cm-1) | Bond | Functional group |
| 3400–32503500–3200 | 3344.97 | 3352.17 | O–H stretch, H–bonded, N–H stretch | alcohols, phenols, 1°, 2° amines, amides |
| 3300–25003000–2850 | 2954.80, 2921.98, 2853.98 | 2961.29, 2924.27, 2854.38 | O–H stretch, C–H stretch | carboxylic acids, alkanes |
| 1760–16651760–16901750–1735 | 1746.92 | 1766.34, 1707.03 | C=O stretch | carbonyls (general), esters, saturated aliphatic |
| 1650–1580 | 1634.63 | 1636.26 | N–H bend | 1° amines |
| 1500–14001470–1450 | 1461.45 | 1468.54, 1444.23, 1408.56, , 1348.35 | C–C stretch (in–ring), C–H bend, N–O symmetric stretch | aromatics, alkanes, nitro compounds |
| 1320–10001300–11501250–1020 | 1214.97, 1166.83, 1079.52, 1052.43 | 1258.69, 1204.25, 1079.48, 1011.29 | C–O stretch, C–H wag (–CH2X), C–N stretch | alcohols, carboxylic acids, esters, ethers, alkyl halides, aliphatic amines |
| 1000–650910–665900–675850–550 | 985.27, 885.34, 842.82 | 789.26 | =C–H bend, N–H wag ,C–H “oop”, C–Cl stretch | alkenes, 1°, 2° amines, aromatics, alkyl halides |
| 850–550700–610690–515 | 625.91 | 660.59 | C–Cl stretch , –C≡C–H: C–H bend, C–Br stretch | alkyl halides, alkynes, |
Table 4: ATR-FTIR spectroscopic data of frequencies and adsorption peaks of ROZ/1M H2SO4 solution before and after S41003 corrosion
| Theoretical wavenumber (cm–1) | Calculated Wavenumber, Before Corrosion (cm-1) | Calculated Wavenumber, After Corrosion (cm-1) | Bond | Functional group |
| 3300–25003000–2850 | 2953.69, 2853.56 | 2922.23, 2853.22 | O–H stretch, C–H stretch | carboxylic acids, alkanes |
| 1760–16651760–16901750–1735 | 1747.46 | 1635.77 | C=O stretch | carbonyls (general), carboxylic acids, esters, saturated aliphatic |
| 1500–14001470–1450 | 1461.75 | 1441.46 | C–C stretch (in–ring), C–H bend | aromatics, alkanes |
| 1370–1350 | 1375.82 | 1348.83 | C–H rock | alkanes |
| 1320–10001300–11501250–1020 | 1214.97, 1166.83, 1052.43, 1016.88 | 1202.47, 1103.67, | C–O stretch, C–H wag (–CH2X), | alcohols, carboxylic acids, esters, ethers, alkyl halides, aliphatic amines |
| 1000–650910–665900–675850–550725–720 | 985.37, 885.96, 843.50, 787.28, 722.96 | 978.78 | =C–H bend, N–H wag ,C–H “oop”, C–Cl stretch, C–H rock | alkenes, 1°, 2° amines, aromatics, alkyl halides, alkanes |
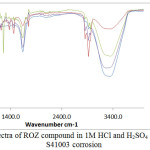 |
Figure 5: ATF-FTIR spectra of ROZ compound in 1M HCl and H2SO4 solution before and after S41003 corrosion Click here to View figure |
Weight loss and open circuit potential (OCP) measurements
Plots of corrosion rate versus exposure time for S41003 from weight loss measurement are shown in Fig. 6(a) and 6(b). Data from for S41003 corrosion rate (CR), weight loss (ῶ) and ROZ inhibition efficiency (ɲ) at 240 h are shown in Table 5. Fig. 7 shows the OCP measurement of uninhibited and ROZ inhibited S41003 samples in both acid media. The corrosion rate of S41003 at 0% ROZ in HCl increased progressively till 0.0219mm/y at 240 h, compared to the alloy’s behavior in H2SO4 solution wherewith its corrosion rate value decreased suddenly after 48h of exposure and remained generally constant until 216h, thereafter it slightly decreased further to 0.0568mm/y at 240 h. Addition of ROZ compound changed the electrochemical nature and mechanism of reaction of the acid test solutions. The corrosion rate of S41003 decreased sharply after 0% ROZ in both acids, showing similar trend in corrosion rate values at 0.5% – 2.5% ROZ with respect to exposure time due to the effective inhibiting action of ROZ compound. This observation is consistent with the OCP plot of potential vs time (Fig. 7). In the absence of ROZ compound S41003 had an OCP value of -0.066V in HCl; this value decreased to -0.083V at 876s and remained generally constant till 2700s. In H2SO4, the OCP value of S41003 started at -0.077V at 0s and decreased to -0.088V at 515s after which it remained generally constant till 2700s, signifying the dominant effect of the cathodic reaction mechanism during S41003 corrosion. Addition of ROZ compound significantly altered the active passive behavior of S41003 with a major shift in corrosion potential values to -0.024V and -0.018V in HCl and H2SO4 solution. These values decreased to -0.047V at 1076s for both acids. The potential value of S41003 in HCl continued to decrease until -0.056V at 2700s while the value in H2SO4 remained generally constant henceforth till 2700s. The corrosion rate plots in Figs. 6(a) and (b) shows ROZ efficiency is independent of concentration with the exception of 2.5% ROZ in HCl which attains a maximum inhibition of 98.92%. ROZ stifled the hydrogen evolution and oxygen reduction reactions responsible for corrosion of S41003, being the dominant reaction mechanism from potentiodynamic polarization study. The release of metal cations into the acid solutions through the action of Cl– and SO42- ions was effectively inhibited through surface coverage and modification of the corrosive test solution.
Table 5: Result for S41003 inhibition in 1M HCl and H2SO4 240 h from weight loss measurement
| HCl | |||||
| Samples | Weight Loss (g) | ROZ Concentration (%) | ROZ Concentration (M) | Corrosion Rate (mm/yr) | ROZ Inhibition Efficiency (%) |
| A | 4.196 | 0 | 0 | 0.0219 | 0 |
| B | 0.376 | 0.5 | 6.47E-03 | 0.0021 | 91.04 |
| C | 0.316 | 1 | 1.29E-02 | 0.0020 | 92.46 |
| D | 0.404 | 1.5 | 1.94E-02 | 0.0022 | 90.36 |
| E | 0.399 | 2 | 2.59E-02 | 0.0022 | 90.50 |
| F | 0.045 | 2.5 | 3.24E-02 | 0.0003 | 98.92 |
| H2SO4 | |||||
| Samples | Weight Loss (g) | ROZ Concentration (%) | ROZ Concentration (M) | Corrosion Rate (mm/yr) | ROZ Inhibition Efficiency (%) |
| A | 9.5395 | 0 | 0 | 0.0568 | 0 |
| B | 1.5045 | 0.5 | 6.47E-03 | 0.0066 | 84.23 |
| C | 1.4208 | 1 | 1.29E-02 | 0.0070 | 85.11 |
| D | 0.9012 | 1.5 | 1.94E-02 | 0.0047 | 90.55 |
| E | 1.2019 | 2 | 2.59E-02 | 0.0062 | 87.40 |
| F | 0.9058 | 2.5 | 3.24E-02 | 0.0054 | 90.50 |
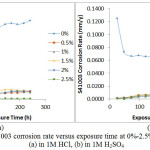 |
Figure 6: Plot of S41003 corrosion rate versus exposure time at 0%-2.5% ROZ concentration (a) in 1M HCl, (b) in 1M H2SO4 Click here to View figure |
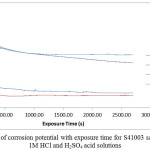 |
Figure 7: Variation of corrosion potential with exposure time for S41003 samples immersed in 1M HCl and H2SO4 acid solutions Click here to View figure |
Optical microscopy analysis
Optical microscopy images of S41003 before and after corrosion test with and without ROZ compound from HCl and H2SO4 solution are shown from Figs. 8 to 10(b). Fig. 8 shows the optical image of S41003 steel before corrosion at mag. x100, the result of machining and metallography. The optical image of S41003 samples [Figs. 9(a) and 10 (a)] from HCl and H2SO4 solution shows a severely degraded morphology due to the action of chloride and sulphate anions. The two morphologies without ROZ compounds tend to be generally similar in surface deterioration as a result of the formation of numerous micro-pits after the destruction of the passive protective film resulting from severe active corrosion reactions of anodic dissolution. In the presence of ROZ the dynamics of the electrochemical corrosion mechanism changes resulting in the surface morphology shown in Fig. 9(b) and 10(b). The morphology of S41003 from HCl deteriorated further compared to the image from H2SO4 due to the smaller size of chloride ions than sulphates which enables its diffusion through the passive oxide film of S4100334. The mild deterioration of ROZ inhibited S41003 samples is probably due to pre-adsorbed anions before adsorption of ROZ cations by physisorption mechanism through Vander Waals forces onto the steel. This inhibits further diffusion and electrolytic transport of chloride and sulphates anions.
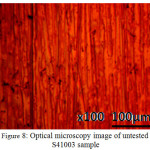 |
Figure 8: Optical microscopy image of untested S41003 sample Click here to View figure |
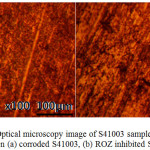 |
Figure 9: Optical microscopy image of S41003 sample from HCl solution (a) corroded S41003, (b) ROZ inhibited S41003 Click here to View figure |
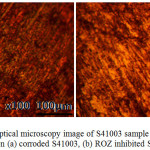 |
Figure 10: Optical microscopy image of S41003 sample from H2SO4 solution (a) corroded S41003, (b) ROZ inhibited S41003 Click here to View figure |
Statistical analysis
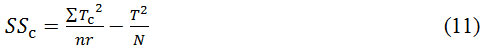
Statistical analysis through ANOVA at a confidence level of 95% (significance level of α = 0.05) was used to calculate the statistical influence of ROZ concentration and exposure time on ROZ inhibition efficiency values on S41003 in HCl and H2SO4 solutions according to eqns. (11-13).
The Sum of squares among columns (ROZ concentration)
Sum of Squares among rows (Exposure time)
Total Sum of Squares
Statistical data in Table 6 showed that exposure time is the only relevant statistical variable statistically responsible for ROZ inhibition efficiency values with F-values of 28.83 in HCl and 94.12 in H2SO4 solution respectively. These values are greater than the control significance factor (significance F) value of 2.42, corresponding to a percentage significance of 87.99% (HCl) and 96.07% (H2SO4). The results show that change in exposure time has strong influence the electrochemical corrosion behavior and inhibitor protection of ROZ on S41003 stainless steel alloy in contrast to ROZ concentration which is statistically irrelevant. ROZ inhibition efficiency is independent of inhibitor concentration as a result irrespective of concentration, the efficiency of ROZ compound changes with time.
Table 6: Analysis of variance (ANOVA) for S41003 in 1M HCl & H2SO4 at 95% confidence level
| HCl | ||||||
| Source of Variation | Sum of Squares | Degree of Freedom | Mean Square | Mean Square Ratio (F) | Significance F (Min. MSR at 95% confidence) | F (%) |
| ROZ concentration | 328.76 | 4 | 82.19 | -0.05 | 2.53 | -0.14639 |
| Exposure Time | -197508 | 4 | -49376.9 | 28.83 | 2.42 | 87.99 |
| Residual | -27401.3 | 16 | -1712.58 | |||
| Total | -224580 | 24 | ||||
| H2SO4 | ||||||
| Source of Variation | Sum of Squares | Degree of Freedom | Mean Square | Mean Square Ratio (F) | Significance F (Min. MSR at 95% confidence) | F (%) |
| ROZ concentration | 299.7 | 4 | 74.92 | -0.15 | 2.53 | -0.15167 |
| Exposure Time | -189831 | 4 | -47457.7 | 94.12 | 2.42 | 96.07 |
| Residual | -8067.27 | 16 | -504.2 | |||
| Total | -197599 | 24 | ||||
Conclusion
The synergistic effect of rosemary oil and zinc oxide performed effectively on the corrosion inhibition S41003 ferritic steel in HCl and H2SO4 acid solutions from electrochemical analysis, weight loss test and corrosion potential monitoring. The admixture compound formed a protective covering over the steel through physisorption mechanism according to the Langmuir and Frumkin adsorption isotherm. Identified functional groups completely adsorbed onto S41003 steel in H2SO4 but aggregated in HCl forming a protective covering through surface coverage from analysis of the adsorption spectra. The optical images of the inhibited steel samples slightly contrast the images without ROZ compound due to preadsorbed sulphate and chloride anions onto the steel.
Conflict of Interest
Authors declare no conflict of interest
Acknowledgement
The author acknowledges Covenant University Ota, Ogun State, Nigeria for the sponsorship and provision of research facilities for this project.
References
- Tantawy, N. The Annals of University Dunărea de JOS of Galaţi Fascicle VIII. 2005,112-114.
- Sastri, V.S. Green Corrosion Inhibitors Theory and Practice, Wiley, Yukon, Canada, 2011.
CrossRef - Raja. P.B.; Sethuraman, M.G. Mats. Letts. 2008, 62, 113–116.
- Obi-Egbedi, N.O.; Obot, I.B.; Umoren, S.A. Arabian J. of Chem. 2012, 5(3), 361–373.
CrossRef - Hussin. M.H.; Kassim, M.J. Int. J. of Elect. Sci. 2011, 6(5), 1396–1414.
- ASTM G1 – 03(2011), Standard Practice for Preparing, Cleaning, and Evaluating Corrosion Test Specimens. http://www.astm.org/Standards/G1 [Accessed: 30/05/16].
- Ozcan, M.M.; Chalchat, J.C. Int. J. of Food Sciences & Nutrition. 2008, 59(7-8), 691-698
CrossRef - ASTM G59 – 97(2014). Standard Test Method for Conducting Potentiodynamic Polarization Resistance Measurements. http://www.astm.org/Standards/G31 [Accessed: 30/05/16].
- ASTM G102 – 89(2015)e1. Standard Practice for Calculation of Corrosion Rates and Related Information from Electrochemical Measurements. http://www.astm.org/Standards/G31 [Accessed: 30/05/16).
- Basics of corrosion measurements http://www.che.sc.edu/faculty/popov/drbnp/ECHE789b/Corrosion%20Measurements.pdf [Accessed: 06/04/17).
- Corrosion Part 2 – Measurement of Corrosion Rates http://www.ecochemie.nl/download/Applicationnotes/Autolab_Application_Note_COR02.pdf [Accessed: 06/04/17]
- Choi, Y.; Nesic, S.; Ling, S. Electrochim. Acta. 2011, 56, 1752-1760.
CrossRef - ASTM G31 – 72, Standard Practice for Laboratory Immersion Corrosion Testing of Metals. https://www.astm.org/DATABASE.CART/HISTORICAL/G31-72R04.htm [Accessed: 06/04/2017]
- Venkatesan, P.; Anand, B.; Matheswaran, P. E-J. of Chem. 2009, 6(S1), S438-S444.
CrossRef - Schutt, H.U.; Horvath, R.J. Crude Column Overhead Corrosion Problem Caused by Oxidized Sulfur Species, NACE, Houston, Texas, 1987.
- Schofield, M.J, Plant Engineerʼs Reference Book, Elsevier, 2003.
- ASTM G69 – 12. Standard test method for measurement of corrosion potentials of aluminum alloys. https://www.astm.org/Standards/G69.htm [Accessed: 21/05/2017].
- Loto, R.T.; Loto, C.A. Cogent Chem. 2016, 2, 1268377. http://dx.doi.org/10.1080/23312009.2016.1268377.
CrossRef - Stone, P.J. Corrosion Inhibitors for Oil and Gas Production, Corrosion, ASM Handbook, ASM International, 13, 1987.
- Zaim, S.; Muralidharan, S.; Iyer, S.; Muralidharan, B.; Vasudevan, T. Br. Corros. J. 1998, 33, 297.
CrossRef - Cisse, M.B.; Zerga, B.; El Kalai, F.; Touhami, M.E.; Sfaira, M.; Taleb, M.; Hammouti, B.; Benchat, N.; El Kadiri, S.; Benjelloun, A.T. Surf. Rev. Lett. 2011, 18(6), 303-313.
CrossRef - Bockris, J.O.; Drazic, D.; Despic, A.R. Electrochim. Acta. 1961, 4(2-4), 325-361.
CrossRef - Bockris, J.O.; Kita, H. J. of the Elect. Soc. 1961, 108(7), 676-685.
- Refaey, S.A.M.; Taha, F.; Abd El-Malak, A.M. Int. J. of Elect. Sci. 2006, 1, 80–91.
- Limousin, G.; Gaudet, J.P.; Charlet, L.; Szenknect, S.; Barthes, V.; Krimissa, M. Appl. Geochem. 2007, 22, 249–275.
CrossRef - Allen, S.J.; Mckay, G.; Porter, J.F. J. Colloid Interface Sci. 2004, 280, 322–333.
CrossRef - Guidelli, R. Adsorption of Molecules at Metal Electrodes, Lip Kowski, J.; Ross, P.N. (eds.), VCH Publishers, lnc., Ncw York, p.1, 1992.
- Hosseini, M.; Mertens, S.F.L.; Arshadi, M.R. Corros. Sci. 2003, 45, 1473–1489.
CrossRef - Aharoni, C.; Ungarish, M. J. Chem. Soc. Faraday Trans. 1977, 73, 456–464.
CrossRef - Loto, R.T. Rev. Colomb. Quim. 2017, 46(1), 20-32.
CrossRef - Loto, R.T.; Loto, C.A.; Popoola, A.P.I.; Fedotova, T. Arabian J. of Chem. 2015. http://dx.doi.org/10.1016/j.arabjc.2014.12.024
CrossRef - Table of Characteristic IR Absorptions. http://orgchem.colorado.edu/Spectroscopy/specttutor/irchart.pdf. [Accessed: 12/01/2017].
- George, S. Infrared and Raman Characteristic Group Frequencies: Tables and Charts, John Wiley & Sons, New York, 2004.
- Loto, R.T. J. Mater. Environ. Sci. 2013, 4(4), 448-459

This work is licensed under a Creative Commons Attribution-NonCommercial-ShareAlike 4.0 International License.

This work is licensed under a Creative Commons Attribution 4.0 International License.
![]()
A New Edition of Web of Science
Journal Impact Factor
2022: 0.5
Five Year: 0.8
Journal is Indexed in

Cabells Whitelist
![]()


