Effect of Nitrogen Plasma Treatment and Direct Dye on Zeta Potential of Cotton Fabric
Hamed Aboltakhty1, Abosaeed Rashidi1 , Mohammad Esmail Yazdanshenas2 and Sheila Shahidi3
1Department of Textile, Science and Research Branch, Islamic Azad University, Tehran, Iran.
2Department of Textile, Yazd Branch, Islamic Azad University, Yazd, Iran.
3Department of Textile, Arak Branch, Islamic Azad University, Arak, Iran.
Corresponding Author E-mail: rashidi50@yahoo.com
DOI : http://dx.doi.org/10.13005/ojc/340133
In this paper, cotton fabrics were washed, bleached and then treated with low-temperature plasma of nitrogen then dyed with direct dyes. Some properties of the samples such as zeta potential, weight loss, crystal intensity, dyeability and washing fastness were investigated. The relative color strength and reflection properties of dyed samples were measured by using reflective spectrophotometry. The morphological changes of cotton samples after nitrogen plasma were studied by scanning electron microscope. Also chemical changes and zeta potential of samples have been investigated by using Fourier Transform Infrared Spectroscopy (FTIR) and zeta sizer respectively. The results show that zeta potential of cotton fabrics influenced by plasma treatment and also dye, plasma treatment cause to improve color strength near 20%.
KEYWORDS:Cotton Fabric; Plasma Treatment; Zeta Potential; Direct Dye
Download this article as:| Copy the following to cite this article: Aboltakhty H, Rashidi A, Yazdanshenas M. E, Shahidi S. Effect of Nitrogen Plasma Treatment and Direct Dye on Zeta Potential of Cotton Fabric. Orient J Chem 2018;34(1). |
| Copy the following to cite this URL: Aboltakhty H, Rashidi A, Yazdanshenas M. E, Shahidi S. Effect of Nitrogen Plasma Treatment and Direct Dye on Zeta Potential of Cotton Fabric. Orient J Chem 2018;34(1). Available from: http://www.orientjchem.org/?p=43140 |
Introduction
Plasma is a mixture of photons, electrons, positive and negative ions, free radicals and excited molecules. In general, all of these species have interact with the surface of textiles. Plasma treatment can change surface properties of materials such as textiles without influence on the bulk properties. The depth of surface treatment is less than 100 nm. Chemical properties of fiber surface will improve and change [1, 2].
Characters such as wettability or disposal of oil/water may improve in fibers. Other properties such as adhesion, compatibility with environment, resistance to tear, dyeing rate and color depth, clear the surface of the fibers in sizing, may improve [1, 3, 4].
Plasma surface modification of textile is a subject of many factors such as type of gas composition, type of textile, power and electrical power frequency, temperature and duration of operations. Combining these factors make different effects on textiles. One of them is etching on the surface or cleaning the surface of textiles [1, 5].
Plasma process involves removing a thin layer from surface. With this treatment, the shape of the surface and wetting characteristics will change. It seems that the polymers contain oxygen groups are more sensitive than the polyolefin to remove the surface layer. Plasma treatment under the same conditions for polyester tends to remove the layer more than nylon 6, and nylon 6 is more than polypropylene [1, 3, 6-8].
Chemically modified by the specific functional groups on the surface is another effect of plasma process. Type of functional group depends on the nature of plasma gas which applied. These groups may improve wettability properties, biocompatible, adhesion, or to reduce surface activity. Polymers can grafted to activated part of fiber surface [9, 10].
Also, by using polymerizing gases, plasma causes polymerization or plasma vapor deposition. The deposited thin film has a strong crosslinking nature. It is reported that the pressure range 1-100 mbar is suitable for most textile fabrics and low pressure technology operate greater uniformity [11-13].
Cotton is one of the most textile fibers which has been widely used in plasma studies field. Like all cellulosic materials, cotton fibers contain hydroxyl groups (-OH). This group determines the chemical properties of cotton fiber[14]. By plasma treatment new functional groups created on surface of the fiber which can be considerable changes in fiber properties [15]. X-ray photoelectron spectroscopy or XPS [16] has shown that plasma treatment with oxygen gas caused carbonyl and carboxylic groups and some crosslinking [17] on textile surface.
Argon plasma treatment causes to surface oxidation of fibers. The free radicals on the samples, have very good potential to react with the atmosphere species. [18, 19]. Argon and oxygen plasmas, improves water absorption and soil releasing, fast drying, staining and wrinkle-resistant of cotton fabrics significantly [20-23].
By using Plasma of fluorinated gases such as Tetrafluoromethane (CF4) or Hexafluoropropylene (C3F6), it is possible to change the hydrophilic nature of cotton fabric to hydrophobic properties. In addition, Tetrafluoromethane produces more fluorine atoms that can stimulate the fluoropolymer and sediment. Also Sulfur hexafluoride (SF6) plasma tends the cotton fabrics to be more hydrophobic. [24-26].
Abdel-Halim has been studied on surface characteristics of pretreated flax fibers. Semi-retted and retted flax fibers scoured and bleached conventionally. Flax fibers had negative zeta-potential [6].
Anionic dyes such as direct and reactive dyes need electrolyte (NaCl and Na2SO4) to neutralize the negatively charged surface of cotton fiber to exhaustion increased. Increasing the concentration of the electrolyte has a dual role [7, 27, 28], neutralize the fiber surface charge and reduces color solubility[7]. As result the low absorption and exhaustion was occurred. Plasma is one of the newest surface modification techniques which are widely used in the textile industry and can useful for this defect [29, 30].
Materials and Methods
Materials
100% cotton woven fabric with weight of (240 g/m2) was used in this study. Fabric was weaved by 210 denier warp (63 end/in) and weft yarns composed of 50 picks/in with fineness of 610 denier was supplied by Yazd Baft Co in Iran. GMT2500 nonionic detergent (Iranian Industrial group), H2O2 35% (Merck, GMBH), NaOH (Merck, GMBH), H2O2 Stabilizer were used for pre-processing treatment. Direct Red 23 (Fig.1) in Azo Class was supplied by Sigma-Aldrich and has been used as a direct dye for dyeing cotton fabric. Washing fastness is equal 2 according to ISO standard test method.
![Figure 1: Molecular structure of Direct Red 23 [31]](http://www.orientjchem.org/wp-content/uploads/2018/02/Vol34No1_Eff_Ham_fig1-150x150.jpg) |
Figure 1: Molecular structure of Direct Red 23 [31] Click here to View figure |
Pre-processing Treatment
Before plasma treatment, cotton row fabrics were washed and bleached. In washing process GMT2500 nonionic detergent with the commercial name has been used. The washing procedure is shown in Table 1.
Table 1: Conditions and materials for washing process of fabrics.
| GMT2500 nonionic detergent | 2 mg/L |
| Temperature | Boiling |
| Time | 30 minutes |
| L: R | 1:20 |
After washing, bleaching process was done according to Table 2. After bleaching process, samples were washed with cold-hot-cold water and dried in room temperature.
Table 2: Conditions and materials for bleaching process of fabrics
| H2O2 35% | 6 mL/L |
| NaOH | 1.25 g/L |
| H2O2 Stabilizer | 1.5 mL/L |
| Wetting Agent | 1 mL/L |
| Temperature | 90˚C |
| Time | 30 minutes |
| L: R | 1:10 |
Plasma Treatment
For plasma treatment, the DC device has been used to create plasma at low pressure. Plasma reactor tank is made of Pyrex and has three valves. The lower valve of connecting reactor were based on device and connector rod of electrodes, the upper valve was connecting to device’s door and the small middle valve connect to the tank with vacuum pumps. In this method, Aluminum electrodes due to low propagation velocity were used.
For reducing the pressure to 2×10⁻³ Torr, diffusion and rotary pump were used. Then the nitrogen gas was input and pressure reached to 5×10⁻²Torr. Magnetic field current (IB) is 3 A and plasma current (Ip) is set to 200 mA. Gases used in all experiments were chosen 99.9% purity. Time of plasma treatment were chosen 3, 6, 9 and 12 minutes on the cotton fabric sample, with the code A, B, C, D, respectively, and untreated or control sample coded as N. Coding of samples has been done according to Table 3.
Table 3: Samples coding of plasma treated and untreated fabrics
| Code | Treatment |
| N | No Plasma treatment |
| A | 3 minutes plasma treatment |
| B | 6 minutes plasma treatment |
| C | 9 minutes plasma treatment |
| D | 12 minutes plasma treatment |
Dyeing Procedures
Both untreated and plasma treated samples, were dyed by Direct Red 23 according to figures 2 and 3. In this research, two recipes for cotton dyeing were used, which the first recipe sodium chloride (NaCl) and in another one, no salt have been used.
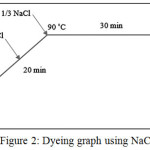 |
Figure 2: Dyeing graph using NaCl Click here to View figure |
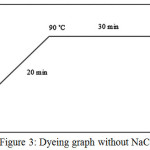 |
Figure 3: Dyeing graph without NaCl Click here to View figure |
Analytical Procedures
The zeta-potential was measured by using the commercial Microtrac, Zeta-Check, Particle Metrix, and Germany. The measurement was done in a distilled water in pH=6.8, temperature 24℃ and equilibrated samples cell by vibrator for 48 hours. The amount of cotton in distilled water was 0.2% (w/w) and the measurement were repeated in 4 times.
For investigating the morphological properties, firstly the samples were coated with gold using sputter coater (BIORAD model E5200). After that, scanning electron microscopy (TESCAN model Vega II) was used in this article. To investigate the effect of plasma on crystalline structure of cotton, X-Ray Diffraction (XRD, Siemens, D5000, and Germany) was used.
The FTIR spectroscopy laboratory model EQUINOX was used for investigating of chemical changes of samples after plasma treatment. Here, test method was performed according to the ASTM E1252-07 at temperature of 23 ± 1 ºC.
Spectrophotometer devices in the textile industry predominantly were used for color matching. In this paper DataColor, America, for measuring color strength and yellowness index was used. Standard situation for DataColor is shown in Table 4.
Table 4: Standard situation for color strength and yellowness index measurement
| Color space | Illuminance | WL (nm) | Obs | Mode | Spectro |
| CIELAB(1976) | D65 | INT | 10 Deg | Reflectance | COLOR GUIDE |
Without any doubt the most important group of objects in the formulation of color are opaque objects. The general approach in the formulation of colors for transparent samples are more complicated. Computational methods are used almost everywhere it is known as the theory of Kubelka-Monk [32]. If diffusion coefficient (S) or layer thickness (X) is gradually increasing, the equation 1 was written [33]:
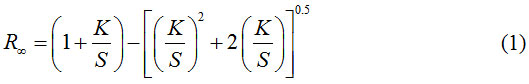
So that R represents the reflected amount in the film that is extremely thick, this actually refers to layers that further increase the thickness has no effect on reflection. If solving this equation for K/S, get the equation 2 as below [32, 33]:
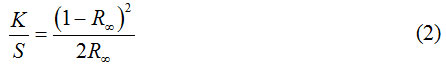
The equation in the references known as the Kubelka-Monk equation and therefore K/S value shows the color strength.
Results and Discussion
Weight Lost after Plasma Treatment
As described above, plasma treatment on cotton fabric was carried out for four different times on the same conditions. Figure 4 shows fabric weight loss on plasma treatment with different time. As shown, with increasing duration of operation the weight lost increased. Weight loss in this study shows a variation of between 0.5% – 1.2%. However, with increasing time treatment, weight loss is linearly increased. All data were analyzed with statistical analysis at 5% probability level. Based on statistical results, the increase coefficient here is linearly and equal to 0.09, details of linear model presented in Table 5. One of the important aspects of plasma treatment is the effect of ion and electron bombardment. In fact, the active parts of the plasma carry a high kinetic energy. This energy reacts with saturated and unsaturated organic compounds on polymer surfaces. The active parts of the plasma lose energy to strike surface. Therefore, the penetration of the active parts of plasma into substance limited to surface[34]. Due to ionic bombardment, the part with less bonding energy and atoms close to this, was removed from the surface. Therefore, sputtering and etching can reduce the weight of the sample. Weight loss initially starts from amorphous areas and, if enough energy is available, then the crystalline areas of cotton will degradation. SEM results show surface sputtering and etching and it will be discussed in next section.
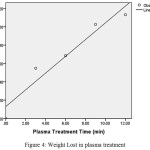 |
Figure 4: Weight Lost in plasma treatment Click here to View figure |
Table 5: Coefficients of weight lost fabric after plasma treatment for linear model
| Model | Unstandardized Coefficients | Standardized Coefficients | t | Sig. | |
| B | Std. Error | Beta | |||
| (Constant) | .130 | .102 | – | 1.274 | .292 |
| Plasma Time | .091 | .014 | .967 | 6.597 | .007 |
| Dependent Variable: Weight Lost | |||||
Other studies show that plasma treatments reduce weight in cotton fibers between 1%-6% [35] and 0.5% [36], grey cotton between 1.5%-4% [37] and for other fibers such as silk after nitrogen plasma treatment between 9%-21% [38]. Same condition happens for synthetic polymers like polyethylene [39], polypropylene [19], and PET films [40].
Scanning Electron Microscopy
The results of the weight loss of the cotton fabric because of surface degradation and etching as a mentioned above are also confirmed by the results of SEM images. In Fig.5 was shown the morphological changes after plasma treatment due to etching. Morphological properties was illustrated in Figs 5a-5e. As shown in Figs 5b-5e, with increment in time treatment, surface degradation increased. The effects of plasma treatments on surface degradation of other fibers have been shown in various studies such as Mirjalili et al [41] and Karahan et al [42]. Fig.5a shows untreated fiber and fig.5b show plasma treated fabric after 3 minutes, these SEM images confirm that plasma cause to destroyed surface. Also, the effect of increasing of time of plasma treatment on increasing the surface degradation and roughness were studied in Karthik et al [43], the effect of other parameters such as nozzle distance and nozzle velocity have been studied in Man et al [44] and Sun et al [45]. Figures 5b to 5e show increase in time of plasma treatment cause to destroyed surface and etching.
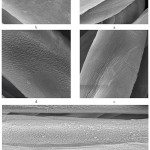 |
Figure 5: SEM images for a- untreated fabric and plasma treated fabric for b- 3 minutes c- 6 minutes d- 9 minutes and e- 12 minutes Click here to View figure |
The point to consider here is the mechanism of the etching and the change of surface morphology in plasma treatment. Many studies had shown that amorphous areas and parts of low binding energy are initially destroyed and etching occur in these parts [34, 35]. Change in crystallinity degree after plasma treatment not only happen in cotton fabric but also had shown in other polymers such as silk [38], polyethylene [46] and PET [40]. In fact, surface crystallinity increased after plasma treatment. XRD used for explaining this situation and will discuss later.
Zeta Potential
Theoretical treatment on electrical double layer is complicated and several models proposed. Surface nature, presence of absorbance layer, solvent and nature of electrolyte affected on these systems. First model proposed by Helmholtz based on double layer or compact layer. In Chapman and Gony model ions in the solution and near the surface are not compact and moveable. In this model diffuse double layer was proposed and ion distribution accorded by Boltzmann distribution [47]. Stern proposed a model based on hybrid of these two models, double layer composed of a contact layer and a diffuse layer. In the diffuse layer exist a hypothetical boundary that called hydrodynamic shear plane. In this boundary ions and surface charged create stable phase and kinetic entity. If solid surface moved, ions in this boundary moved, ions beyond this boundary stationary and belong to bulk solution. Electrical potential in this shear plane called electro kinetic potential or zeta potential, aka ζ potential [47, 48]. Zeta potential affected by surface functional groups, ion sorption, hydrophilicity/hydrophobicity, electrolyte concentration and valency of ions in electrolyte [8, 47-50].
Fig.6 shows zeta potential before and after nitrogen plasma treatment for white and dyed cotton fabric. Here zeta potential is negative, zeta potential of textile fiber mostly is negative [47]. Zeta potential for white and untreated cotton in distilled water is -53 mV, other research reports -28 mV in distilled water [51]. This difference arises from cotton surfaces properties, washing and bleaching treatment [52]. Here, Plasma treatment can change in zeta potential. After plasma treatment zeta, potential of fibers and polymers such as carbon [53], polyamide (nylon 6) [54], polypropylene [39], wool [55], polyester [50], cotton [56] was changed. Nitrogen plasma treatment reduced negativity of the surface. Increasing treatment time from 3 to 9 minutes, caused to zeta potential of cotton fabric to more positive. Created functional groups containing –N made positive zeta potential. this situation observed in wool at acidic condition and nylon fibers [57] after NH3 plasma treatment. Increment in time of plasma treatment had inverse effect because of surface degradation and removed functional groups containing nitrogen.
Red curve in fig 6 shows zeta potential of dyed cotton fabric. Here, Direct Red 24 made the surface more negative. Sulfonate and sulfate groups in anionic dyes like direct dye ionized in aqueous solution and increased negative charged on the solid surfaces [58]. As shown in Fig.1, two groups on dye structure made more negative surface. Therefore, Anionic dyes increased absolute zeta potential of cotton fabric and made it more negative.
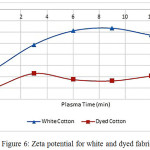 |
Figure 6: Zeta potential for white and dyed fabric Click here to View figure |
For better comparison of results, here, zeta potential of dyed fabric was compared to undyed cotton fabric, called Relative Zeta Potential or RelZP. This ratio calculated according to Eq 3.

Where, RelZP, show variation ratio in zeta potential of dyed and undyed cotton. RelZP results are positive. Fig7 shows relative zeta potential value increased in cotton fabric until 9 minutes treatment. Plasma treatment facilitated availability of functional groups at the surface in the solution [54] and after N2 plasma treatment adsorption anionic particles to the cotton fabric increase [56]. According to Fig.6, zeta potential of samples after plasma treatment were more positive, and direct dye particle had negative zeta potential in the solution, then, increased adsorption to the solid surface, in fact dye uptake increased. Incrementing in dye uptake cause increase the RelZP. Increasing in time of plasma treatment to 12 minutes had inverse effect on RelZP like Fig 6.
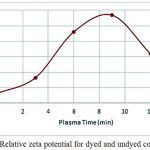 |
Figure 7: Relative zeta potential for dyed and undyed cotton fabric Click here to View figure |
X-Ray Diffraction
X-Ray Diffraction method has been used to show the changes in crystal orientation and percentage of cotton. Cotton fiber composed of two parts called crystal and amorphous regions [59], which makes it clear that the accessibility of functional groups in amorphous region are more than crystalline [40, 46]. Plasma treatment, at first, destroyed amorphous region on the surface, therefore, crystal density increased in surfaces [35, 40, 46]. Crystallinity of treated and untreated sample were shown in Fig.8a. As shown crystal orientation after plasma treatment not changed, but crystal intensity increased. The results of crystal intensity (%) are shown in Table 6. Table 6 confirmed that crystal orientation not changed after plasma treatment, but after plasma treatment crystal density increased, Fig.8b displayed crystallinity between 12.8°-15.8°. Oriented crystals in 25.7° removed in A-D samples means crystal destroyed in plasma treatment (Fig.8c). Inbakumar and et al, prove that if plasma condition had enough energy can decrease crystals density in silk and wool [60]. Here crystal intensity is small for 25.7° and removed with amorphous region.
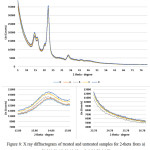 |
Figure 8: X ray diffractogram of treated and untreated samples for 2-theta from a) 5°-80°, b) 12.8°-13.8° and c) 23.7°-26.7° Click here to View figure |
Table 6: Crystal intensity (%) extracted from XRD in samples according to orientation
| Angle | Intensity % | ||||
| 2-Theta ° | N | A | B | C | D |
| 14.6 | 29.2 | 29.3 | 29.9 | 30 | 30.3 |
| 16.4 | 22.7 | 22.6 | 22.8 | 23.8 | 23.1 |
| 20.4 | 15.4 | 15.4 | 16.2 | 16.6 | 17 |
| 22.6 | 100 | 100 | 100 | 100 | 100 |
| 25.7 | 1.5 | 0 | 0 | 0 | 0 |
| 33.9 | 8.2 | 8.2 | 9 | 9.2 | 9.6 |
| 34.4 | 10.1 | 10.1 | 10.2 | 9.7 | 10.4 |
FTIR Spectra
Plasma, including radicals, ions, electrons, and other excited parts. This can react physically and chemically with other parts of the fabric to a depth of ten nanometers because of high reactivity. As a result, new functional groups on the surface are created, or as a result of the destruction, some functional groups are destroyed [61]. FTIR used to show which functional groups added or removed from the surface after treatment such as plasma. Fig.9 shows spectra of treated and untreated of cotton fabrics. N2 plasma treatment on cotton was created new functional groups ( , NH and NH2). Peak in 1544 (cm-1) that is for N-H bending other researches have report same results, NH and OH have same peaks in 3400 (cm-1) and overlap occur [56, 62]. is responsible for peak 2344 (cm-1) and important result occurs in this peak, it’s not in untreated fabric and created after plasma treatment [56], and with increased time of treatment this peak decreased. It means that by increasing of time of plasma will be decreased nitrogen content of surface. Results of zeta potential proved that increased time of treatment after 9 minutes decrease nitrogen and negative zeta potential increased. Junkar et al proposed that after a given time of N2 and O2 plasma treatment, surfaces reach to saturated condition and increment time have a mirror effect on increase of surface functional groups [63]. Tušek et al proved that increased in NH3 plasma treatment after a given time reduced the nitrogen content of the surfaces by etching and physical degradation of surface [54]. Increased in RF[1] power have the same result on decrease of the nitrogen content, nitrogen content after N2 and NH3 plasma treatment with increased in RF power decreased on polyethylene and polyimide due to the resputtering and metal adhesive [64]. An increase in RF Power can cause the disappearance of O-C=NH and O-C=O on cotton due to surface degradation [61].
As results, functional groups such as (2344(cm-1)), NH2 and NH (1542(cm-1)) created on the surface after nitrogen plasma treatment and with increase time of treatment more than 9 minutes functional
group – C = N decreased.
decreased.
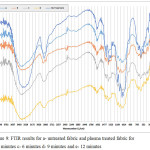 |
Figure 9: FTIR results for a- untreated fabric and plasma treated fabric for b- 3 minutes c- 6 minutes d- 9 minutes and e-12 minutes Click here to View figure |
Dyeability
As mentioned in experimental parts, samples treated with plasma and then dyed with Direct Red 23. Figures 10 and 11 show the results of K/S for dyeing untreated and plasma treated samples with and without salt, respectively. Sample A had more negative surface than samples B and C therefor, dye uptake is lower.
Figure 10 shows that sample C had the highest K/S and Figure 11 shows that the sample C is better than others. Results of K/S on samples B and C is relatively similar, proved that the results of the zeta potential and FTIR. Samples B and C have near and small negative zeta potential means that these samples have more positive surfaces than others. Therefore, dye adsorb to cationic surfaces.
Dye uptake in samples in present of NaCl and without NaCl have the similar behavior but in without salt is fewer K/S. This means that cotton fibers had a little negative and this can repulsive dye from the surfaces. Salt addition to dye bath reduced remain negative zeta potential even after nitrogen plasma and cause to increase K/S. This confirm zeta potential results.
Roughness increased contact surface of dye and fibers, therefore, dye uptake increased in treated fabrics. K/S in samples A and D is similar sample N. lower dye uptake is for less hydrophilicity of surface. If roughness was under 100 nm had no effect on contact angle [65]. SEM show samples A smoother than other samples. In sample D more negative zeta potential, and increase time of plasma treatment after a given time destroyed surface and eliminating functional groups, these situation increase contact angle [54] therefore, reduced dye uptake.
Another important factor that effect on K/S (not dye uptake), is yellowness of cotton fabric after plasma treatment [66]. Here, yellowness of fabric change with plasma treatment as: sample C > sample B > sample D > sample A > sample N. Ghoranneviss et al, reports that plasma treatment after dyeing make color darker because of yellowness in red color [66]. Here K/S value is not change just with yellowness of fabric, because of RelZP sample C more than dyed samples D, this confirmed that sample C more absorbed dye and had more negative zeta potential.
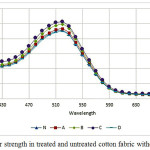 |
Figure 10: Color strength in treated and untreated cotton fabric without NaCl Click here to View figure |
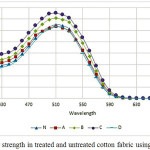 |
Figure 11: Color strength in treated and untreated cotton fabric using NaCl Click here to View figure |
Conclusion
Plasma treatment on the surface properties of materials such as textiles can be useful and without affecting characteristics such as bulk. The depth of surface treatment is less than 100 nm. Surface modification of textiles using plasma treatment affected various factors such as the type of gas, woven, electric power and electric power frequency, temperature and duration of the operation.
Here the effect of plasma treatment and dyeing on zeta potential of cotton fabric was investigated. The effect of plasma treatment and the zeta potential was determined based on dye sorption of cotton fabric. FTIR results indicate that C-N bonds created on cotton fabrics. Increased operating time caused further destroyed on functional groups of cotton fabric. Plasma treatment caused to changing in crystal density and increased crystallinity of surface. Nitrogen plasma treatment changed zeta potential near to positive. This change of zeta potential cause to absorbed dye to surfaces of fiber and consequently increased dye uptake. Direct dye makes more negative zeta potential of surfaces and with increase in dye uptake, relative zeta potential increased, therefore, increased in negative zeta potential means that direct dye adsorption increased. Change in K/S of dyed fabric after plasma treatment affect by, surface roughness, change in yellowness index, zeta potential and contact surface. All of these factors should be on optimal situations.
Acknowledgement
The authors are grateful for the support from Islamic Azad University and Zarif Mosavar Industrial Group.
References
- Shishoo R. Elsevier; 2007.
- Sigurdsson S, Shishoo R. Journal of Applied Polymer Science. 1997; 66(8):1591-601.
CrossRef - Wei Q. Elsevier; 2009.
- Öktem T, Ayhan H, Seventekin N, Piskin E. Coloration Technology. 1999;115(9):274-9.
CrossRef - Sarmadi AM, Kwon YA. Textile Chemist & Colorist. 1993;25(12).
- Abdel-Halim E. Carbohydrate polymers. 2012;88(4):1201-7.
CrossRef - Bashar MM, Khan MA. Journal of Polymers and the Environment. 2013;21(1):181-90.
CrossRef - Reischl M, Stana‐Kleinschek K, Ribitsch V, Macromolecular Symposia; 2006: Wiley Online Library.
- Rabe M, Greifeneder K, Truckenmueller K, Petasch W. Melliand Textilberichte International Textile Reports. 1994;75:E 133-E
- Karahan H, Özdoğan E. Fibers and Polymers. 2008;9(1):21-6.
CrossRef - Rossnagel S. Journal of Vacuum Science & Technology A. 2003;21(5):S74-S87.
- Felts JT, Lopata ES. Plasma thin film deposition process. Google Patents; 1989.
- Chrisey DB, Hubler GK. 1994.
- Wakelyn PJ, Bertoniere NR, French AD, Rousselle Jr WRG, Edwards JV, Hunter L, et al. 1998.
- Denes F, Young RA, Sarmadi M. Journal of Photopolymer Science and Technology. 1997;10(1):91-112.
CrossRef - Crist BV. XPS International; 1999.
- Daintith J. OUP Oxford; 2008.
- Sabharwal HS, Denes F, Nielsen L, Young RA. Journal of agricultural and food chemistry. 1993;41(11):2202-7.
CrossRef - France R, Short R. Journal of the Chemical Society, Faraday Transactions. 1997;93(17):3173-8.
CrossRef - Denes F, Young R. Science and Technology of Polymers and Advanced Materials: Springer; 1998. p. 763-79.
CrossRef - Hua Z, Sitaru R, Denes F, Young R. Plasmas and Polymers. 1997;2(3):199-224.
CrossRef - McCord M, Hwang Y, Qiu Y, Hughes L, Bourham M. Journal of applied polymer science. 2003;88(8):2038-47.
CrossRef - Özdogan E, Saber R, Ayhan H. Coloration technology. 2002;118(3):100-3.
CrossRef - Vohrer U, Müller M, Oehr C. Surface and Coatings Technology. 1998;98(1):1128-31.
- Jahagirdar C, Tiwari L. Journal of Applied Polymer Science. 2004;94(5):2014-21.
CrossRef - Thorsen WJ. Textile Research Journal. 1971;41(4):331-6.
CrossRef - Taylor JA. Review of Progress in Coloration and Related Topics. 2000;30(1):93-108.
CrossRef - Hauser PJ, Tabba AH. Coloration Technology. 2001;117(5):282-8.
CrossRef - Schlaeppi F. Text Chem Color. 1998;30(4):19-26.
- Lewis D, Lei X. Journal of the Society of Dyers and Colourists. 1991;107(3):102-9.
CrossRef - Lucilha AC, Bonancêa CE, Barreto WJ, Takashima K. Spectrochimica Acta Part A: Molecular and Biomolecular Spectroscopy. 2010;75(1):389-93.
CrossRef - Gordon S, Hsieh Y-l. Woodhead Publishing; 2006.
- Semmelroth CC. JOSA. 1970;60(12):1685-9.
CrossRef - Kan C-w. CRC Press; 2014.
- Bhat N, Netravali A, Gore A, Sathianarayanan M, Arolkar G, Deshmukh R. Textile Research Journal. 2011;81(10):1014-26.
CrossRef - Nithya E, Radhai R, Rajendran R, Shalini S, Rajendran V, Jayakumar S. Carbohydrate polymers. 2011;83(4):1652-8.
CrossRef - Wang L, Xiang Z-Q, Bai Y-L, Long J-J. Journal of cleaner production. 2013;54:323-31.
CrossRef - Bhat N, Nadiger G. Textile research journal. 1978;48(12):685-91.
CrossRef - Lehocký M, Drnovská H, Lapčı́ková B, Barros-Timmons A, Trindade T, Zembala M, Lapcik L.Colloids and Surfaces A: Physicochemical and Engineering Aspects. 2003;222(1):125-31.
CrossRef - Pandiyaraj KN, Selvarajan V, Deshmukh R, Bousmina M. Surface and Coatings Technology. 2008;202(17):4218-26.
CrossRef - Mirjalili M, Karimi L. Journal of The Textile Institute. 2013;104(1):98-107.
CrossRef - Karahan H, Esen Ö, Aydin H, Seventekin N. Issues. 2017.
- Karthik T, Murugan R, Vijayan M. Journal of the Textile Institute. 2013;104(5):481-93.
CrossRef - Man W, Kan C, Ng S. Vacuum. 2014;99:7-11.
CrossRef - Sun ,S.; Sun ,J.; Yao ,L.; Qiu ,Y.; Applied Surface Science. 2011;257(6):2377-2382.
CrossRef - Kim KS, Ryu CM, Park CS, Sur GS, Park CE. Polymer. 2003;44(20):6287-95.
CrossRef - Burkinshaw SM. John Wiley & Sons; 2016.
- Rouette H-K, Schwager B. Springer Germany; 2001.
- Pothan LA, Bellman C, Kailas L, Thomas S. Journal of adhesion science and technology. 2002;16(2):157-78.
CrossRef - Guo L, Campagne C, Perwuelz A, Leroux F. Textile Research Journal. 2009;79(15):1371-7.
CrossRef - Jacobasch H-J, Bauböck G, Schurz J. Colloid & Polymer Science. 1985;263(1):3-24.
CrossRef - Kumar AR, Teli M. Colloids and Surfaces A: Physicochemical and Engineering Aspects. 2007;301(1):462-8.
CrossRef - Garcı́a AB, Cuesta A, Montes-Morán MA, Martı́nez-Alonso A, Tascón JM. Journal of colloid and interface science. 1997;192(2):363-7.
CrossRef - Tušek L, Nitschke M, Werner C, Stana-Kleinschek K, Ribitsch V. Colloids and Surfaces A: Physicochemical and Engineering Aspects. 2001;195(1):81-95.
CrossRef - Wakida T, Lee M, Sato Y, Ogasawara S, Ge Y, Niu S. Coloration Technology. 1996;112(9):233-6.
- Rashidi A, Shahidi S, Ghoranneviss M, Dalalsharifi S, Wiener J. Plasma Science and Technology. 2013;15(5):455.
CrossRef - Grancaric AM, Tarbuk A, Pusic T. Coloration Technology. 2005;121(4):221-7.
CrossRef - Giménez-Martín E, Ontiveros-Ortega A, Espinosa-Jiménez M. Improvement in Acrylic Fibres Dyeing. Textile Dyeing: InTech; 2011.
- Zhbankov RG. Springer; 2013.
- Inbakumar S, Kaliani A, A, editors. Effect of plasma treatment on surface of protein fabrics. Journal of Physics: Conference Series; 2010: IOP Publishing.
- Pransilp P, Pruettiphap M, Bhanthumnavin W, Paosawatyanyong B, Kiatkamjornwong S. Applied Surface Science. 2016;364:208-20.
CrossRef - Kan C-W. International Journal of Chemical Engineering and Applications. 2015;6(6):432.
CrossRef - Junkar I, Vesel A, Cvelbar U, Mozetič M, Strnad S. Vacuum. 2009;84(1):83-5.
CrossRef - Klemberg‐Sapieha J, Küttel O, Martinu L, Wertheimer M. Journal of Vacuum Science & Technology A: Vacuum, Surfaces, and Films. 1991;9(6):2975-81.
CrossRef - Busscher H, Van Pelt A, De Boer P, De Jong H, Arends J. Colloids and Surfaces. 1984;9(4):319-31.
CrossRef - Ghoranneviss M, Shahidi S. The Journal of The Textile Institute. 2017;108(3):445-8.
CrossRef

This work is licensed under a Creative Commons Attribution-NonCommercial-ShareAlike 4.0 International License.

This work is licensed under a Creative Commons Attribution 4.0 International License.
![]()
A New Edition of Web of Science
Journal Impact Factor
2022: 0.5
Five Year: 0.8
Journal is Indexed in

Cabells Whitelist
![]()


