Development and Validation of Stability-Indicating Ultra High-Performance Liquid Chromatography for Ramipril Analysis in Pharmaceutical Dosage Forms and its Application in Lipid-based Formulations
Khalid Faisal Alhasani1, Kazi Mohsin1 , Faiyaz Shakeel1, 2 and Fars Kaed Alanazi1
1Kayyali Chair for Pharmaceutical Industries, College of Pharmacy, King Saud University, Riyadh, Saudi Arabia.
2Center of Excellence in Biotechnology Research, King Saud University, Riyadh, Saudi Arabia.
Corresponding Author E-mail: mkazi@ksu.edu.sa
DOI : http://dx.doi.org/10.13005/ojc/340107
The current study evaluates the ultra high performance liquid chromatography (UHPLC) method for the quantification of Ramipril in lipid-based formulations. A reliable, highly precise, more specific and reproducible reversed phase UHPLC method has been developed and validated according to the regulatory guidelines, which was composed of isocratic mobile phase; acetonitrile and 0.25% formic acid solution in ratio of (40:60 %V/V) with a flow rate of 0.2 mL/min, and C18 column (2.1×50mm, 1.7 µm). The detection was carried out at 210 nm. The developed UHPLC method was found to be rapid (3 min run time), selective with high resolution of Ramipril peak (1.4 min) from different lipid matrices and highly sensitive (Limit of Detection and Lower Limit of Quantification were 0.034 µg/mL and 0.199 µg/mL, respectively). The linearity, accuracy and precision were determined as acceptable over the concentration range of 1 - 200 µg/mL for Ramipril. The results showed that the proposed UHPLC method can be used for the estimation of Ramipril in lipid-based formulation by indicating its purity and stability with no interference of excipients or related substances of active pharmaceutical ingredient.
KEYWORDS:Ramipril; UHPLC Systems; Lipid Based Formulation; Method Validation
Download this article as:| Copy the following to cite this article: Alhasani K. F, Mohsin K, Shakeel F, Alanazi F. K. Development and Validation of Stability-Indicating Ultra High-Performance Liquid Chromatography for Ramipril Analysis in Pharmaceutical Dosage Forms and its Application in Lipid-based Formulations. Orient J Chem 2018;34(1). |
| Copy the following to cite this URL: Alhasani K. F, Mohsin K, Shakeel F, Alanazi F. K. Development and Validation of Stability-Indicating Ultra High-Performance Liquid Chromatography for Ramipril Analysis in Pharmaceutical Dosage Forms and its Application in Lipid-based Formulations. Orient J Chem 2018;34(1). Available from: http://www.orientjchem.org/?p=41534 |
Introduction
Ramipril (RMP) is (Fig1) chemically named as 2-[N-[(S)-1-ethoxycarbonyl-3-phenylpropyl] – L – alanyl] – (1S, 3S, 5S) – 2 – azabicyclo[3,3,0]-octane-3-carboxylic acid [1]. It is classified as angiotensin converting enzyme inhibitor (ACE) [2, 3]. It is mainly used for the treatment of hypertension and heart failure [4]. The doses of RMP for these indications range is between 2.5 – 20 mg daily as the patients require well tolerated low doses [5]. RMP is orally active but not giving the pharmaceutical activity unless goes after metabolism by the liver to produce its active moiety, ramiprilate [6, 7].
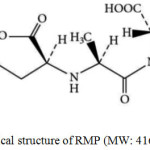 |
Figure 1: Chemical structure of RMP (MW: 416.511, PKa: 3.17). Click here to View figure |
RMP is classified as Class II in Biopharmaceutical Classification System (BCS) which is presented by Amidon in 1995. RMP is considered as poorly bio-available because it has low water solubility but highly permeable through GIT barriers which gives a bioavailability of 28.35%. Partition coefficient (log p) of RMP is 3.41 and its pka is 3.17. RMP is a highly challenging compound which poses stability problems in acidic and alkaline media and it is sensitive to heat, moisture and mechanical stress [8-10].
Many studies have been published previously to analyze RMP using conventional method in pharmaceutical dosage forms. In 2005, Nafisur Rahman et al. published a kinetic spectrophotometric analysis method using color reaction. The method was based on the reaction of carboxylic group of RMP with a mixture of iodide-iodate in aqueous medium resulting in the formation of yellow color, which absorbs maximally at 352 nm. In 2007, Hisham Abdullatef investigated the detection of RMP by different spectrophotometric and spectrofluorometric methods by oxidation of RMP with 1-chlorobenzotriazole (CBT) to be measurable at absorbance of 350 nm [11]. Another method was done by formation of ternary complex of Copper II, eosin and RMP with surfactant to be detected at absorbance of 543 nm. These methods were able to detect a range of 20 to 80 µg/mL. In 2010, M. De Diego et al. worked in liquid chromatography analysis combined with stress conditions analysis, succeeded to detect RMP as stability indicating method.
However, the procedures used for method development in most of the papers are laborious and time consuming and/or covering only narrow concertation ranges. The aim of this work is to develop and validate a rapid, simple, accurate, precise, economic, stability indicating and wide concentration detectable range method to detect RMP in pharmaceutical dosage forms with the application of lipid based formulation.
Experimental
Materials
Ramipril was obtained as a kind gift sample from Zydus Cadila Healthcare Ltd. (Ahmedabad, Gujrat, India). HPLC grade Acetonitrile, Hydrochloric acid and Formic acid were purchased from BDH laboratory supplies (BDH Chemicals Ltd., Poole, UK). orthophosphoric acid has been purchased from (Avonchem, Cheshire, UK). Oils used are Miglyol 812 (M812: Medium chain triglycerides (72% C8 and 27.5% C10) and Imwitor 988 (I988 Caprylic / Capric Glycerides) are supplied by (Sasol GmbH, Witten, Germany and Cremer Oleo GmbH & Co. KG. Hamburg, Germany) respectively. The high purity Milli-Q water was obtained through a Milli-Q Integral Water Purification System (Millipore, Bedford, MA). Ramipril 2.5 mg tablet Sandos® was used as marketed drug. Hydrogen peroxide solution was obtained from (S.G.H Harborough, England) and sodium hydroxide from (Merck, Germany), respectively. All other reagents were of analytical grade and used without further purification.
Methods
UHPLC Chromatographic Conditions
Development and optimization of chromatographic separation was done with respect to the compositions of mobile and stationary phases, column temperature, flow-rate, sample volume, and detection wavelength. The work within the scope used a highly sensitive UHPLC system that composed of a Dionex ® UHPLC binary solvent manager equipped with a Dionex ® automatic sample manager and a Photodiode Array (PDA) eλ detector by Thermo scientific, Bedford, MA, USA. The mobile phase was an isocratic mixture of HPLC-grade Acetonitrile and 0.25% formic acid aqueous solution in a ratio of (40:60 %v/v). The flow rate was 0.2 mL/min, connected through an Acquity ® UPLC BEH C18 column (2.1×50mm, 1.7 µm) with temperature of 50ºC. The total run time was extended to 3 min, whereas the RMP eluted at 1.4 min only. Freshly prepared mobile phase was filtered through an online 0.20 µm filter and degassed continuously by an online degasser within the UHPLC system. The detector wavelength was set at 210 nm and the injection volume was 2.0 µl. The solvent for sample dilution was prepared by mixture of acetonitrile and (3%v/v orthophosphoric aqueous solution) with a ratio of 2:3.
Preparation of Stock Solution; Calibration Standards and QC Samples
Preparation of calibration standards, quality control (QC) samples and stock solution of RMP were prepared in the designated solvent (orthophosphoric acid & ACN mix) at a concertation of 1 mg/mL. The stock solutions were consecutively diluted with the solvent to prepare working solutions just before use. RMP standards were prepared by diluting of 125, 250, 625, 1250, 2500 and 5000 µl RMP working standard stock solution by 25 mL solvent in volumetric flask to obtain six-point calibration concentrations of 5-200 µg/mL (ppm). 10 µg/mL solution diluted by 10 times to produce lower concentration of 1 µg/mL This procedure made concentrations of 1, 5, 10, 25, 50, 100, 200 µg/mL (ppm). Calibration curves were obtained by plotting peak area against standard drug concentration and regression equations were computed thereby. Four quality control (QC) samples with the selected concentrations of 18, 36, 78 and 140 (µg/mL) ppm were prepared to cover the desired range from the calibration standards. Three tablets from the marketed drug (Ramipril Sandos ® 2.5 mg) dissolved in 25 mL of solvent to assure the potentiality of the method that can be applied to assay RMP in commercial formulations.
Method Validation
The current developed method was validated according to ICH guidelines in terms of linearity, specificity, precision and accuracy, Limit of Detection (LOD) and Lower Limit of Quantification (LLOQ) according to the standard guidelines of bioanalytical method validation [12]. The acceptance criteria of precision and accuracy were evaluated as the relative standard deviation of the mean expressed as a percent (coefficient of variation, CV% determined precision of the method) [13, 14].
Linearity and Range
Appropriate volumes of RMP stock solutions (1 mg/mL) were utilized to prepare seven non-zero standard drug concentrations covering the calibration range of 1 – 200 µg/mL. Four QC samples were prepared by spiking known concentrations of RMP within the detection range of 1 – 200 µg/mL. Each standard solution 1, 5, 10, 25, 50, 100, 200 µg/mL has been injected (n=3) times daily on three consecutive days for validation. In ascending order, calibration solutions were injected in each validation run and the other samples were randomly distributed through the run. Correlation coefficient (R2) and linear regression equation were incorporated to statistically evaluate the linearity of the results, y = mx + b, where; y = response. m = slope. x = concentration, b = intercept.
Specificity
Specificity and sensitivity of the method were evaluated in relation to observe any interference peaks from the different self-emulsifying lipid-based formulations and the peak of the standard solutions. The retention time for both peaks were compared to assure the same time is obtained. In addition, towards the establishment of the method, specificity was also studied by determination of the intact drug in terms of resolution (R) between the drug peak and the nearest degradation product if present.
Accuracy and Precision
From the seven RMP standard solutions, intra-day accuracy and precision studies were performed by using six replicates determinations within the same day. On the other hand, the inter-day accuracy and precision were also assessed by six replicates analysis during the three consecutive days of the following: low and high QC samples. The overall precision of the method was expressed as relative standard deviation (RSD).
Limit of Detection (LOD) and Lower Limit of Quantification (LLOQ)
The LOD and LLOQ were determined efficiently by serial dilutions of the RMP stock solution in order to obtain signal to noise (S/N) ratio of at least ≈ 3:1 for LOD and ≈ 10:1 for LLOQ.
Results and Discussion
UHPLC Peak Separation
The representative chromatographic results of blank solvent (A), drug free self-emulsifying lipid formulation sample (B), RMP standard solution 100 µg/mL (C), RMP containing self-emulsifying lipid formulation sample (D) and the marketed drug sample (E) are shown in Fig. 2. The chromatographic results found from the current UHPLC technique showed that the RMP peaks were clearly separated and ideal without any interference of the excipients used in liquid dosage form. In addition, the chromatograms in the assay confirmed that the sensitivity and selectivity of this procedure was efficient enough to determine RMP within the available excipients used for dosage forms. The RMP analyte was well separated at the retention time of 1.4 min without having any interference of degradation product. The total run time was 3 min, where the peaks were of good shape and completely resolved.
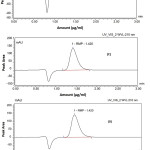 |
Figure 2: UHPLC chromatograms of blank sample (A), drug-free lipid formulation sample (B), standard solution of RMP at concentration 100 ppm (C), and drug-containing lipid formulation sample (D). RMP Sandos ® 2.5 mg (E) Click here to View figure |
Forced Degradation Study
To study the ability of this method to be used as stability indicating method, five different samples of RMP was treated with stress conditions of 0.1N hydrochloric acid, 0.1 N sodium hydroxide solution, 3% hydrogen peroxide solution and exposed to high temperature. The results showed by the degradation study that the amounts of RMP in the samples were decreased in compare to the original concentrations.
Acid Degradation
10 mg of RMP was transferred into a 100 mL round bottom flask and then 10 mL of 1M hydrochloric acid solution was added. The contents of the flask were mixed well and kept for overnight at 60˚C temperature. After cooling the solution at room temperature, 10 mL of 1M sodium hydroxide solution was added in 100mL volumetric flask to neutralize and then diluted to 100mL with solvent. The chromatogram of the acid degradation is shown in Fig 3A.
Basic Degradation
10 mg of RMP was transferred into a 100mL round bottom flask and then10mL of 1M sodium hydroxide solution was added. The contents of the flask were mixed well and kept for overnight at 60˚C temperature. After cooling the solution at room temperature, 10mL of 1M hydrochloric acid solution was added in 100mL volumetric flask to neutralize and then diluted to 100mL with solvent. The result of the basic degradation is shown in Fig 3B.
Oxidation
10 mg of RMP was transferred into a 100mL round bottom flask with the addition of 10mL 3% hydrogen peroxide solution. The contents of the flask were mixed well and kept for overnight at 60˚C temperature. After cooling the solution at room temperature, it was diluted to 100mL with solvent. The chromatogram of the oxidation data is shown in Fig 3C.
Thermal Degradation
10 mg of RMP was transferred into a 100mL round bottom flask, and kept in oven at 120˚C for 24 hr. After cooling the powder at room temperature, the solvent was added up to 100mL. The chromatogram of the thermal degradation study is shown in Fig 3D.
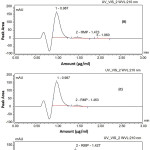 |
Figure 3: Typical UHPLC chromatograms of: (A) acid hydrolysis-degraded RMP, (B) base hydrolysis-degraded RMP, (C) oxidative-degraded RMP, and (D) thermal-degraded RMP. Click here to View figure |
Method Validation
Linearity, Range and Calibration
The peak responses of RMP were linear over the concentration range between 1 and 200 µg/mL. Under the above described experimental conditions, the calibration curve of chromatographic peak area versus RMP concentrations have been shown to be well linear dynamic range (Fig 4). These results showed a perfect linear method over the interval studied with correlation coefficient, RMP (r²) = .99999. Slope, intercept, correlation coefficient (r2), standard deviation of slope and intercept (obtained by the linear least squares treatment of the results) are listed in Table 3. The LOD and LOQ of the method were found to be 0.034 and 0.199, respectively.
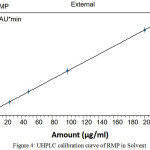 |
Figure 4: UHPLC calibration curve of RMP in Solvent Click here to View figure |
Accuracy and Precision
The intra-day and inter-day accuracy studies was calculated as the percentage of drug recovery after examining six replicates of QC samples at four nominal concentration levels (18, 36, 78 and 140 µg/mL) along with the seven standards. The data shows that the intra-day accuracy was found in between 97.05% and 100.541% and the inter-day accuracy was in between 99.573% and 100.666% (Table 1, 2). The assay of the marketed drug was ideal with presented method as the accuracy was 99.683% of the label content. The overall results from the drug recovery suggest the accuracy of the assay method, which meet all the criteria as per the ICH guidelines.
The values present in (Table 1, 2) Shows the results of intra-day and inter-day precision, respectively. The standard deviation (SD) values from the intra-day results are within the acceptable range, which indicates that the developed method was precise. In addition, within the analytical concentration range of 1 -200 µg/mL, the coefficient of variation (CV; precision) was found to be within 0.010 to 1.262%. The inter-day (Table 1, 2). SD values of six replicate determinations in three consecutive days were within the acceptable range, whereas the % CV was in between the range of 0.024% and 1.262%. These low values of both SD and CV during the intra-day and inter-day analysis suggest the current method as very highly precise.
Table 1: UHPLC data of intra-day back-calculated RMP concentrations of the calibration standards in Solvent
|
Assay Type |
Amount (µg/mL) |
Accuracy (%) |
Precision |
|
|
Added |
Found ±SD |
|||
|
Inter day |
1 |
1.067±0.013 |
106.667 |
1.262 |
|
5 |
5.046±0.005 |
100.913 |
0.093 |
|
|
10 |
10.012±0.015 |
100.122 |
0.152 |
|
|
25 |
24.991±0.003 |
99.965 |
0.01 |
|
|
50 |
49.786±0.071 |
99.573 |
0.143 |
|
|
100 |
99.802±0.102 |
99.802 |
0.102 |
|
|
200 |
200.257±0.049 |
100.128 |
0.024 |
|
|
Intra day |
1 |
0.971±0.002 |
97.05 |
0.218 |
|
5 |
4.987±0.004 |
99.73 |
0.081 |
|
|
10 |
9.927±0.002 |
99.273 |
0.025 |
|
|
25 |
24.965±0.003 |
99.859 |
0.010 |
|
|
50 |
49.826±0.078 |
99.652 |
0.157 |
|
|
100 |
99.964±0.031 |
99.964 |
0.031 |
|
|
200 |
200.093±0.045 |
100.047 |
0.023 |
|
Table 2: UHPLC data of inter-day accuracy and precision of RMP QC samples
|
Assay Type |
Amount (µg/mL) |
Accuracy (%) |
Precision |
|
|
Added |
Found ±SD |
|||
|
QC Samples |
18 |
18.332±0.015 |
101.842 |
0.084 |
|
36 |
36.082±0.016 |
100.227 |
0.044 |
|
|
78 |
78.010±0.005 |
100.012 |
0.007 |
|
|
140 |
141.715±0.878 |
101.225 |
0.62 |
|
|
Marketed Drug (Sandos® 2.5 mg) |
2.5 mg / 25 mL solvent (100 ppm) |
99.683±0.200 |
99.683 |
0.2 |
Specificity
The specificity of the developed UHPLC method was investigated in order to measure the analyte response in the presence of its degradation products. The developed method was found to be specific for RMP without having any possible interference from the degradation product(s). The result from a sample of lipid solubility studies (RMP loaded in lipid formulation) in Fig. 2D shows that there was no degradation product present in the sample containing RMP. It seems that RMP compound can be recovered completely from the lipid formulation (Fig. 2D). In addition, there were no significant interfering peaks present in randomly selected drug free lipid formulation samples at RMP retention time (Fig. 2B), which suggests that RMP compound can be analyzed predominantly from lipid based formulations.
Limit of Detection (LOD) and Lower Limit of Quantification (LLOQ)
The LLOQ value of 0.199 µg/mL in the assay which was estimated to be the lowest concentration in the standard curve that can be measured with acceptable accuracy and precision for the RMP analyte with S/N ratio of (79.7). On the other hand, LOD was 0.034 ppm with S/N ratio of (27.8). Both LLOQ and LOD were experimentally verified by six replicate injections of RMP standard concentrations (Table 3).
Table 3: Statistical data of the regression equation for the determination of RMP obtained from the proposed method.
|
Parameters |
RMP |
|
Concentration range (µg/mL) |
1 -200 |
|
Intercept (a) |
0.0464 |
|
Slope (b) |
1.0005 |
|
Correlation coefficient (r) |
0.99999 |
|
Limit of detection (LOD) |
0.034 |
|
Lower limit of quantification (LLOQ) |
0.199 |
amean of ten measurements
bLimit of detection was estimated at a signal-to-noise ratio of 3
cLimit of quantification was estimated at a signal-to-noise ratio of 10
Suitability of the systems
The system suitability was considered to estimate/settle the performance (parameters) and the highest precision of the systems. The variation (SD) in the peak area from six replicates injections was very minor, which demonstrates the system precision. The results of other chromatographic parameters such as peak tailing and theoretical plate numbers represents column efficiency are represented in Table 4. The overall analysis of the results showed the acceptable/highest performance of the system as the tailing peaks was 1.05 along with the theoretical plates, which were not less than 2000.
Table 4: Systems suitability parameters of RMP
| System suitability parameter | RMP |
| Retention Time | 1.400 min |
| % RSD | 0.054% |
| Peak Tailing | 1.05 |
| Theoretical Plate number | 2829 |
Application
Within the scope of the current research, the developed UHPLC method has been successfully used for the quantification of RMP compound in the studies of equilibrium solubility, tablets assay and dissolution profiles of self-emulsifying lipid-based formulations (SEDDS/SMEDDS).
Conclusion
The developed UHPLC method provides a reliable, highly precise and more specific assay for RMP analysis in pharmaceutical formulations. The described method is sensitive enough to detect as low as 0.034 µg/mL RMP and exclusively offer a rapid determination of RMP (peak at 1.4 min within 3 min run time). No significant interferences were caused by the formulation excipients, diluents and or degradation products. The validation method allows quantification of RMP in pure and pharmaceutical formulations in the range between 1-200 µg/mL. Compared to previously reported methods, the present assay method assessed extensive validation parameters as per ICH guidelines. The method has shown high precision, accuracy and adequate sensitivity and demands to be in use for further studies. The established method satisfies the system suitability criteria, peak integrity, and resolution of the drug peak. The overall results clearly indicate that the current method is attractive due to the good selectivity for quantitative determination of RMP in self-emulsifying lipid-based formulation and pharmaceutical formulations
Conflict of interests
The authors have declared that there is no conflict of interest.
Acknowledgement
The authors would like to acknowledge Kayyali Chair for Pharmaceutical Industries for funding this project (KM-2017, Research Chair, Deanship of Scientific Research).
References
- Rao, K.S.S., K., RP-HPLC Method for the Determination of Losartan Potassium and Ramipril in Combined Dosage Form. Indian J Pharm Sci, 2010. 72(1): p. 108-11.
CrossRef - Rahman, N., Y. Ahmad, and S.N. Azmi, Kinetic spectrophotometric method for the determination of ramipril in pharmaceutical formulations. AAPS PharmSciTech, 2005. 6(3): p. E543-51.
CrossRef - Bhushan, R., D. Gupta, and S.K. Singh, Liquid chromatographic separation and UV determination of certain antihypertensive agents. Biomed Chromatogr, 2006. 20(2): p. 217-24.
CrossRef - Singh, M.K.P., D. Kulhari, H. Jain, S. K. Sistla, R. Chauhan, A. S., Poly (amidoamine) dendrimer-mediated hybrid formulation for combination therapy of ramipril and hydrochlorothiazide. Eur J Pharm Sci, 2017. 96: p. 84-92.
CrossRef - Kurade, V.P., M.G. Pai, and R. Gude, RP-HPLC Estimation of Ramipril and Telmisartan in Tablets. Indian J Pharm Sci, 2009. 71(2): p. 148-51.
CrossRef - Shafiq, S.S., F. Talegaonkar, S. Ahmad, F. J. Khar, R. K. Ali, M., Development and bioavailability assessment of ramipril nanoemulsion formulation. Eur J Pharm Biopharm, 2007. 66(2): p. 227-43.
CrossRef - Shafiq, S., F. Shakeel, and R.K. Khar, Enhanced stability of ramipril in nanoemulsion containing cremophor-EL: a technical note. AAPS PharmSciTech, 2008. 9(4): p. 1097-101.
CrossRef - M. De Diego, G.G., S. Mennickent, M. Olivares, R. Godoy. , Stress degradation studies of ramipril by a validated stability-indicating liquid chromatographic method. J. Chil. Chem. Soc., 2010. 55(4).
CrossRef - Sankar, A.S., T. Vetrichelvan, and D. Venkappaya, Simultaneous estimation of ramipril, acetylsalicylic acid and atorvastatin calcium by chemometrics assisted UV-spectrophotometric method in capsules. Acta Pharm, 2011. 61(3): p. 283-96.
CrossRef - Abd el, H.S., Colyer, C. L., Hassan, W. S., Shalaby, A., Utility of 4-chloro-7-nitrobenzofurazan (NBD-CI) for the Spectrophotometric and spectrofluorometric determination of several antihistamine and antihypertensive drugs. J AOAC Int, 2013. 96(5): p. 968-75.
CrossRef - Abdellatef, H.E., Spectrophotometric and spectrofluorimetric methods for the determination of ramipril in its pure and dosage form. Spectrochim Acta A Mol Biomol Spectrosc, 2007. 66(3): p. 701-6.
CrossRef - US Dept. of Health and Human Services, F.D.A., Centre for Drug Evaluation and Research (CDER), Centre for Veterinary Medicine (CVM), Guidance for Industry, in Bioanalytical Method Validation2001: Rockville, MD, USA.
- Mohsin, K., S. Al-Qahtani, and F.K. Alanazi, Rapid and sensitive bioanalytical stability-indicating method for quantification of talinolol, a selective beta1 adrenoceptor antagonist in lipid based formulations using ultrafast UHPLC systems. Acta Pol Pharm, 2014. 71(5): p. 737-45.
- Mansoor Alghazi, F.A., Kazi Mohsin, Nasir Ali Siddiqui, Faiyaz Shakeel, Nazrul Haq, Simultaneous separation of antihyperlipidemic drugs by green ultrahigh-performance liquid chromatographyediode array detector method: Improving the health of liquid chromatography. Journal of Food and Drug Analysis, 2017. 25: p. 430-437.
CrossRef

This work is licensed under a Creative Commons Attribution-NonCommercial-ShareAlike 4.0 International License.

This work is licensed under a Creative Commons Attribution 4.0 International License.
![]()
A New Edition of Web of Science
Journal Impact Factor
2022: 0.5
Five Year: 0.8
Journal is Indexed in

Cabells Whitelist
![]()


