Crystal Structure and Third Order Nonlinear Optical Studies on 2-Phenylbenzimidazolium-p-Toulenesulphonate
C. Sudhakar1,2, M. Saravanabhavan3 , M. Sekar4, B. Babu5 and J. Chandrasekaran5
1Research and Development Centre, Bharathiar University, Coimbatore – 641 046, Tamil Nadu, India.
2Chikkaiah Naicker College,Erode-638004,Tamilnadu, India.
3Department of Chemistry, Dr. N.G.P. Institute of Technology, Coimbatore -641048, Tamil Nadu, India.
4Research Department of Chemistry, Sri Ramakrishna Mission Vidyalaya College of Arts and Science, Coimbatore – 641 020, Tamil Nadu, India.
5Research Department of Physics, Sri Ramakrishna Mission Vidyalaya College of Arts and Science, Coimbatore – 641 020, Tamil Nadu, India.
Corresponding Author E-mail address: drmsbavan@gmail.com
DOI : http://dx.doi.org/10.13005/ojc/340116
A new third order nonlinear optical single crystal of 2-phenylbenzimidazolium-p-toulenesulphonate (PBITS) was grown by the solvent evaporation technique using methanol as a solvent. The single crystal XRD analysis reveals that crystals belong to the triclinic system. An NMR and FTIR study confirms the formation and vibrational analysis present in the compound. UV-Vis absorption studies were also carried out for the crystal. Nonlinear refractive index (n2), absorption coefficient (β) and third order nonlinear optical susceptibility (χ(3)) of the crystals were evaluated by Z-Scan studies.
KEYWORDS:Phenylbenzimidazolium-p-toulenesulphonate; crystals evaluated
Download this article as:| Copy the following to cite this article: Sudhakar C, Saravanabhavan M, Sekar M, Babu B, Chandrasekaran J. Crystal Structure and Third Order Nonlinear Optical Studies on 2-Phenylbenzimidazolium-p-Toulenesulphonate. Orient J Chem 2018;34(1). |
| Copy the following to cite this URL: Sudhakar C, Saravanabhavan M, Sekar M, Babu B, Chandrasekaran J. Crystal Structure and Third Order Nonlinear Optical Studies on 2-Phenylbenzimidazolium-p-Toulenesulphonate. Orient J Chem 2018;34(1). Available from: http://www.orientjchem.org/?p=41595 |
Introduction
A fascinating new field of research termed “nonlinear” optics was introduced to the scientific and engineering community after the invention of laser. Nonlinear optics has arisen as one of the most attractive fields of current research in view of its vital applications in areas of optical switching, optical data storage for the developing technologies in telecommunications, frequency mixing, optical parametric oscillation, optical bi-stability, optical logic gates, laser radiation protection, optical image processing, under water communication, biomedical and signal processing analysis etc [1-5]. Organic NLO single crystals are very efficient for THz generation and high signal to noise ratios detection due to their large nonlinear optical susceptibilities and ultrafast response times [6, 7]. It has been understood that the second-order and third-order molecular nonlinearity can be enhanced by large delocalized π-electron systems with strong donor and acceptor groups [8-10]. Based on these specifies in the present investigation donor–acceptor based crystals of 2-phenylbenzimidazolium-p-toulenesulphonate has been grown by the slow evaporation technique andits structural, optical, and third order nonlinear optical properties were discussed in detail.
Experimental Details
Material Synthesis and Growth of Pbitssingle Crystal
Equimolar ratio of p-toluenesulphonic acid in methanol and 2-phenylbenzimidazole in methanol were prepared at room temperature, mixed and stirred well for about 3hr to get clear solution. This solution was filtered using Whatmann 41 filter paper and kept aside unperturbed in a dust-free room for the growth of single crystals. Well defined, transparent crystals were collected at the end of 6th day. The collected crystals were recrystallized using dry methanol to get good quality crystals. The reaction scheme and the chemical structure were illustrated.
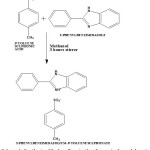 |
Scheme 1: Synthesis of 2-phenylbenzimidazolium-p-toulenesulphonate Click here to View scheme |
Materials and Instrumentation
All the chemicals were purchased from Sigma-Aldrich in the highest purity available. Solvents were purified and dried according to the standard procedure. Single crystal X-ray diffraction data of PBITS compound was collected at room temperature on a Bruker Diffractometer equipped with a fine focused sealed tube. The unit cell parameters were determined and the data collections of PBITSwas performed using a graphite-mono chromate Mo Kα (λ = 0.71073 Å) radiation by φ and ω scans. The structure of the compound was solved by direct method using SHELXS-97, which revealed the position of all non-hydrogen atoms, and was refined by full-matrix least squares on F2 (SHELXL-97) [11]. All non-hydrogen atoms were refined anisotropically, while the hydrogen atoms were placed in calculated positions and refined as riding atoms. The electronic absorption spectrum was measured in methanol using SHIMADZU 1601 UV-Vis spectrophotometer in the range of 200-600 nm. In order to confirm the functional groups of the crystal was subjected to FT-IR spectral analysis by Perkin Elmer FT-IR 8000 spectrophotometer in the range of 4000-400 cm-1 using the KBr pellets method. To confirm the molecular structure of the compound the 1H and 13C NMR spectra were recorded employing a Bruker AV III 400 MHz spectrometerin deuterateddimethylsulfoxide as solvent using TMS as an internal standard. The nonlinear optical measurements were carried out by using single beam Z-scan technique with a He-Ne laser operated at a repetition rate of 1 kHz and at the wavelength of 632 nm.
Results and Discussions
Single Crystal Xrd Analysis
From X-ray diffraction studies, it is known that the crystal belongs to the triclinic system with the space group of P-1 and the lattice parameters are a = 8.2912(5)Å, b = 9.7197(6)Å, c = 11.4293(9)Å = 82.311(4)o, β =89.626(3)o, γ= 77.915(3)o. The crystal data and details of the data collection and the structure refinement are given in Table 1. The bond length and bond angles of PBITS crystal are given in Table 2 and 3 respectively. Figure 1 shows the ORTEP view of the molecule drawn at 50% probability thermal displacement ellipsoids with the atom numbering scheme. The packing arrangement of the molecule viewed down a, b and c axis are shown in Figure 1.a, b, and c respectively.From molecular structure of PBITS, we could see that there is an intermolecular hydrogen bonding between N-H group of 2-phenylbenzimidazoliniumcation and P-toluenesulphonate anion. The N-atom of the 2-phenyl benzimdazole cation forms N-H……..O hydrogen bonds with the O atom of the 2-phenyl sulphonate anion. In the title compound the C=NH group of the 2-phenylbenzimidazole residue is engaged in the strong hydrogen bonding with the P-toluenesulphonatesulphonate anion. The selected bond distance and angles are shown in Table4 respectively. The molecule is stabilized by C-H…….O bifurcated hydrogen bonds. All non-hydrogen atoms were refined anisotropically and the hydrogen atoms were placed in geometric positions and refined as riding atoms except for those bound to oxygen and nitrogen, which were freely refined.
Table 1: Crystal data and structure refinement for PBITS.
| Empirical formula | C20 H18 N2 O3 S |
| Formula weight | 366.42 |
| Temperature | 296(2) K |
| Wavelength | 0.71073Å |
| Crystal system, space group | Triclinic, P-1 |
| Unit cell dimensions | a = 8.2912(5) Å , alpha = 82.311(4) degb = 9.7197(6) Å , beta = 89.626(3) degc = 11.4293(9)Å, gamma = 77.915(3) deg |
| Volume | 892.33(10) A3 |
| Z, Calculated density | 2, 1.364 Mg/m3 |
| Absorption coefficient | 0.204 mm-1 |
| F(000) | 384 |
| Crystal size | 0.35 x 0.30 x 0.25 mm |
| Theta range for data collection | 1.80 to 28.36 deg. |
| Limiting indices | -11<=h<=8, -12<=k<=11,-15<=l<=15 |
| Reflections collected / unique | 6971 / 4272 [R(int) = 0.0167] |
| Completeness to theta = 28.36 | 95.9 % |
| Absorption correction | Semi-empirical from equivalents |
| Max. and min. Transmission | 0.9508 and 0.9320 |
| Refinement method | Full-matrix least-squares on F2 |
| Data / restraints / parameters | 4272 / 0 / 236 |
| Goodness-of-fit on F^2 | 1.071 |
| Final R indices [I>2sigma(I)] | R1 = 0.0543, wR2 = 0.1481 |
| R indices (all data) | R1 = 0.0670, wR2 = 0.1642 |
| Largest diff. peak and hole | 0.643 and -0.471 e.A-3 |
Table 2: Bond lengths [Å] for PBITS.
| S(1)-O(2) | 1.4383(17) |
| S(1)-O(3) | 1.4562(15) |
| S(1)-O(1) | 1.4584(16) |
| S(1)-C(14) | 1.772(2) |
| N(1)-C(7) | 1.325(3) |
| N(1)-C(5) | 1.397(3) |
| N(1)-H(1N1) | 0.8600 |
| N(2)-C(7) | 1.328(3) |
| N(2)-C(6) | 1.389(3) |
| N(2)-H(2N2) | 0.8600 |
| C(3)-C(4) | 1.383(4) |
| C(3)-C(2) | 1.410(4) |
| C(3)-H(3) | 0.9300 |
| C(4)-C(5) | 1.380(3) |
| C(4)-H(4) | 0.9300 |
| C(5)-C(6) | 1.378(3) |
| C(7)-C(8) | 1.475(3) |
| C(8)-C(9) | 1.398(3) |
| C(8)-C(13) | 1.399(3) |
| C(9)-C(10) | 1.368(4) |
| C(9)-H(6) | 0.9300 |
| C(10)-C(11) | 1.364(4) |
| C(10)-H(10) | 0.9300 |
| C(11)-C(12) | 1.363(4) |
| C(11)-H(11) | 0.9300 |
| C(2)-C(1) | 1.364(4) |
| C(2)-H(2) | 0.9300 |
| C(1)-C(6) | 1.379(3) |
| C(1)-H(1) | 0.9300 |
| C(13)-C(12) | 1.369(4) |
| C(13)-H(13) | 0.9300 |
| C(12)-H(12) | 0.9300 |
| C(14)-C(20) | 1.381(3) |
| C(14)-C(15) | 1.384(3) |
| C(15)-C(16) | 1.379(3) |
| C(15)-H(15) | 0.9300 |
| C(16)-C(17) | 1.383(3) |
| C(16)-H(16) | 0.9300 |
| C(17)-C(19) | 1.384(4) |
| C(17)-C(18) | 1.510(4) |
| C(18)-H(18A) | 0.9600 |
| C(18)-H(18B) | 0.9600 |
| C(18)-H(18C) | 0.9600 |
| C(20)-C(19) | 1.385(4) |
| C(20)-H(20) | 0.9300 |
| C(19)-H(19) | 0.9300 |
Table 3: Bond angles [Å] forPBITS.
|
O(2)-S(1)-O(3) |
114.48(11) |
|
|
O(2)-S(1)-O(1) |
114.15(12) |
|
|
O(3)-S(1)-O(1) |
110.06(10) |
|
|
O(2)-S(1)-C(14) |
106.17(11) |
|
|
O(3)-S(1)-C(14) |
105.48(10) |
|
|
O(1)-S(1)-C(14) |
105.63(9) |
|
|
C(7)-N(1)-C(5) |
108.24(18) |
|
|
C(7)-N(1)-H(1N1) |
125.9 |
|
|
C(5)-N(1)-H(1N1) |
125.9 |
|
|
C(7)-N(2)-C(6) |
108.24(18) |
|
|
C(7)-N(2)-H(2N2) |
125.9 |
|
|
C(6)-N(2)-H(2N2) |
125.9 |
|
|
C(4)-C(3)-C(2) |
121.1(2) |
|
|
C(4)-C(3)-H(3) |
119.4 |
|
|
C(2)-C(3)-H(3) |
119.4 |
|
|
C(5)-C(4)-C(3) |
115.9(2) |
|
|
C(5)-C(4)-H(4) |
122.1 |
|
|
C(3)-C(4)-H(4) |
122.1 |
|
|
C(6)-C(5)-C(4) |
122.6(2) |
|
|
C(6)-C(5)-N(1) |
106.4(2) |
|
|
C(4)-C(5)-N(1) |
131.0(2) |
|
|
N(1)-C(7)-N(2) |
110.2(2) |
|
|
N(1)-C(7)-C(8) |
124.95(19) |
|
|
N(2)-C(7)-C(8) |
124.81(19) |
|
|
C(9)-C(8)-C(13) |
118.8(2) |
|
|
C(9)-C(8)-C(7) |
120.9(2) |
|
|
C(13)-C(8)-C(7) |
120.3(2) |
|
|
C(10)-C(9)-C(8) |
119.9(2) |
|
|
C(10)-C(9)-H(6) |
120.0 |
|
|
C(8)-C(9)-H(6) |
120.0 |
|
|
C(11)-C(10)-C(9) |
120.7(2) |
|
|
C(11)-C(10)-H(10) |
119.6 |
|
|
C(9)-C(10)-H(10) |
119.6 |
|
|
C(12)-C(11)-C(10) |
120.0(2) |
|
|
C(12)-C(11)-H(11) |
120.0 |
|
|
C(10)-C(11)-H(11) |
120.0 |
|
|
C(1)-C(2)-C(3) |
122.1(3) |
|
|
C(1)-C(2)-H(2) |
119.0 |
|
|
C(3)-C(2)-H(2) |
119.0 |
|
|
C(2)-C(1)-C(6) |
116.4(2) |
|
|
C(2)-C(1)-H(1) |
121.8 |
|
|
C(6)-C(1)-H(1) |
121.8 |
|
|
C(5)-C(6)-C(1) |
121.9(2) |
|
|
C(5)-C(6)-N(2) |
106.9(2) |
|
|
C(1)-C(6)-N(2) |
131.2(2) |
|
|
C(12)-C(13)-C(8) |
119.5(2) |
|
|
C(12)-C(13)-H(13) |
120.3 |
|
|
C(8)-C(13)-H(13) |
120.3 |
|
|
C(11)-C(12)-C(13) |
11.1(2) |
|
|
C(11)-C(12)-H(12) |
119.4 |
|
|
C(13)-C(12)-H(12) |
119.4 |
|
|
C(20)-C(14)-C(15) |
119.2(2) |
|
|
C(20)-C(14)-S(1) |
120.99(17) |
|
|
C(15)-C(14)-S(1) |
119.78(16) |
|
|
C(16)-C(15)-C(14) |
120.4(2) |
|
|
C(16)-C(15)-H(15) |
119.8 |
|
|
C(14)-C(15)-H(15) |
119.8 |
|
|
C(15)-C(16)-C(17) |
121.0(2) |
|
|
C(15)-C(16)-H(16) |
119.5 |
|
|
C(17)-C(16)-H(16) |
119.5 |
|
|
C(16)-C(17)-C(19) |
118.2(2) |
|
|
C(16)-C(17)-C(18) |
120.5(2) |
|
|
C(19)-C(17)-C(18) |
121.3(2) |
|
|
C(17)-C(18)-H(18A) |
109.5 |
|
|
C(17)-C(18)-H(18B) |
109.5 |
|
|
H(18A)-C(18)-H(18B) |
109.5 |
|
|
C(17)-C(18)-H(18C) |
109.5 |
|
|
H(18A)-C(18)-H(18C) |
109.5 |
|
|
H(18B)-C(18)-H(18C) |
109.5 |
|
|
C(14)-C(20)-C(19) |
119.9(2) |
|
|
C(14)-C(20)-H(20) |
120.1 |
|
|
C(19)-C(20)-H(20) |
120.1 |
|
|
C(17)-C(19)-C(20) |
121.3(2) |
|
|
C(17)-C(19)-H(19) |
119.3 |
|
|
C(20)-C(19)-H(19) |
119.3 |
|
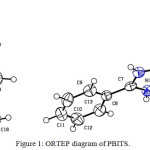 |
Figure 1: ORTEP diagram of PBITS. Click here to View figure |
Table 4: Hydrogen bonds for PBITS.
|
D-H…A |
d(D-H) |
d(H..A) |
<DHA |
d(D..A) |
Symmetry |
|
N1–H1N1…O1 |
0.860 |
1.82 |
170 |
2.674 |
x, y, z+1 |
|
N2–H2N2…O3 |
0.860 |
1.87 |
160 |
2.691 |
x,-1+y,1+z |
|
C9–H6…O1 |
0.930 |
2.56 |
160 |
3.450 |
x,y,1+z |
|
C16–H16…O2 |
0.930 |
2.54 |
156 |
3.410 |
-1+x,y,z |
|
C20–H20…O2 |
0.930 |
2.51 |
105 |
2.892 |
Nmr Spectral Analysis
The 1H NMR spectrum of the PBITS single crystal was recorded employing a Brucker 400 MHz spectrometer using TMS as the internal reference standard. The 1H NMR spectrum of the PBITS is depicted in Figure2.The singlet peak observed at δ 2.298 has been assigned to three protons of the methyl group in the 2-phenylbenzoimidazoliump-toluenesulphonate. The doublet peak centred at δ 7.146 (J = 8 Hz) is due to the C19 and C16 protons of the same kind in aromatic ring of 2-phenylbenzoimidazolium-p-toluenesulphonate. Another doublet peak centred at δ 8.226(J =6.8 Hz) is due to the C15 and C20 protons of the same kind in aromatic ring of 2-phenylbenzoimidazolium-p-toluenesulphonate. The multiplet peak centred at δ 7.901-7.572 is due to the C1, C2, C3, C4, C9, C10, C11, C12 and C13 protons of the same kind of the aromatic ring of 2-phenylbenzoimidazolium-p-toluenesulphonate. The NH proton appeared as singlet atδ 5.4.
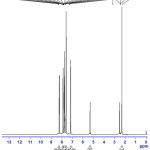 |
Figure 2.1H NMR spectrum of PBITS. Click here to View figure |
The 13C NMR spectrum of the PBITS single crystal was recorded employing a Brucker 400 MHz spectrometer using TMS as the internal reference standard. The 13C NMR spectrum of the PBITS is depicted in Figure 3. In the downfield carbon signal at δ 154.25 is correspond to the C7 carbon of 2-phenylbenzimidazole moiety. The carbon signal at δ 150.22 is belongs to the C14 carbon of p-toluenesulphonicacid moiety. The carbon signal at δ 143.41 is correspond to the C5carbon of p-toluenesulphonicacid moiety. The carbon signal at δ 138.63 is belongs to the C4 carbon of 2-phenylbenzimidazole moiety. The sharp and intense signal at δ 137.06 is due to the C15 and C20 carbons of the same kind in the p-toluenesulphonicacid moiety. The carbon signal at δ 134.94 is correspond to the C8and C11 carbons of 2-phenylbenzimidazole moiety. The sharp and intense signal at δ 133.20 is due to the C9 and C13 carbons of the same kind in the2-phenylbenzimidazole moiety. The carbon signal at δ 131.28 is belongs to the C10 and C12 carbon of 2-phenylbenzimidazole moiety. The carbon signal at δ 130.74 is correspond to the C16 and C19 carbon of 2-phenylbenzimidazole moiety. The sharp and intense signal at δ 128.31 is due to the C2 and C3 carbons of the same kind in the p-toluenesulphonicacid moiety. The sharp and intense signal at δ 119.36 is due to the C17carbon of the same kind in the 2-phenylbenzimidazole moiety. The carbon signal at δ 26.02 is correspond to the methyl carbon of 2-phenylbenzimidazole moiety.
 |
Figure 3: 13C NMR spectrum of PBITS. Click here to View figure |
FT-IR Spectral Studies
The FT-IR spectrum of PBITS crystal was recorded employing a Perkin ElmerFT-IR spectrometer using KBr pellet technique in the range 4000-400 cm-1 and the FT-IR spectrum of PBITScrystal is depicted in Figure 4. The recorded FT-IR spectrum was analyzed to ascertain the functional groups presented in the compound. The formation of the PBITS during the reaction betweenp-toluenesulphonicacid and 2-phenylbenzimidazole strongly evident by the presence of the main characteristic infrared band present in the crystal. The formation of PBITS is evident by the presence of most prominent group in PBITScrystal such as N-H, C-H, C=N, C-N and SO2 groups. The band observed at 3336 cm-1 is due to the N-H symmetric stretching vibration. The aromatic C-H stretching vibration is observed at 3062 cm-1, 2930 cm-1 and 2853 cm-1. The band observed at 1634 cm-1 is indicate the presence of C=N group in the PBITS molecule. The aromatic C-H bending vibration is observed at 1457cm-1. The band 1396 cm-1 indicates the presence of C-N stretching vibration in the molecule. The sharp band observed at1166 cm-1 indicates the presence of aromatic SO2 symmetric stretching vibration.
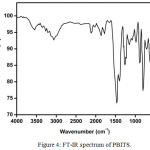 |
Figure 4: FT-IR spectrum of PBITS. Click here to View figure |
Electronic Absorption Spectroscopic Studies
The UV-Visible absorption spectrum of PBITS crystal was recorded employing a SYSTRONICS make double beam spectrophotometer 2202 in a range from 200 to 600 nm using DMSO as solvent and the spectrum shown in Figure 5. From the spectrum, it is observed that the compound exhibits two characteristics absorption bands. The bands at about 296.0 and 329.6 nm are assigned to π → π* transition of the title compound. Also the absence of absorption in the region between 330nm to 600 nm makes the crystal suitable for optical applications [7, 12].
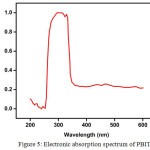 |
Figure 5: Electronic absorption spectrum of PBITS. Click here to View figure |
Z-Scan Studies
The Z-scan is a well-known experimental technique to measure the intensity dependent third order nonlinear susceptibility of the materials[13, 14]. The open and closed aperture Z-scan configurations are used to investigate the nonlinear absorption coefficient β and nonlinear refractive index n2. Figure 6a shows the normalized transmittance (T) with a closed aperture as a function of the distance z along the lens axis in the far field. The Figure 6(b) shows the normalized transmittance with open aperture as a function of the distance z along the lens axis in the far field. The nonlinear refractive index (n2) of the crystal was calculated using the standard relations given below:
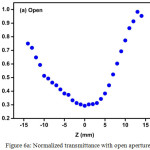 |
Figure 6a: Normalized transmittance with open aperture. Click here to View figure |
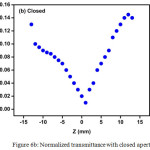 |
Figure 6b: Normalized transmittance with closed aperture. Click here to View figure |
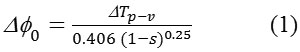
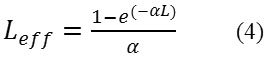
where ∆Tp-v is the difference between the normalized peak and valley transmittance and S is the linear transmittance of the aperture. The nonlinear refractive index (n2) and nonlinear absorption coefficient (β) are given by,
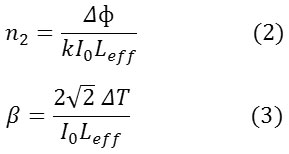
where k is the wave number k = 2π/λ and
With
![]()
defined as the peak intensity within the sample, where Leff is the thickness of the sample and α is the linear absorption coefficient. The real and imaginary parts of the third order nonlinear susceptibility χ(3) are defined as

where ε0 is the vacuum permittivity, n0 is the linear refractive index of the sample and c is the velocity of light in vacuum. Thus, we can easily obtain the absolute value of χ(3) using the following formula
![]()
As seen from the closed aperture Z scan curve, the prefocal transmittance valley is followed by the post focal peak, which is the positive nonlinearity[15]. The calculated value of the nonlinear refractive index (n2) is 6.40149 10-8cm2/W. The value of the nonlinear absorption coefficient (β) estimated from the open aperture Z-scan curve is 2.4603 x 10⁻⁴ cm/W. The third order susceptibility of PBITS is 1.3061 x 10⁻⁷esu. As the material has a positive refractive index, it results in self-focusing nature of the material, which is an essential property for all optical switching devices[16].
Conclusions
New bright, transparent organic compound, PBITS was synthesized and crystal crown by slow evaporation solution growth method at room temperature. The material synthesized characterized by various analytical, spectroscopic and single crystal XRD studies. From X-ray diffraction studies, PBITS single crystal is observed that the crystal belongs to the triclinic system with the space group of P-1. UV-Visible absorption spectrum confirms the suitability of the title crystal for various optical applications. The molecular structure of the compound was confirmed by the FT-IR, 1H and 13C NMR spectral studies.Z-scan studies reveal the self-focusing nature of the material, which is a vital property for all optical switching and optical limiting applications.
References
- Babu, B.;Chandrasekaran, J.;Thirumurugan, R.;Jayaramakrishnan, V.;Anitha,K.;J. Mater. Sci: Mater. Electron.2017, 28,1124.
- Majchrowski, A.;Kityk, I.V.;Łukasiewicz, T.;Mefleh, A.; Benet, S.;Opt. Mater.2000,15, 51.
- Subhashini, V.;Ponnusamy, S.;Muthamizhchelvan, C.;Spectrochim. Acta Part A2012,87, 265.
- Saravana Kumar, G.;Murugakoothan, P.;Optik,2015,126,68.
- MartinBrittoDhas, S.A.;Natarajan,S.;Opt. Commun.2008,281, 457.
- Peramaiyan, G.;Pandi, P.;Sornamurthy, B.M.;Bhagavannarayana, G.;Mohan Kumar, R.;Spectrochim. Acta Part A,2012,95,310.
- Thirupugalmani, K.;Karthick, S.;Shanmugam, G.;Kannan, V.;Sridhar, B.;Nehru, K.;Brahadeeswaran, S.; Opt. Mater.2015, 49, 158.
- Chemla, D.S.;Zyss, J.;Nonlinear Optical Properties of Organic molecules and crystals, 1-2, Academic Press, Orlando, New York, 1987.
- Suresh, M.; AsathBahadurS.;and Athimoolam, S. J.;J. Mol. Struct.2016,1112, 63.
- Mohana, J.;Ahila, G.;DivyaBharathi, M.;Anbalagan, G.;J. Cryst. Growth2016,450, 181.
- Sheldrick, G.M.;SHELXL97 and SHELXS97, University of Gottingen, Germany, 327, 1997.
- Babu, B.;Chandrasekaran, J.;Balaprabhakaran, S.;Optik,2014,125,3005.
- Sheik-Bahae, M.;Said, A.A.;Van StrylandE.W.;Opt. Lett.1989,17, 955.
- Sheik-Bahae, M.;Said, A.A.;Wei, T.H.;Hagan, D.J.;Van Stryland,E.W.;IEEE J. Quan. Elect.1990,26, 760.
- Gomez, S.L.;Cuppo, F.L.S.;FigueriredoNeto, A.M.;Braz. J. Phys.2003, 33, 813.
- Sheik, M. David, C.H.;Hagan, D.J.;Van Stryland, E.W.;IEEE J. Quan. Elect.1991,27, 1296.

This work is licensed under a Creative Commons Attribution-NonCommercial-ShareAlike 4.0 International License.

This work is licensed under a Creative Commons Attribution 4.0 International License.
![]()
A New Edition of Web of Science
Journal Impact Factor
2022: 0.5
Five Year: 0.8
Journal is Indexed in

Cabells Whitelist
![]()


