Comparative Evaluation of Trace Heavy Metal Ions in Water Sample using Complexes of Dithioligands by Flame Atomic Absorption Spectrometry
Vinay Kumar Maurya, Ravi Pratap Singh and Lal Bahadur Prasad
Department of Chemistry Institute of Science Banaras Hindu University, Varanasi- 221005, India.
Corresponding Author E-mail: lbprasad@bhu.ac.in
DOI : http://dx.doi.org/10.13005/ojc/340111
Four new complexes were prepared by the metathetic reaction of trace heavy metals like Cd, Zn, Cu and Hg with two different dithioligands of the formula ML2 [ M= Cd, Zn, Cu & Hg and L= potassium-1,1-dicyano-2,2-ethylenedithiolate and potassium N-4-fluorobenzyl,N butyldithiocarbamate ] and characterized by Elemental Analysis, IR, UV-Visible, 1H,13C NMR and AAS. AAS measurements revealed that the N- substituted dithiocarbamate ligand are more effective removal efficiency of heavy metals than C- substituted dithiocarbamate ligand . Molar Ratio studies show that the complexes have the formula ML2. Solvent extraction measurement indicates that after the extraction of heavy metal in water phase and their dithiocarbamate complexes are completely dissolved in organic phase and are totally separated from water solution.
KEYWORDS:Atomic Absorption Spectrometry; Dithiocarbamate; Heavy Metal; Removal Efficiency; Polluted Water
Download this article as:| Copy the following to cite this article: Maurya V. K, Singh R. P, Prasad L. B. Comparative Evaluation of Trace Heavy Metal Ions in Water Sample using Complexes of Dithioligands by Flame Atomic Absorption Spectrometry. Orient J Chem 2018;34(1). |
| Copy the following to cite this URL: Maurya V. K, Singh R. P, Prasad L. B. Comparative Evaluation of Trace Heavy Metal Ions in Water Sample using Complexes of Dithioligands by Flame Atomic Absorption Spectrometry. Orient J Chem 2018;34(1). Available from: http://www.orientjchem.org/?p=42983 |
Introduction
Dithiocarbamate functional group is a versatile ligating moiety and readily interacts with a verity of metal ions to form complexes with varying nuclearities1. They have wide range of application in medicinal chemistry, industrial chemistry, rubber technology2-6 and several C-substituted and N-substituted dithiocarbamate complexes used in agrochemical due to their high efficiency for fungal diseases7-10 and adopt various coordination modes such as asymmetric and symmetric chelating, asymmetric and symmetric bridging, chelating-bridging and rarely monodentate in their complexes; the most common binding mode is chelating. The dithiocarbamate ligands show ability to stabilized high formal oxidation states of the metals and metal dithiocomplexes exhibits interesting magnetic and optical properties11-12.
Heavy metals are high atomic weight elements and their density about five times greater than water. Toxicity of heavy metals depends upon the doses of individuals, ways of unveiling and their chemical species, as well as age, gender, genetics and nutritional states of unveiling individuals. Environmental water pollution through toxic heavy metals has great anxiety and a dangerous problem due to the liberation and prejudicial effects. These metals found through anthropogenic activities13 and liberated into the atmosphere, and they destroy the metabolic function by their accumulation and disturb the function of vital organs and glands such as heart, brain, kidney, bone, liver etc. and or plants14. By the consumption of food, beverages, skin exposure and the inhaled air these toxins have been introduced into our bodies.
In this article we have chosen pollutants like cadmium, zinc, copper and mercury. These metals have wide applications in applied engineering works, pulp and paper industries, leather tanning, plastic stabilizers, pigments, photographic materials, fertilizers, batteries etc. Additionally, cadmium and lead are known as toxical effects and have a harmful impact on the humans health and living organisms15. Zinc and copper are comparatively non-toxic to humans and animals at low level but toxic to plants and algae at higher level while cadmium replace zinc biochemically16, causes high blood pressure , kidney damage and red blood cells and mercury is a highly toxic particularly as methylmercury, causes irreversible nerves and brain damage. Many methods have been adopt for the separation of heavy metals from various water sample before being discharged into the atmosphere but in some cases difficulties are arises in determining the heavy metals in the environmental samples due to scanty sensitivity and or matrix interferences17-18.
Therefore, a new approach of separation and enrichment for heavy metals ions and determination by AAS was undertaken here. It is used as usual instrumental techniques for the analysis of element in water samples. It is a very sensitive technique and have very low interference19-20, and detect element up to few ppm level when graphite furnace is used for the atomization. The selection of more appropriate treatment for the metal- contaminated polluted water depends on initial parameters like pH, initial metal concentration and the overall treatment performance. In this studies two different moiety of dithiocarbamate ligands (N- substituted & C- substituted) were prepared and compared their performance for the removal efficiency of heavy metal from the water sample with the help of flame atomic absorption spectrometer.
Materials and Methods
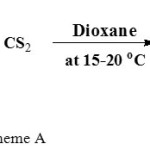
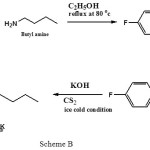
All the experiment were carried out in the open atmosphere at room temperature. The solvent were dried and distilled before use following the standard procedure. The chemicals Malononitrile, 4-Fluorobenzaldehyde, Butyl amine, NaBH4, CS2, Dioxane, Dichloromethane, and KOH (E. Merck) were used as received.
Instrumentation
The concentrations of Cd, Zn, Cu and Hg were determined using a ALICO SL -168 Model Flame Atomic Absorption Spectrometry (FAAS) equipped with a hollow cathode lamp. A mixture of acetylene as a fuel, air as an oxidizing agent and air acetylene Flame burner were used. The ratio of the metal to the ligand was determined using a UV- Spectrophotometer (SHIMADZU 1700). For pH adjustment, we used a Metrohm pH Meter. The melting points of the ligands and complexes were recorded by digital melting point apparatus in open capillary. Infrared spectra were carry out as KBr Pellets on a Varian Excallibur 3100 FT-IR Spectrophotometer in the range of 4000-400 cm-1. The contents of C, H, N, were determined with the help of an Elementar Analysen System Gmbh Vario EL V 3.00 instruments.
Preparation of ligands
Preparation of potassium-1,1-dicyano-2,2-ethylenedithiolate (KL1)
The ligand KL1 was synthesized by the reported method with some minor modification21. To a suspension of pulverized KOH (11.2 g, 0.2 mol) in dioxane, a mixture of carbon disulphide (6.3 ml, 0.1 mol) and malononitrile (6.1 ml, 0.1 mol) in the same solvent (50.00 ml) was added gradually with constant stirring. The temperature of the reaction mixture was maintained at bellow15oC using an ice bath in order to inhibit any possible decomposition of the product due to nature of the reaction is exothermic. The reaction mixture was stirred for about 30 minutes after the complete addition of the reactants and after some time it was diluted with 250 ml of the diethyl ether. The yellowish precipitate was formed out and it was suction filtered, washed with mixture of dioxane – ether and dried in vacuum.
Analysis: Found (calcd.) % for C4N2S2K2.H2O
C, 20.28(20.34); N, 11.84(11.86); S, 26.45(27.12); H, 1.06(0.95)
 |
Scheme A Click here to View scheme |
(Calcd.) % for C12H15FNS2K
C, 48.78(48.84); N, 4.74(4.78); S, 21.70(21.78); H, 5.12(5.18)
 |
Scheme B Click here to View scheme |
Synthesis of the Complexes of Heavy Metal with (KL1) and (KL2) Ligands
The complexes were prepared by taking 20 mL methanolic solution of the ligands KL1 (0.218 g, 1 mmol) and KL2 (0.295 g, 1 mmol) and 20 mL methanol: water (80:20) solution of M (OOCCH3)2.2H2O ( 0.5 mmol) [M= Cd, Zn, Cu and Hg] in 2 : 1 molar ratio22-23. All the reaction mixture was stirred for 6 hours at room temperature for the precipitation of metal-complexes. The precipitate obtain was filtered and washed with methanol followed by diethyl ether and analyzed by different spectroscopic techniques. The elemental analysis data and % yield of the prepared complexes are shown in table 1 and 2.
Table 1: The elemental analysis (%) and the yield (%) of complex formation for ligand KL1.
| S.No. | Complexes | C% | N% | S% | Metal% | Yield(%) |
| 1 | [Cd(C4N2S2)2] | 28.58(28.34) | 16.66(15.96) | 38.15(37.12) | 16.61(15.89) | 98.72 |
| 2 | [Zn(C4N2S2)2] | 27.94(27.12) | 16.29(16.02) | 37.29(37.16) | 18.48(18.32) | 99.01 |
| 3 | [Cu(C4N2S2)2] | 27.79(27.47) | 16.20(15.98) | 37.09(36.86) | 18.91(18.48) | 99.18 |
| 4 | [Hg(C4N2S2)2] | 24.75(24.23) | 14.43(14.03) | 33.04(32.82) | 27.78(27.32) | 98.79 |
Table 2: The elemental analysis (%) and the yield (%) of complex formation for ligand KL2.
| S.No. | Complexes | C% | H% | N% | S% | Metal% | Yield (%) |
| 1 | [Cd(C12H15NFS2)2] | 50.69(50.46) | 5.32(5.11) | 4.93(4.86) | 22.56(22.12) | 9.82(9.78) | 98.88 |
| 2 | [Zn(C12H15NFS2)2] | 50.02(49.89) | 5.25(5.13) | 4.86(4.78) | 22.26(22.16) | 11.03(10.92) | 99.09 |
| 3 | [Cu(C12H15NFS2)2] | 49.86(49.78) | 5.23(5.16) | 4.85(4.73) | 22.18(22.07) | 11.31(11.24) | 99.21 |
| 4 | [Hg(C12H15NFS2)2] | 46.45(46.13) | 4.87(4.39) | 4.51(4.42) | 20.67(20.51) | 17.38(17.22) | 98.93 |
Results and Discussion
Infrared Spectra
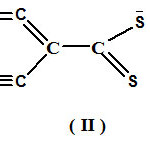
The ligands (KL1 and KL2) act as a bidentate ligand. The (KL1) ligand can be represented in three forms as shown under:
 |
Scheme C Click here to View scheme |
From a detailed studies it has been apparent that canonical form (I) participate to a greater extend in the elucidation of structure and bonding of metal- ligand (KL1) complexes 24-25.
The ligand (KL1) and all the complexes shows IR absorption near 2000 cm-1, 1400 cm-1 and 950 cm-1 associated to ϑ(C≡N), ϑ(C=C) and ϑ(C-S) mode respectively26-27. The two most important feature of the spectra are the shift 12-30 cm-1 in ϑ(C≡N) and 15-21 cm-1 in ϑ(C=C) from the ligand (KL1) spectra to that of the complexes. In ligand spectra, two bands ϑ(C≡N) and ϑ(C=C) are located near at 2178 cm-1 (split band) and 1375 cm-1 respectively. Upon complexation these bands are observed in 2190-2207 cm-1 and 1383-1395 cm-1 region in all the complexes.
The splitting in ϑ(C≡N) observes in the most of the complexes may be related to the lower symmetry for these complexes. This may be indicative of bidentate bridging behavior of (KL1) ligand. The ϑ(C-S) vibration occurring at 950 cm-1 and 874 cm-1 in (KL1) is observed in 866-950 cm-1 region in the complexes thereby indicating coordinating behavior of isomaleonitriledithiolate ligand.
The ligand (KL2) and all the complexes showed the IR absorption near 2926 cm-1,1206 cm-1,1149 cm-1 and 994 cm-1 associated to ϑ(CH3), ϑ(C-N), ϑ(C=S) and ϑ(C-S) mode respectively. Upon complexation these bands are shifted 14-19 cm-1 in ϑ(C=S), 6-12 cm-1 in ϑ(C-S) and 11-18 cm-1 in ϑ(C-N) in all the complexes23.
Yoe-Jones Method for the Determination of Stoichiometry of complexes
In this studies, a set of series of sample solution were prepared in which the concentration of one reactant is kept as constant and other is different. The absorbance of each solution is determined and plot a graph between absorbance and the concentration of the ligand . For example we take zinc metal and their concentration fixed at 5 ppm in a solution at pH 7 considered as blank sample. Then the absorbance of the sample to be determines containing the metal plus the ligand at concentration i.e. 1, 2, 4, 6, 8, 10, 12, 15, 20 and 25 ppm respectively. By the extrapolating the graph, the intercept of plot becomes 10 ppm, this is the double concentration of the metal, suggesting that a complex have formula ML224-25. This method was repeated for each metals with both ligands. A representative example are shown in fig. 1 and 2.
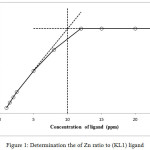 |
Figure 1: Determination the of Zn ratio to (KL1) ligand Click here to View figure |
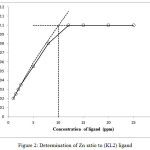 |
Figure 2: Determination of Zn ratio to (KL2) ligand Click here to View figure |
The Solvent Extraction of the Heavy Metal Dithiocarbamate
0.1% of known amount of ligands was taken in R.B. and 0.05 mg/L and 5 mg/L water standered solution of heavy metal ions was added and stirred for 30 min. at room temperature. Similarly the metal complexes were extracted with 10 ml of dichloromethane solution. The heavy metal absorbance in water phase was determined by atomic absorption spectrometry (flame system and furnace system) at different pH (3-11) after removing the organic phase of the solution and it was compared with the absorbance of initial solution of heavy metal ion (0.05 and 5.0 mg/L HM standard solution). The pH of the solution was adjusted with HCl and NaOH or maintained by a suitable buffer at desired volume. Acetate buffer for pH 3-5, phosphate buffer of 6-8 and carbonate buffer for pH 9-11.Our main aim for the extraction of heavy metal from water solution is to separate trace level of heavy metal ions from the solution. The heavy metal precipitateted as metal dithiocarbamate complex after using 10 ml volume of the CH2Cl2 solution for the extraction. The absorbance of heavy metal ions (0.050 and 5.0 mg/L) are measured before and after adding the dithiocarbamate solutions by the atomic absorption spectrometry. After the CH2Cl2 extraction shows that absorbance of trace heavy metal ions in the water phase is lower than the absorbance of initial concentration of trace heavy metal solution by the AAS measurement. This measurement demonstrate that after the extraction of heavy metal in water phase and their dithiocarbamate complexes are completely dissolved in organic phase and are totally separated from water solution.
Table 3: Metal removal efficiency of KL1 ligand with 0.05 mg metals
| Metal | Initial concentration (ppm) | Remaining concentration in aqueous solution (ppm) | pH | Removal efficiency (%) |
| Cd | 0.813 | 0.172 | 3 | 78.84 |
| 0.168 | 5 | 79.33 | ||
| 0.104 | 7 | 87.2 | ||
| 0.123 | 9 | 84.87 | ||
| 0.136 | 11 | 83.27 | ||
| Zn | 0.941 | 0.197 | 3 | 79.06 |
| 0.162 | 5 | 82.78 | ||
| 0.148 | 7 | 84.27 | ||
| 0.098 | 9 | 89.58 | ||
| 0.129 | 11 | 86.29 | ||
| Cu | 0.792 | 0.115 | 3 | 85.47 |
| 0.107 | 5 | 86.48 | ||
| 0.083 | 7 | 89.52 | ||
| 0.076 | 9 | 90.4 | ||
| 0.1 | 11 | 87.37 | ||
| Hg | 0.911 | 0.172 | 3 | 81.11 |
| 0.151 | 5 | 83.42 | ||
| 0.109 | 7 | 88.03 | ||
| 0.098 | 9 | 89.24 | ||
| 0.137 | 11 | 84.96 |
Table 4: Metal removal efficiency of KL1 ligand with 5 mg metals
| Metal | Initial concentration (ppm) | Remaining concentration in aqueous solution (ppm) | pH | Removal efficiency (%) |
| Cd | 0.911 | 0.137 | 3 | 84.96 |
| 0.129 | 5 | 85.83 | ||
| 0.122 | 7 | 86.6 | ||
| 0.131 | 9 | 85.62 | ||
| 0.139 | 11 | 84.74 | ||
| Zn | 0.879 | 0.156 | 3 | 82.25 |
| 0.151 | 5 | 82.82 | ||
| 0.144 | 7 | 83.61 | ||
| 0.122 | 9 | 86.12 | ||
| 0.13 | 11 | 85.21 | ||
| Cu | 0.829 | 0.107 | 3 | 87.09 |
| 0.096 | 5 | 88.41 | ||
| 0.091 | 7 | 89.02 | ||
| 0.085 | 9 | 89.74 | ||
| 0.099 | 11 | 88.05 | ||
| Hg | 0.938 | 0.131 | 3 | 86.03 |
| 0.127 | 5 | 86.46 | ||
| 0.113 | 7 | 86.24 | ||
| 0.129 | 9 | 87.95 | ||
| 0.135 | 11 | 85.6 |
Table 5: Metal removal efficiency of KL2 ligand with 0.05 mg metals
| Metal | Initial concentration (ppm) | Remaining concentration in aqueous solution (ppm) | pH | Removal efficiency (%) |
| Cd | 0.921 | 0.087 | 3 | 90.55 |
| 0.081 | 5 | 91.2 | ||
| 0.069 | 7 | 92.5 | ||
| 0.073 | 9 | 92.07 | ||
| 0.085 | 11 | 90.77 | ||
| Zn | 0.759 | 0.098 | 3 | 87.08 |
| 0.095 | 5 | 87.84 | ||
| 0.089 | 7 | 88.27 | ||
| 0.068 | 9 | 91.04 | ||
| 0.079 | 11 | 89.59 | ||
| Cu | 0.88 | 0.071 | 3 | 91.93 |
| 0.065 | 5 | 92.61 | ||
| 0.055 | 7 | 93.75 | ||
| 0.049 | 9 | 94.43 | ||
| 0.06 | 11 | 93.18 | ||
| Hg | 0.841 | 0.068 | 3 | 91.91 |
| 0.063 | 5 | 92.5 | ||
| 0.059 | 7 | 92.98 | ||
| 0.05 | 9 | 94.05 | ||
| 0.057 | 11 | 93.22 |
Table 6: Metal removal efficiency of KL2 ligand with 5 mg metals
| Metal | Initial concentration (ppm) | Remaining concentration in aqueous solution (ppm) | pH | Removal efficiency (%) |
| Cd | 0.965 | 0.099 | 3 | 89.74 |
| 0.086 | 5 | 91.08 | ||
| 0.081 | 7 | 91.6 | ||
| 0.089 | 9 | 90.77 | ||
| 0.097 | 11 | 89.94 | ||
| Zn | 0.847 | 0.104 | 3 | 87.72 |
| 0.1 | 5 | 88.19 | ||
| 0.099 | 7 | 88.31 | ||
| 0.085 | 9 | 89.96 | ||
| 0.098 | 11 | 88.42 | ||
| Cu | 0.971 | 0.098 | 3 | 89.9 |
| 0.091 | 5 | 90.62 | ||
| 0.085 | 7 | 91.24 | ||
| 0.072 | 9 | 92.58 | ||
| 0.081 | 11 | 91.65 | ||
| Hg | 0.908 | 0.087 | 3 | 90.41 |
| 0.081 | 5 | 91.07 | ||
| 0.069 | 7 | 92.4 | ||
| 0.065 | 9 | 92.84 | ||
| 0.074 | 11 | 91.85 |
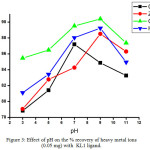 |
Figure 3: Effect of pH on the % recovery of heavy metal ions (0.05 mg) with KL1 ligand. Click here to View figure |
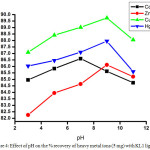 |
Figure 4: Effect of pH on the % recovery of heavy metal ions (5 mg) with KL1 ligand. Click here to View figure |
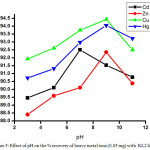 |
Figure 5: Effect of pH on the % recovery of heavy metal ions (0.05 mg) with KL2 ligand. Click here to View figure |
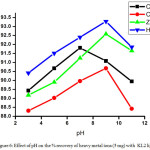 |
Figure 6: Effect of pH on the % recovery of heavy metal ions (5 mg) with KL2 ligand. Click here to View figure |
Metal removal capacity of ligands
The method involved for trapping metals from its solution using different dithiocarbamate ligands (KL1and KL2) were study using AAS at different pH values. The result obtained by AAS measurement shown in table 3-6 indicate that removal efficiency of all the heavy metals are varies with varying the pH. The optimal removal efficiency was found 87.20 % in the case of cadmium metal (0.05 mg) with ligand KL1 at pH 7; but when water sample were spiking with 5 mg of metal with same ligand, the removal efficiency are decrease i.e. 86.60 % this is because when the concentration of metal reaches at 100 times the stability of ligand-metal complex are decrease. Whereas in basic and acidic medium lower efficiency of KL1 ligand with cadmium metal was observed. Likewise the removal efficiency was observed at maximum 89.58 % at highly basic medium for zinc metal and it was 90.40 % and 89.24 % observed for copper and mercury at basic medium. Whereas the highest removal efficiency 92.50 % was noted in the case of cadmium metal at pH 7 with 0.05 mg of metal with ligand KL2 while when the water sample spike with 5 mg of the metal the efficiency decrease 91.60 %, this indicate that when the water sample is contaminated maximum with cadmium metal the removal efficiency decrease. Same observation was observed for another heavy metal ions. So, pH values and concentration of metal plays an important role in the removing efficiency for the heavy metal ions and it was changes upon changing the pH and metal concentration for the same ligand. The graphical representation of pH vs % removal efficiency was shown in fig. 3-6.
Finally, it was observed that the ligand KL2 have higher removal efficiency in comparison to the ligand KL1, this is because the N-substituted dithiocarbamate metal complexes shows higher stability than the C-substituted dithiolate metal complexes due to presence of free lone pair on the nitrogen which upon delocalization the partial
![]()
double bond character after the complexation, indicating the removal efficiency primarily depends on the types of ligands are used.
Conclusion
All the complexes were found in 98.72-99.21% of yields by facile metathetical reactions between metals and the potassium salt of the ligands (KL1and KL2) in a 1:2 molar ratio in 80:20 v/v methanol: water solution. The complexes are stable at r.t. and melt/ decompose in the 135-200oC temperature range. All the ligands and complexes have been analyzed by different spectroscopy techniques like IR, 1H and 13C NMR and UV-Vis Spectroscopy. The ultraviolet spectroscopy clearly indicate that the complexes have the formula ML2.The dichloromethane extraction of the heavy metal complexes showed that it was quantitatively pass from the water phase to the small volume of the organic phase and were successfully separated into organic phase. It was observed that the N-substituted dithiocarbamate ligand was more effective in removing the trace heavy metal ions from water sample solution compared to the C-substituted dithiocarbamate ligand at the same pH value.
Acknowledgements
We gratefully acknowledge the University Grant Commission (UGC), New Delhi for financial assistance in the form of Senior Research Fellow Ref. No: 22/12/2013 (II) EU-V. Authors are thankful to Mr. Himanshu, Department of Metallurgical Engineering, IIT, B.H.U. Varanasi for the FAAS measurement.
References
- Hogarth, G. Prog. Inorg.chem. 2005, 53, 71-561
- Fujii, S.; Yoshimura, T. Coord. Chem. Rev. 2000, 198, 89-99.
CrossRef - Cooksona, J.; Beer, P. D.; Dalton Trans. 2007, 15, 1459–1472.
CrossRef - Marcheselli, L.; Preti, C.; Tagliazucchi, M.; Cherchi, V.; Sindellari, L.; Furlani, A.; Papaioannou, A.; Scarcia, V. Eur. J. Med.Chem.1993, 28, 347-352.
CrossRef - Peter, J. N.; Andreas, W. E.; Jaap, G. H.; Sander, R. J.; Jan, R.; Evert, J. B. J. Am. Chem. Soc. 1999, 121, 163-168.
CrossRef - Becker, R.; Knorr, A.; Lubr.Sci. 1996, 8, 95-117.
CrossRef - Lishant, H-Van; Schwack, W. J. AOAC Int. 2000, 83,720-727.
- Dogheim, S.M.; alla, S.A.G.; El-Marsafy, A.M.; Fahmy, S.; J. AOAC Int. 1999, 82, 948-955.
- Malik, A. K.; Faubel, W. Pestic Sci. 1999, 55, 965-970.
- Humeres, E.; Debacher, N. A.; de, M. M.; Sierra, S.; J. Org. Chem. 1999, 64, 1807-1813.
CrossRef - Rajput, G.;Singh, V.; Singh, S. K.; Prasad, L. B.; Drew, M. G. B.; Singh, N. Eur. J. Inorg. Chem. 2012, 3885-3891.
CrossRef - Rajput, G.;Singh, V.; Gupta, A. N.; Yadav, M. K.; Kumar, V.; Singh, Kumar, S.; Prasad, A.; Drew, M. G. B.; Singh, N. Cryst. Eng. Comm. 2013, 15, 4676-4683.
CrossRef - Zahra, A.; Hashmi, M.Z.; Malik, R.N.; Ahmed, Z. Sci. Total Environ. 2014, 470, 925-933.
CrossRef - Ali, H.; Khan, E.; Sujad, M.A. Chemosphere 2013, 91, 869-881.
CrossRef - Zhao, G.; Li, J.; Ren, X.; Chen, C.; Wang, X. Environ. Sci. Technol. 2011, 45, 10454-10462.
CrossRef - Plum, L.M.; Rink, L.; Haase, H. Int. J. Environ. Res. Public Health 2010, 7, 1342-1365.
CrossRef - Juang, R.S.; Shiau, R.C.; J. Membrane Sci.2000, 765, 159-167.
CrossRef - Amuda, O. S.; Amoo, I. A.; Ajayi, O. O. J. Hazard. Mat. 2006, 129, 69-72.
CrossRef - Dauvalter, V.A. Water Res. 1998, 25, 451-457.
- Baron, J.; Letret, M.; Astruc, M. Environ. Technol. 1990, 11, 151-162.
CrossRef - Jensen, K. A.; Henriksen, L.; Acta. Chem. Scand. 1968, 22, 1107-1128.
CrossRef - Manar, K. K.; Yadav, M. K.; Anamika; Drew, M. G. B.; Singh, N. Polyhedron 2016, 117, 592-599.
CrossRef - Gupta, A. N.; Singh, V.; Kumar V.; Rajput, A.; Singh L.; Drew, M. G. B.; Singh, N. Inorganica Chimica Acta 2013, 408, 145-151.
CrossRef - Awang, N.; Baba, I.; Yamin, B. M.; Othman, M. S.; Kamaludin, Amer. J. Appl. Sci. 2011, 8, 310–317.
CrossRef - Mangsup, L.; Siripalsarnpipat, S.; Chaichit, N. Anal.Sci. 2003, 19, 1345-1353.
CrossRef - Khalid, J.; AL-Adilee; Ahmed, A. K.; Ali, M.T.; J. Molecular structure 2016, 1108, 378-397.
- Awang, N.; Baba, I.; Yamin, B. M.; Othman, M. S.; Kamaludin, N. F. Amer. J. Appl. Sci. 2011, 8, 310-317.
CrossRef

This work is licensed under a Creative Commons Attribution-NonCommercial-ShareAlike 4.0 International License.

This work is licensed under a Creative Commons Attribution 4.0 International License.
![]()
A New Edition of Web of Science
Journal Impact Factor
2022: 0.5
Five Year: 0.8
Journal is Indexed in

Cabells Whitelist
![]()


