Bio-Synthesis of Gold Nanoparticles Through Bioreduction using the Aqueous Extract of Muntingia Calabura L. LEAF
Abdul Wahid Wahab1 , Abdul Karim1, Asmawati1 and I. Wayan Sutapa2
1Department of Chemistry, Faculty of Science, University of Hasanuddin Jl. Perintis Kemerdekaan 90245, Makassar-Indonesia.
2Department of Chemistry, Faculty of Science, University of Pattimura Jl. Ir. Putuhena No 1 Poka-Ambon, Maluku-Indonesia.
Corresponding Author E-mail: wahidwhb@yahoo.com
DOI : http://dx.doi.org/10.13005/ojc/340143
One of the plants with many functions as tradisional drug is Muntingia calabura L. leaf. It caused the leaf has high content of tannins, saponins and flavonoids. The presence of these compounds is great potential as bioreductor to produce gold nanoparticles (AuNPs). In this study has been done biosynthesis and characterization of AuNPs using the aqueus extract of Muntingia calabura L. leaf. The AuNPs obtained were characterized by UV–visible spectra, Scanning Electron Microscopy (SEM) and X-ray diffraction (XRD). Based on the results of the bioreduction process of HAuCl4 into AuNPs can be known that the AuNPs is successfully produced with optimum time 5 hours. Surface Plasmon resonance synthesis of AuNPs was obtained at a wavelength of 543.4 nm. At wavelength 660 nm is known as Longitudinal Plasma Resonance characteristic of one of AuNPs crystal form that is Au nanorod, triangular or hexagonal. The IR band analysis there can be assumed that there are three functional groups that play a role in bioreduction process of gold nanoparticle formation are C=O, C-N and -OH group. XRD difractogram showed that AuNPs is formed at 2θ = 37,82o (1 1 1), 44.05o (2 0 0), 64.43o (2 2 0) and 77.55o (3 1 1). The average crystal size using XRD analysis and PSA (Particles Size Analyzer) test are 36.93 nm and 78.2 nm respectively. The AuNPs crystals are mostly oriented (3 1 1) with an average crystal lattice length of 0.4 nm.
KEYWORDS:Gold Nanoparticles; Muntingia Calabura L. leaf; Biosynthesis; Crystal; XRD; UV-VIS
Download this article as:| Copy the following to cite this article: Wahab A. W, Karim A, Asmawati A, Sutapa I. W. Bio-Synthesis of Gold Nanoparticles Through Bioreduction using the Aqueous Extract of Muntingia Calabura L. LEAF. Orient J Chem 2018;34(1). |
| Copy the following to cite this URL: Wahab A. W, Karim A, Asmawati A, Sutapa I. W. Bio-Synthesis of Gold Nanoparticles Through Bioreduction using the Aqueous Extract of Muntingia Calabura L. LEAF. Orient J Chem 2018;34(1). Available from: http://www.orientjchem.org/?p=43141 |
Introduction
In recent years, precious metal nanoparticles have attracted many researchers because of their potential applications in the fields of optics, electronics, biological sensors, and catalysts. Precious metal nanoparticles that are often used in various applications are gold nanoparticles and silver nanoparticles because noble metal nanoparticles have very high extinction coefficient and optical properties that depend on particle size and shape, the dielectric constant of medium, composition and spacing between particles1–4. In general, the synthesis of nanoparticles is done by top-down method (physics) and bottom-up (chemical) method. The top-down method reduces the size of metal solids to mechanized nanostructures, whereas the bottom-up method is done by dissolving them with reducing agents and stabilizers to convert them into nanoscale5–8.
Looking at the risks and environmental impacts that can be generated and the high cost of nanoparticle synthesis methods with top-down and bottom-up methods, new innovations are needed to synthesize nanoparticles in an environmentally friendly and low cost manner. It has been found how to synthesize nanoparticles using plants or microorganisms as reducing agents to produce nanoparticles known as nanoparticle biosynthesis. The biosynthesis of metal nanoparticles using microorganisms such as bacteria, fungi and yeasts has disadvantages such as the maintenance of difficult cultures and long synthesis time9,10. Meanwhile, the biosynthesis of metal nanoparticles by utilizing plants as reducing agents such as that of 11 have utilized the leaf extract of Dalbergia sissoo to synthesize gold and silver nanoparticles provides several advantages, such as environmentally friendly, low cost and no pressure, and unnecessary toxic chemicals.
In synthesis of gold nanoparticles using plants, Au is formed by oxidation reduction reactions of Au3+ in solution with certain compounds of the plant9. Based on research12 on A. Indica plants is suspected that terpenoids and flavanoids play a role in facilitating the reduction because they have surface active molecule stabilizing. Meanwhile, compounds that play a role in the reduction process comprise several secondary plant metabolite compounds such as citronellol and geraniol terpenoid compounds, then ketones, aldehydes, amides and carboxylic acids13.
Indonesia has a wealth of about 30,000 species of plants. Many potential plants can be utilized around our neighborhood. One of them is Muntingia calabura L. better known as Kersen (Indonesia). The leaf this plant has many functions as tradisional drug. It caused the leaf has high content of secondary metabolite compounds like is tannins, saponins and flavonoids.
Currently, the research about application of Muntingia calabura L. leaf as traditional drug has been conducted. While, to the best our knowledge, there are have not been reported the utilization of the Muntingia calabura L. leaf extract to synthesize gold nanoparticles. In this study, we conducted a biosynthesis of AuNPs were characterized by UV-Vis spectrophotometry (UV-vis), X-ray diffraction (XRD), Fourier-transform infrared spectroscopy (FT- IR), Particle Size Analyzer (PSA) and Scanning electron microscopy (SEM).
Materials and Methods
Tools and Materials
The tools to be used in research are analytical scales, UV-Vis spectrophotometry (UV-vis), X-ray diffraction (XRD), Fourier-transform infrared spectroscopy (FT- IR), Particle Size Analyzer (PSA) and Scanning electron microscopy (SEM), dropper dropper, volumetric pipette, erlenmeyer, measuring flask, stirring rod. The materials are Muntingia calabura L. leaf, deionesed water, Whatman no. 42, tetrachloroauric acid (HAuCl4).
Procedure
The extraction Muntingia calabura L. leaf
The leaves of Muntingia calabura L. used is fresh. The leaves are taken and then washed thoroughly with deionized water and dried to the water of wash. Then, the leaves are cut into uniform 2 x 2 cm and weighed 1.25 grams, then boiled with 50 mL deionized water in Erlenmeyer 500 mL. The stew was allowed to boil for 5 minutes. Then, it cooled at room temperature and the boiled water was poured and filtered using Whatman no. 42. The water extract be used directly for the biosynthesis process. The water extract of Muntingia calabura L. was analyzed using FT-IR.
Synthesis of gold Nanoparticles
The biosynthesis of gold nanoparticles was carried out by mixing the HAuCl4 solution and the water extract. 2 mL of water extract was mixed into 40 mL HAuCl4 solution 25 ppm then stirred for 1, 3, 4 and 5 hours. The gold nanoparticles solution was analyzed using UV-Vis spectroscopy after 1, 3, 4 and 5 hours and 1, 3, 4 and 5 days. The gold nanoparticles solution formed was left on top of a plastic-coated site to dry to obtain a gold nanoparticles solid. Further sampling of the gold nanoparticle solids was taken to be characterized by FTIR, XRD and SEM.
Results and Discussion
Plant extracts was known with several compounds content that have the potential to reduce the gold ions and nanoparticles stabilized. The formation or growth of gold nanoparticles (AuNPs) through the reduction of Au3+ ions into Auo using plant extracts can be observed using the Vis-vis spectroscopy. The study UV-vis of AuNPs uptake measurements were performed on the synthesis using the aqueus extract leaf Muntingia calabura L. of 0.25 g/ mL with 25 ppm HAuCl4 solution at temperature of 30°C. Variations of incubation time (1, 3, 4, 5 hours) were performed to determine the growth pattern of AuNPs based on SPR bands typical for gold nanoparticles.
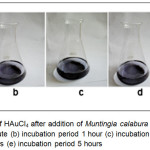 |
Figure 1: Change of color of HAuCl4 after addition of Muntingia calabura L. leaf extracts (a) incubation period 1 minute (b) incubation period 1 hour (c) incubation period 3 hours (d) incubation period 4 hours (e) incubation period 5 hours Click here to View figure |
Qualitative analysis of AuNP growth can be determined based on the specific characteristics of the surface of the gold-nanoparticle surface plasmas resonance (SPR). SPR is a collection of oscillations to the conduction electrons on the surface of the material. Spectroscopic uptake measurements at 450-660 nm wavelength range are typical peaks for the characteristics of the AuNPs Plasmon Resonance Surface (SPR) (Khalil, et al., 2012). Fig. 2 shows that an increase in UV-vis wavelength absorption of AuNPs continues to occur with increasing incubation time. Maximum absorption is obtained about 543.5 nm for a 5 hour (variation of hours), and 531.5 nm (variation of days) indicates that the Surface Plasmon resonance (SPR) occurs on the surface of the gold nanoparticles. The interaction of light that has wavelengths smaller than the AuNPs particle size causes the polarization of the free conduction electrons with respect to the heavier AuNPs ion nuclei. Therefore, electron dipolar oscillations are made and surface plasmon absorption tapes are obtained.
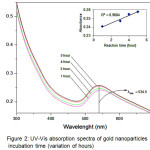 |
Figure 2: UV-Vis absorption spectra of gold nanoparticles at incubation time (variation of hours) Click here to View figure |
Furthermore from Fig. 2 it is also known that at the wavelength 660 nm is known as Longitudinal Plasma Resonance characteristic of AuNPs crystal form Au nanorod, triangular or hexagonal (12. Thus, it can be showed that the process of bioreduction of Au3+ using the aqueus extract of Muntingia calabura L. leaf can occur at 5 hours. The presence of SPR can also be observed by the change of color from clear to purple to old brown indicating the formation of gold nanoparticles as a result of the SPR phenomenon (Fig. 1).
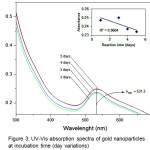 |
Figure 3: UV-Vis absorption spectra of gold nanoparticles at incubation time (day variations) Click here to View figure |
From this spectrum, we can also note the stability of AuNPs was produced by measuring the wavelength and absorbance values of time. The stability of AuNPs will decrease over time, which can lead to aggregation, the inclusion of fellow AuNPs to form larger sizes. The stability of AuNPs also can shows in shifted the maximum wave number in Fig. 2 obtained λmax AuNPs of 534.5 if synthesized in the time range of the hours. After a stability test with incubation in days (Fig. 3), λmax shifts to 531.5 nm (graph decreased model insert). This indicates that with increasing incubation time it can reduce the stability of AuNPs that are formed. However, the stability of AuNPs using bioreductor the aqueus extract of Muntingia calabura L. leaf is still maintained even though the incubation time has reached 5 days although without stablizer that marked by the absence of sediment in erlenmeyer base. The longstanding stability of AuNPs and have absorbance toward UV-vis light (have energy band gap) can potentially be used to apply as biosensor active ingredients.
Analysis Functional Group of AuNPs
FT-IR measurements were performed to identify the biomolecule compounds in Muntingia calabura L. leaf which are responsible for the reduction, capping and stabilization of the gold nanoparticle bioreduction14. Fig. 5 shows the FT-IR spectrum of the aqueus extract of Muntingia calabura L. leaf and AuNPs. The FT-IR spectrum reveals the presence of a distinct-bed functional group. The IR bands (Fig. 5a) at 3412 and 1705 cm-1 are characteristic of the O-H and C=O stretching modes derived from the group of compounds contained in flavonoids, tannins, terpenoids, saponins, and polyphenols (Fig. 4).
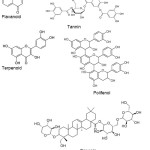 |
Figure 4: Structure of the compound within the Muntingia calabura L. leaf water extract responsible to generate AuNPs Click here to View figure |
The IR band at 2358 cm-1 is derived from the deformation vibration C-H contained in the acetal group. The other IR bands at 2929 cm-1 show the presence of CH2 having vibration stretching. In addition, the presence of IR bands at 1618 cm-1 and 1504 cm-1 shows the presence of amide and vibrational groups streching C=N contained in cayenne leaf extract. The highly sharp bands at 1045 cm-1 are generated by aliphatic C-N vibrations of the protein compounds contained in cayenne leaf extract. The IR spectra (Figure 6) of AuNPs is shown by a band of moderate intensity at 1649 cm-1 and 1541 cm-1 indicating the stretching of C=O which chelates Au metals. The stretching frequency shift of the C=O group indicates that the compound containing this functional group in cayenne leaf extract is responsible for forming gold nanoparticles.
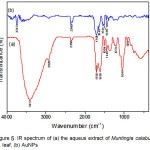 |
Figure 5: IR spectrum of (a) the aqueus extract of Muntingia calabura L. leaf, (b) AuNPs Click here to View figure |
In addition to the C=O group in the process of forming the gold nanoparticles, the OH group is also involved, indicated by the IR band at 3743 cm-1 which is the bond between O-H and Au. The reduced intensity of IR band at 1045 cm-1 (Fig. 6a) shift to 1396 cm-1 (Fig. 6b) shows the alteration of the aliphatic C-N structure of the protein after Au-binding. Thus, based on IR band analysis there can be assumed that there are three functional groups that play a role in bioreduction process of gold nanoparticle formation ie C=O, C-N and OH group.
Analysis of X-Ray Diffraction AuNPs
To analyze the crystal a property of the resulting nanoparticles is used X-ray Diffraction. Fig. 7 shows the XRD diffraction patterns generated by gold nanoparticles synthesized using the aqueus extract Muntingia calabura L. leaf after Au3+ completely reduces to Auo. The resulting diffractogram produces a fairly sharp peak which indicates that AuNPs have been formed. Diffraction peak AuNPs at 2θ = 37.82o (1 1 1), 44.05o (2 0 0), 64.43o (2 2 0) and 77.55o (3 1 1) obtained equal to those reported for metal standard gold (Au) (Joint Committee on Powder Diffraction Standards-JCPDS, USA). Thus, the XRD pattern shows that gold nanoparticles are essentially crystalline.
Using the Debye-Scherer equation can calculate the resulting AuNPs particle size. Based on the calculation using the equation D = (K.λ / β cosθ) (K is Scherer constant 0.9, λ is the wavelength Cu Kα is 1.54178 Å, β is FWHM of peak XRD and θ is the peak angle XRD) obtained the average size of AuNPs particle is 36.93 nm. With a size smaller than 100 nm it can be concluded that the AuNPs resulted by bioreduction process has been successful.
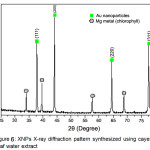 |
Figure 6: XNPs X-ray diffraction pattern synthesized using cayenne leaf water extract Click here to View figure |
Analysis using PSA
In addition to using XRD analysis, AuNPs size determination is also done using PSA. The difference between these two approaches is the sample phase used. The XRD test analysis uses a solid sample whereas the PSA test uses the sample in liquid form. On the PSA the reference measures particle size measurement based on Dynamic Light Scattering. The motion of particles in the later medium is correlated with the size of the particles owned by the AuNP. The illuminated laser light into the sample will experience fluctuations in intensity due to the particle scattering of light. The results of the distribution of nanoparticle size of AuNPs with PSA are shown in Fig. 8 and Tabel 1.
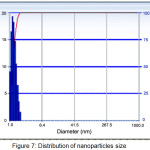 |
Figure 7: Distribution of nanoparticles size Click here to View figure |
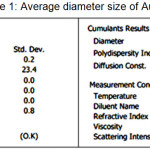 |
Table 1: Average diameter size of AuNPs Click here to View table |
Based on the PSA results in Fig. 8 and Table 2 we obtain AuNPs particle size in the solution medium of 78.2 nm. This particle size indicates that this bireduction process can produce Au particles with the nanoparticle category (still in range 1-100 nm). Although the Au particle size generated in this process is still within the range of nanoparticle size, but this size is larger than the calculation result using XRD. The difference in the results obtained caused by the nanoparticles in the liquid medium are very susceptible to aggreat (nanoparticle-combinated) resulting the particle size will be larger than in solid form. This aggregation process occurs because of the Van Der Waals force that possessed by nanoparticles as an attractive force at a certain distance in the aqueaus medium. The magnitude of force possessed by these nanoparticles can be observed in addition to experimentally also using a computational chemistry approach15.
Determination of Crystal Orientation
To determine the obtained crystal orientation, a texture analysis was performed on AuNPs (Table 2). The result of the texture orientation analysis in Table 1 shows that the plane (311) in the diffractogram 2θ: 77.55o has the highest Tc(hkl) value. Based on the results of the analysis it can be seen that the resulting AuNPs crystals are mostly oriented (311).
Table 2: TC(hkl) value of AuNPs product
|
Peak number |
2θ |
h k l |
Ihklmeasured |
Io(hkl)standard |
TChkl |
|
1 |
37.82o |
(1 1 1) |
68 |
100 |
0.10 |
|
2 |
44.05o |
(2 0 0) |
100 |
52 |
0.58 |
|
3 |
64.43o |
(2 2 0) |
58 |
32 |
0.82 |
|
4 |
77.55o |
(3 1 1) |
79 |
36 |
1.33 |
|
Peak number |
2θ |
h k l |
Ihklmeasured |
Io(hkl)standard |
TChkl |
|
1 |
37.82o |
(1 1 1) |
68 |
100 |
0.10 |
|
2 |
44.05o |
(2 0 0) |
100 |
52 |
0.58 |
|
3 |
64.43o |
(2 2 0) |
58 |
32 |
0.82 |
|
4 |
77.55o |
(3 1 1) |
79 |
36 |
1.33 |
The analysis using Scanning electron microscope (SEM) on AuNPs obtained from bioreduction obtained is shown in Fig. 9. Based on SEM results it is known that the resulting AuNPs have hexagonal shape (Figure 9). The crystallinity of AuNPs is high. This fact also supported by the XRD results in Fig. 7 which shows very high peak intensity for all crystal fields obtained.
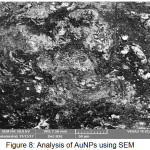 |
Figure 8: Analysis of AuNPs using SEM Click here to View figure |
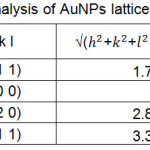 |
Table 3: Analysis of AuNPs lattice parameters Click here to View table |
Using the XRD results in Fig. 7 has also been analyzed to determine the lattice parameters for each of the resulting AuNPs crystals. The results of the crystal lattice parameter analysis (crystal lattice length) are shown in Table 3. The results of this analysis show that the average crystal lattice length of AuNPs crystals is 0.4 nm. The longest crystal grid is owned by AuNPs chrisals located at 2θ: 37.82o. This shows that the size of the crystal with the crystal plane (1 1 1) has the largest crystal size of the other.
Conclusion
Based on the results of the process of bioreduction of HAuCl4 into AuNPs and analysis has been done then it can be concluded: Bioreduction process for AuNPs synthesis was successfully done with optimum time of 5 hours. Surface Plasmon resonance synthesis of AuNPs obtained at wavelength 543.4 nm. Absorption at wavelength 660 nm is known as Longitudinal Plasma Resonance characteristic of AuNPs crystal form Au nanorod, triangular or hexagonal. Based on the IR band analysis there are three functional groups that play a role in bioreduction process of gold nanoparticle formation ie C=O, C-N and OH group. Diffractogram XRD produces a fairly sharp peak which shows that AuNPs are formed at 2θ = 37.82o (111), 44,05o (2 0 0), 64,43o (2 2 0) and 77,55o (311). The average crystal size using XRD analysis and PSA test are 36.93 nm, 78.2 nm respectively. The resulting AuNPs crystals are mostly oriented (311) with an average crystal lattice length of 0.4 nm.
Acknowledgments
Authors are thankful to Ministry of Research and Higher Education Indonesia, for the Profesorshif Grand Program Hasanuddin University on year 2017 for financial assistance to carry out the research.
References
- Moores, A.; Goettmann, F. New J. Chem. 2006, 30, 1121–1132.
CrossRef - Taei, M.; Hasanpour, F.; Dinari, M.; Dehghani, E. Measurement 2017, 99, 90–97.
CrossRef - Khodashenas, B.; Zadghaffari, R.; Jafari, S. D. Orient J Chem 2015, Vol. 31, 249–257.
- Abdulghani, A. J.; Mohuee, S. K. Orient J Chem 2017, 33, 1276–1285.
- Kesharwani, J.; Yoon, K. Y.; Hwang, J.; Rai, M. J. Bionanoscience 2009, 3, 39–44.
CrossRef - Nivedhini Iswarya, C.; Kiruba Daniel, S. C. G.; Sivakumar, M. Mater. Sci. Eng. C 2017, 75, 393–401.
CrossRef - Zhou, H.; Li, S.; Wu, Y.; Chen, D.; Li, Y.; Zheng, F.; Yu, H. Sens. Actuators B Chem. 2016, 237, 487–494.
CrossRef - Wan, Y.; Zheng, Y. F.; Wan, H. T.; Yin, H. Y.; Song, X. C. Food Control 2017, 73, 1507–1513.
CrossRef - Kumar, V.; Yadav, S. K. J. Chem. Technol. Biotechnol. 2009, 84, 151–157.
CrossRef - Mittal, A. K.; Chisti, Y.; Banerjee, U. C. Biotechnol. Adv. 2013, 31, 346–356.
CrossRef - Singh, C.; Baboota, R. K.; Naik, P. K.; Singh, H. Research Article Adv. Mat. Lett. 2012, 3, 279–285.
CrossRef - Shankar, S. S.; Rai, A.; Ahmad, A.; Sastry, M. J. Colloid Interface Sci. 2004, 275, 496–502.
CrossRef - Jha, A. K.; Prasad, K.; Prasad, K.; Kulkarni, A. R. Colloids Surf. B Biointerfaces 2009, 73, 219–223.
CrossRef - Yudha S, S.; Suharto, T. E.; Angasa, E.; Nishina, Y.; Mardlia, Z. A.; Sipriyadi Orient J Chem 2017, 33, 745–751.
- Hadanu, R.; Idris, S.; Sutapa, I. W. Indones. J. Chem. 2015, 15, 86–92.
CrossRef

This work is licensed under a Creative Commons Attribution-NonCommercial-ShareAlike 4.0 International License.

This work is licensed under a Creative Commons Attribution 4.0 International License.
![]()
A New Edition of Web of Science
Journal Impact Factor
2022: 0.5
Five Year: 0.8
Journal is Indexed in

Cabells Whitelist
![]()


