Structural Analysis of Powder Complex of Tris (1,10-phenanthroline) Copper(II) Trifluoromethanesulfonate Dihydrate
Cahyorini Kusumawardani, Lis Permanasari, Siska Dwi Fatonah and Kristian Handoyo Sugiyarto
Department of Chemistry Education, Yogyakarta State University, Indonesia.
Corresponding Author E-mail: sugiyarto@uny.ac.id
DOI : http://dx.doi.org/10.13005/ojc/330617
The powder complex of tris(phenanthroline)copper(II) trifluoromethanesulfonate dihydrate has been synthesized by direct interaction of the corresponding precursors, copper(II) nitrate, phenanthroline, and potassium triflate. The metal content found to be 6.76 % corresponds to the theoretical value of 6.77 % in [Cu(phen)3] (CF3SO3)2.2H2O. The equivalent electrical conductance producing the charge ratio of cation by anion to be 2: 1, should confirm the formula. The magnetic moment, µeff, of this complex which was to be 1.85-1.90 B.M, indicates that the complex is paramagnetic corresponding to spin-only value for one unpaired electron. UV-Vis spectrum of the complex reveals the only one broad absorption observed at about 681.50 nm (14673.51 cm-1), being associated with the spin allowed transition, 2Eg → 2T2g. The extinction coefficient of 48 Lmol-1cm-1 indicates the adoption of octahedral environment in this complex. The infrared spectrum shows absorptions of ligand group which is influenced by the metal-ligand interaction in this complex. The powder XRD of this complex was refined by Le Bail method of Rietica program and found to be fit as triclinic symmetry of space group P1.
KEYWORDS:Rietica; Le Bail; Phenantroline; Triflate; Copper (II)
Download this article as:| Copy the following to cite this article: Kusumawardani C, Permanasari L, Fatonah S. D, Sugiyarto K. H. Structural Analysis of Powder Complex of Tris (1,10-phenanthroline) copper(II) Trifluoromethanesulfonate Dihydrate. Orient J Chem 2017;33(6). |
| Copy the following to cite this URL: Kusumawardani C, Permanasari L, Fatonah S. D, Sugiyarto K. H. Structural Analysis of Powder Complex of Tris (1,10-phenanthroline) copper(II) Trifluoromethanesulfonate Dihydrate. Orient J Chem 2017;33(6). Available from: http://www.orientjchem.org/?p=39887 |
Introduction
The synthesis and characterisation of complexes containing transition metals with phenanthroline (phen) as ligand and various common counter ions such as NO3–, BF4–, ClO4–, PF6– have been reported long time ago, e.g. Ito et al.1 Triflate salts were already known as highly ionic since the corresponding acid might be considered as super-acid which is much stronger than sulphuric acid, being Hammett acidity to be -12, e.g. Raamata et al., and Howells and McCown2-3. Triflate ionic liquids are hydrolytically stable and in many cases they are the preferred reaction media in comparison to ionic liquids with the hydrolytically unstable (PF6)− or (BF4)− anions4.
In the case of coper(II) complex with phenanthroline ligand and triflate anion, the single crystals of six-coordinated site5 of [Cu(phen)3][CF3SO3]2.H2O and five-coordinated site6 of [Cu(phen)2OH2][CF3SO3]2 have been analysed. For the two complexes, the triflate anion were found to be uncoordinated to the central atom, Cu(II). The structural cationic complex of the tris-phenanthroline, [Cu(phen)3]2+, with diferent counter anions (X) have also been solved through a number of other corresponding single crystals, these are for X = (ClO4)27, S4O6.5H2O8, and (TCNQ)29. It was not surprisingly found that the corresponding tris (phenanthroline) copper (II) cation adopted different space group, triclinic or monoclinic, with various cell parameters.
No electrical, electronic spectral and magnetic data have been reported at least for the tris(phenantroline)copper(II) triflate. Moreover, the determination of lattice parameters for the powder coordination compounds by XRD has been very little attention up to now, but abundantly for the metal oxides. For those reasons, the powder complex has been prepared, the corresponding cell parameters were analysed following PXRD, and this is the main purpose of this work.
Materials and Methods
Materials
The main chemicals, copper(II) nitrate (Cu(NO3)2), 1,10-phenanthroline (C12H8N2), potassium triflate (KCF3SO3), ammonium chloride (NH4Cl), calcium chloride (CaCl2), nickel nitrate (Ni(NO3)2), and aluminium chloride (AlCl3) were purchased from Sigma-Aldrich. All the reagents were used without further purification.
Preparation of tris (phenanthroline) copper (II) Triflate
About 10 mL of an aqueous solution of 0.1 mmol Cu(NO3)2 and 5 mL solution of 0.32 mmol phenanthroline in water (with drops of ethanol to disolve) were mixed. The mixture was well stirred and heated to obtain a homogeneous solution. To this solution, an excess of saturated aqueous solution of KCF3SO3 (0.4 mmol in 5 mL of water) was added. The mixture was concentrated on warming, and the obtained powder on cooling was then filtered, rinsed with a minimum of cold water, and then dried in aeration.
Instruments
Magnetism. The magnetic data for solid sample were obtained only at room temperature by using Magnetic Susceptibility Balance (MSB) of Auto Sherwood Scientific 10169 model, calibrated with CuSO4.5H2O. The molar magnetic susceptibility data were then corrected for diamagnetism calculated using Pascal’s constant10. The corresponding effective magnetic moment (μeff) was then calculated from the corrected molar magnetic susceptibility following the general formula, μeff = 2.828 √ (χM.T) BM.
Electronic and Infrared Spectra. The electronic spectrum of the solid sample was recorded on Pharmaspec UV 1700 spectrophotometer. Whereas in solution it was recorded on Spektrofotometer UV-Vis Shimadzu 2400 PC Series. The powders were spread on a 2×2 cm particular thin glass adhered with ethanol. The fitting was then placed in the cell holder and the spectrum was recorded at 400-1000 nm. The infrared spectrum of the powdered sample which were pressed on the cell was recorded on an infrared spectrophotometer FTIR Shimadzu Prestige 21 at 500 – 4000 cm-1.
Metal Content and Ionic Property. The metal content in the sample was calculated based on the data recorded using an Atomic Absorption Spectrophotometer of Shimadzu AA-6650 model. While the ionic property was estimated by recording the electrical (equivalent) conductance by using a conductometer calibrated with an aqueous solution of 1 M potassium chloride at 250. The obtained data of sample was compared to those of known ionic solutions, NH4Cl, CaCl2, Ni(NO3)2, and AlCl3, which were also recorded with the same conductometer.
Powder X-Ray Diffraction. The diffractogram of the complex was recorded on a Rigaku Miniflex Benchtop Diffractometer, CuKα: λ=1.5406 Å. The powdered sample was spread on the glass plate and then was placed on the cell holder. The reflection data were recorded in scan mode at 2-90 degree of 2θ with interval of 0.02 and rate of 10. The resulting diffractogram was then analysed by Rietica program of Le Bail method at 5-60 degree of 2θ, which was run within 30 cycles.
Results and Discussion
Chemical Formula of the Complex
Phenanthroline is generally known as stable compound when complexation in various solvents, and thus no decomposition to others is expected. Therefore, direct interactions of phenanthroline and copper(II) salt in solution should produce the blue cationic phenanthroline complex which could be precipitated on the addition of triflate salt. The electrical conductance of this complex was recorded with respect to the known ionic simple compounds in aqueous solution, and the result is shown in Table 1. It suggests that the corresponding value is very close to the range of those containing three ions per molecule, and thus the possible empirical formula of Cu(phen)n(CF3SO3)2.xH2O was then proposed for this powdered complex.
Table 1: Electrical equivalent conductance of the complex and some known salts (*) Sugiyarto et al., 2017)24
| Compounds | Equivalent conductance(Λc) Ω-1cm2mol-1 | Ratio of cation/anion | Number of ions |
| NH4Cl | 67.04 | 1 : 1 | 2 |
| CaCl2 | 118.8 | 1 : 2 | 3 |
| Ni(NO3)2 | 124.21 | 1 : 2 | 3 |
| AlCl3 | 232.9 | 1 : 3 | 4 |
| Mn(phen)n(CF3SO3)2·xH2O*) | 101.5 | 1 : 2 | 3 |
| Cu(phen)n(CF3SO3)2·xH2O | 95.7 | 1 : 2 | 3 |
Metal content obtained from atomic absorption spectral data (6.76%) suggests that the number of phenanthroline molecules, n, and the number of hydrates, x, could then be estimated, and the formula of Cu(phen)3(CF3SO3)2.2H2O as in Table 2, might satisfy as expected from the stoichiometric preparation. The conductivity data of this complex confirms the highly ionic property of the triflate salts2,4,11.
Table 2: The proposed formula of complex following the metal content
|
Compound |
Metal content | |
| Theoretic calculation (%) | AAS result (%) | |
|
Cu(phen)3(CF3SO3)2 |
7.04 | 6.76 |
|
Cu(phen)3(CF3SO3)2·1H2O |
6.90 | |
|
Cu(phen)3(CF3SO3)2·2H2O |
6.77 | |
|
Cu(phen)3(CF3SO3)2·3H2O |
6.64 | |
The Magnetic Moment
The magnetic susceptibility data obtained on the measurement (Table 3) were then calculated to the magnetic moment based on the estimated formula as in Table 2, and the result of the three samples separatedly preparared in fact to be paramagnet, 1.85-1.90 BM. It is a slightly higher than the spin-only value for the one unpaired electron in the d9 electrons of Cu(II), as also observed in the corresponding hexafluorophosphate, 1.85 BM, which was reported to obey the Curie-Weiss law12.
Table 3: Magnetic data of Cu(phen)3(CF3SO3)2.2H2O at room temperature
| Sample | χg x 10-6 (cgs) | Magnetic Moment (BM) |
| 1 | 1.031 | 1.85 |
| 2 | 1.080 | 1.88 |
| 3 | 1.122 | 1.90 |
The Electronic Spectrum
The electronic spectrum of the complex in solution was recorded at 400-1000 nm and shown in Fig. 1 (inset) together with that of starting material, the copper(II) nitrate (1a). It reveals clearly that the main band was definitely shifted to higher energy (about 14673 cm-1) in the phenantroline-copper(II) complex (1b) from the lower energy (about 12000 cm-1) in the starting material. This indicates that the phenanthroline has replaced the aqueous-copper(II) resulting in a stronger ligand field band. The extinction coefficient of about 48,1 L mol-1 cm-1 suggests the octahedral environment of central atom, and therefore, the band might be attributed to the spin allowed transition 2Eg →2T2g in copper(II). This band is quite comparable to the corresponding perchlorate13, 14815 cm-1. This reflects the presence of ligand field strength of phenanthroline surrounding Cu(II) metal ion, and thus supports the formula proposed.
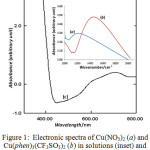 |
Figure 1: Electronic spectra of Cu(NO3)2 (a) and Cu (phen)3 (CF3SO3)2 (b) in solutions (inset) and powder Cu (phen)3 (CF3SO3)2 (c). |
In powder (Fig.1c) the spectrum shows clearly a more asymmetric shoulder band that is likely split into two bands concentrated at about 14085 cm-1 and at 15380 cm-1, indicating a strongly octahedral distortion, being associated with Jahn-Teller effect. The distorted octahedral configuration is so common in copper(II) complexes as reported from single crystal sructure of the corresponding perchlorate7, the hexafluorophosphate12, and of the triscyanomethanide14.
The Infrared Spectrum
In general, the spectral shape of the phen and bipy complexes is quite similar14. Thus, the effect of chelation has been reported to shift the absorption bands of the functional group in the two ligands15-16. In this work as shown in Fig. 2, the infrared spectrum of this complex recorded at 500-4000 cm-1 reveals the ring modes (νC-C and νC-N) of phen at about 3067, 2299-1925, 1510, 1427, 1350 and 1215 cm-1, and the ring deformation near 725 cm-1, being quite similar to those observed in chelation of another Cu(II)-phen complex16.
![Figure 2: Infrared spectrum of [Cu(phen)3] (CF3SO3)2.2H2O](http://www.orientjchem.org/wp-content/uploads/2017/11/Vol33No6_Str_Cah_fig2-150x150.jpg) |
Figure 2: Infrared spectrum of [Cu(phen)3] (CF3SO3)2.2H2O |
In the case of triflate ion, the infrared of some metallic triflate salts are used as comparison15-18, and therefore, the corresponding infrared spectrum can be readily assigned. The modes of vibrations observed at 1280 and 1149 cm-1 are to be SO3 and CF3 asymmetric stretching modes, respectively, while those at 1030 and 1225 cm-1 are SO3 and CF3 symmetric stretching modes, respectively. The bands at 780 and 636 cm-1 are likely deformation symmetry of CF3 and SO3, respectively, and the bands at 580 and 517 cm-1 are deformation asymmetry of CF3 and of SO3, repectively. Therefore, the infrared data strongly suggest that the complex sample should contain the chelation of phen to copper(II) and free triflate anion.
The occurence of lattice water is likely indicated in the spectrum19. Thus, the mode observed at about 1624 cm-1 in the spectrum might be due to free molecule of (bending) H2O5 as also proposed by Sinha15. Moreover, broad absorption at about 3500-3600 cm-1 should be clearly due to symmetric-antisymetric streching mode of -OH of H2O5,19.
The Powder X-Ray Diffaction and Structural Analysis
The single crystals of cation [Cu(phen)3]2+ with some particular anions have been reported5,7-9,12,14. The tetrathionate pentadydrate8 adpots triclinic symmetry of the space group, P1, and similarly for the tetracyanoquinodimethanide monoethanol9. Both of them, however, show much different in the cell parameters (Table 3). While for the tricyanomethanide14 and the perchlorate7, they are monoclinic symmetry but with different space group of P21/n for the former and of C2/c(15) for the latter. Again the cell parameters are quite different between the two. For the hexafluorophosphate12, it is also monoclinic of space group C2/c but with much longer in a direction compared to the perchlorate, resulting in much bigger in volume of the cell. Another single crystal of the triflate monohydrate5,[Cu(phen)3](CF3SO3)2. H2O, in fact has also been reported and it was found to be triclinic system of the space group, P1. The cell parameters are quite similar to the corresponding tetrathionate pentahydrate. The cationic complex with those various counter anions confirm that the tris-chelate phenantroline ligands were coordinated to the metal atom. It has been reported that two single crystals of another complexes, [Cu(bipy)3](ClO4)2 have been separately produced13,20 to have significantly difference in cell parameters, though they are the same symmetry and space group.
2·2H2O (black sign +, a), and of refined triclinic space group of P1 model (red full line, b)](http://www.orientjchem.org/wp-content/uploads/2017/11/Vol33No6_Str_Cah_fig3-150x150.jpg) |
Figure 3: Diffractogram of [Cu(phen)3](CF3SO3)2·2H2O (black sign +, a), and of refined triclinic space group of P1 model (red full line, b) |
with it’s posision of 2 theta (blue bars, c), and the difference between the black observed and the red refined model (green, d).
From those facts, the powder X-ray diffraction of [Cu(phen)3](CF3SO3)2·2H2O was then recorded, and the diffractogram together with its refinement following Le Bail method of Rietica program is shown in Figure 3. The black signs (+) represent the observed experimental data, the red full line is the refinement at 5-55 degree of 2 theta for the expected model of triclinic symmetry of space group P1 which are the blue bar-lines, and the green curve indicates the difference between the observed diffractogram and the analysis result. It is clear that the red full line does almost pass through the black observed data, and it is demonstrated by the almost flat green curve, indicating that the corresponding analysis might be considered very good with the Goodness of Fitting (GOF) to be 28.58 and derived Bragg R-Factor of 0.03. Detailed results of cell parameters of the crystal structure are presented in Table 4 together with the known single crystal data of the same cation of those anions discussed.
It has been stated that the application of Rietica program has not been performed to many powdered complexes. The first fitting might come from Zhu, Wu, and Le Bail himself21 (1999) who demonstrated the fitting for powdered of cobalt complex containing monodentate of ammine. It resulted in very low R factors, being 0.053 for RBragg, 0.1 for Rp, 0.119 for Rwp and 0.04 for Rexp leading to 8.85 for χ2 (GOF). The next applicationwas performed on powdered complexes containing bipy partially22 in 2008 with reasonably good fittings resulted in derived Bragg R-factors of 0.0048-0.0128 and c2 of 1.9-9.75. The application of Le Bail method was also performed on oxcalate complexes23 in 2009, and in fact resulting in much high values of R factors, being 16.4-17.9 for Rp, 13.3-13.58 for Rwp and high values of 279.36-290 for (Rwp/Rexp)2 or χ2. Recently24, Sugiyarto et al. (2017) reported the powder XRD for the complex of [Mn(phen)3](CF3SO3)2.6.5H2O, with the R values of 3.67 (Rp), 7.34 (Rwp) and 3.61(Rexp) leading to χ2 value of 4.13, and 0.16 (RBragg). Concerning how low of R factors, “How good is good enough” of the fitting25 is in fact still not so easy to conclude as discussed by Toby (2006). Quite recently26, Kusumawardani et al. (2017) reported the powder XRD for the complex of Cu(bipy)3(CF3SO3)2.(0.5-1) H2O, with the R values of 5.50 (Rp), 9.94 (Rwp) and 2.68 (Rexp) leading to χ2 of 13.72, and 0.02 (RBragg). From those reasons, there is no doubt that the complex in this work might be considered to adopt triclinic symmetry of the space group, P1, with the R’s values of being reasonably low.
In principle, it is possible and promising to draw the molecular structure of the (cationic) complex based on the hkl produced by the fitting, however, it is still very hard struggling.
Table 4: Detailed cell parameters of [Cu(phen)3]X, where X= (CF3SO3)2·2H2O (a)*, (CF3SO3)2·H2O (b)5, (S4O6)·5H2O (c) 8, (TCNQ)2·0.5 C2H5OH (d) 9, (C(CN)3)2 (e)14, (ClO4)2 (f)7, and (PF6)2 (g)12; (a)*This work due to Le Bail method of Rietica program.
| (X) | (a)* | (b)5 | (c)8 | (d)9 | (e)14 | (f)7 | (g)12 |
| Symmetry | Triclinic | Triclinic | Triclinic | Triclinic | Monoclinic | Monoclinic | Monoclinic |
| Space Grup | P1 | P1 | P1 | PI | P21/ n | C2/c (15) | C2/c |
| α (Å) | 9.96201 | 10.7448(3) | 11.232(4) | 21.945(5) | 9.3854 | 35.98(5) | 54.836(8) |
| b (Å) | 39.89891 | 13.4992(3) | 13.569(6) | 11.106(3) | 31.179 | 15.97(3 | 15.9230(1) |
| c (Å) | 17.19187 | 14.8755(4) | 14.654(6) | 10.186(3) | 12.7972 | 12.20(3) | 12.2990(1) |
| V (Å) | 6776.3286 | 1897.10(8) | 2012.6(14) | 2450.4 | 3744.2 | 6864 | 10708(2) |
| α (°) | 95.92929 | 104.1650(10) | 99.67(1) | 86.50(5) | 90 | 90 | 90 |
| β (°) | 86.18185 | 104.2840(10) | 99.44(1) | 84.41(6) | 91.084 | 101.7(3) | 94.382(2) |
| γ (°) | 92.65168 | 105.7230(10) | 109.75(1) | 83.21(4) | 90 | 90 | 90 |
| Rp | 5.19 | ||||||
| Rwp | 10.65 | ||||||
| Rexp | 1.99 | ||||||
| Z | 4 | 2 | 2 | 2 | 4 | 8 | 12 |
| GOF: χ2 | 28.58 | 1.046 | n.a | n.a | n.a | n.a | 1.05 |
| RBragg | 0.03 |
Conclusion
The powder complex of [Cu(phen)3](CF3SO3)2·2H2O has been synthesized. The magnetic moment was found to be 1.85-1.90 BM, being normal paramagnet for an unpaired electron of Cu(II). In solution the electronic spectral property show a slight asymmetry band concentrated at about 14673 cm-1, but in the powder it reveals an asymmetry shoulder band concentrated at about 14085 cm-1 and 15380 cm-1 which is attributed to the spin allowed transition, 2E→2T2. The infrared spectrum of the complex shows the typical vibrations of the functional groups of phen and the corresponding uncoordinated triflate anion. The Powder X-Ray Diffraction analysed by Rietica program of Le Bail method suggests that the complex adopts triclinic symmetry of space group P1 with the derived Bragg R-factor, 0.03.
Acknowlegment
The authors thank to the Faculty of Mathematics and Natural Science, YSU, due to the funding of DIPA-2015 for this work.
References
- Ito, T.; Tanaka, N.; Hanazaki, I.; Nagakura, S. Bull. Chem. Soc. Japan. 1969,42, 702-709.
CrossRef - Raamata, E.; Kaupmeesa, K.; Ovsjannikova, G.; Trummalb, A.; Kütta, A.; Saamea, J.; Koppela, I.; Kaljuranda, I.; Lippinga, L.; Rodimaa, T.; Pihla, V.; Koppela, I. A.; Leitoa, I. J. Phys. Org. Chem. 2013, 26, 162-170.
CrossRef - Howells, R.D.; McCown, J.D. Chem. Reviews, 1977, 7(1), 69-92.
CrossRef - Ignat’ev, N.V.; Barthen, P.; Kucheryna, A.; Willner, H.; Sartori, P. Molecules, 2012, 17, 5319-5338.
CrossRef - Sletten, J.; Julve, M. Acta Chem. Scand.1999, 53, 631-633.
CrossRef - Murphy, G.; Murphy, C.; Murphy, B.; Hathaway, B. J. Chem. Soc., Dalton Trans.1997, 2653-2660.
CrossRef - Anderson, O.P. J. Chem. Soc., Dalton Trans. 1973, 1237-1241.
CrossRef - Freire, E.; Baggio, S.; Baggio, R., Garland, M.T. Acta Crystallogr., Sect. C. 1998, 54, 464-468.
CrossRef - Bencini, A.; Midollini, S. Zanchini, C. Inorg. Chem. 1989, 28, 1963-1969.
CrossRef - Figgis, B.N.; Lewis, J.; Modern Coordination Chemistry, Edited by Lewis, J.; Wilkins, R.G.; Interscience: New York, 1960: 400.
- Johnston, D.H.; Shiver, D.F. Inorg. Chem. 1993, 32, 1045-1047.
CrossRef - Seco, J.M.; Garmendia, M.J.; Quiros, M. J. Coord. Chem. 2002, 55(3), 345-351.
CrossRef - Majumdar, P.; Ghosh, A. K.; Falvello, L. R.; Peng, S. M.; Goswami, S. Inorg. Chem. 1998, 37, 1651-1654.
CrossRef - Potočňák, I.; Pohlová, M.; Wagner, C.; Jäger, L. Acta Cryst. 2002, E58, m595-m596.
- Sinha, S. P.; Spectrochim. Acta. 1964, 20, 879-886.
CrossRef - Campos-Vallette, M.M.; Clavijo, R.E.; Mendizabal, F.; Zamudio, W.; Baraona, R.; Diaz, G. Vibrational Spectroscopy. 1996, 12, 37-44.
CrossRef - Miles, M.G.; Doyle, G.; Cooney, R.P.; Tobias, R.S. Spectrochim. Acta Part A. 1969, 25(9), 1515-1526.
CrossRef - Lawrance, G.A. Chem. Rev. 1986, 86, 17-33.
CrossRef - Nakamoto, K., 1997. Infrared and Raman Spectra of Inorganic and Coordination Compounds, Fifth Edition, Wiley, New York, p. 53 and refs. therein.
- Anderson, O.P. J. C. S. Dalton, 1972, 2597-2601.
- Zhu, J.H.; Wu, H.X.; Le Bail, A. Solid State Sci. 1999, 1, 55-62.
CrossRef - Marques, J.; Anjo, L.; Marques, M.P.M.; Santos, T.M.; Paz, F.A.A.; Braga, S.S. J. Organometallic Chem., 2008, 693, 3021-3028.
CrossRef - Martak, F.; Onggo, D.; Ismunandar; Nugroho, A.A.; Mufti, N.; Yamin, B.M. Current Research in Chemistry, 2009, 1, 1-7.
CrossRef - Sugiyarto, K. H.; Saputra, H. W.; Permanasari, L.; Kusumawardani, C. Proceedings of the International Conference on Education, Mathematics and Science 2016 (ICEMS2016), AIP Conference Proceedings, 2017, 1847, (040006)-1 – 7.
- Toby, B.H. Powder Diffraction, 2006, 21(1), 67-70.]
CrossRef - Kusumawardani, C.; Kainastiti, F.; Sugiyarto, K.H.; Chiang Mai J. Sci. 45(X) : 1-9 (To be published, accepted in 12 June 2017).

This work is licensed under a Creative Commons Attribution 4.0 International License.
![]()
A New Edition of Web of Science
Journal Impact Factor
2022: 0.5
Five Year: 0.8
Journal is Indexed in

Cabells Whitelist
![]()


