Parametric Study in Production of Virgin Coconut Oil by Fermentation Method
Zuhrina Masyithah
Department of Chemical Engineering, Faculty of Engineering, Universitas Sumatera Utara Jalan Almamater, Medan 20155, Indonesia.
Corresponding Author E-mail: zuhrina@yahoo.com
DOI : http://dx.doi.org/10.13005/ojc/330647
Fermentation by using Saccharomyces cerevisiae is a potential method to produce the Virgin Coconut Oil (VCO). A parametric study using Box-Behnken design was used to evaluate interaction effect of stirring speed, inoculum concentration and fermentation time on the percentage of oil recovery. The results indicated that fermentation time is most significantly affecting the rate of oil recovery. The surface and contour plots show that the oil recovery is gained up to 88.607% for stirring speed of 175-250 rpm, inoculum concentration of 0.2-0.3% (w/v), and fermentation time of 16-24 h. GC analysis results indicate that the high lauric acid content of 53.0249%, is obtained when stirring speed of 200 rpm, inoculum concentration of 0.3% (w/v) and fermentation time of 24 h. A parametric study has been successfully implemented in the production of VCO using fermentation method with the coefficient of determination (R2) of 97.57%.
KEYWORDS:Box-Behnken Design; Fermentation; Saccharomyces Cerevisiae; Virgin coconut oil
Download this article as:| Copy the following to cite this article: Masyithah Z. Parametric Study in Production of Virgin Coconut Oil by Fermentation Method. Orient J Chem 2017;33(6). |
| Copy the following to cite this URL: Masyithah Z. Parametric Study in Production of Virgin Coconut Oil by Fermentation Method. Orient J Chem 2017;33(6). Available from: http://www.orientjchem.org/?p=39699 |
Introduction
Coconut oil is well accepted by the consumer as a functional food oil, and the demand for this oil in baking industries, processed foods, infant formulae, pharmaceuticals, and cosmetics continues to increase [1,2,3]. Recently, the trend towards producing coconut oil is no longer through a dry process, that is refining bleaching and deodorizing process (RBD process), but rather through a wet process, which coconut oil was extracted from coconut milk [4,5]. This process appears more desirable due to the free usage of chemical solvents, thus environmental friendly than the solvent extraction. The coconut oil resulting through a wet process is called Virgin Coconut Oil (VCO). VCO is more beneficial since the mode of extraction retains more biologically active components such as vitamin E and polyphenols [6,7].
VCO contains more than 90% of saturated fatty acids, and more than 70% are medium chain triglyceride (MCT), which is MCT more rapidly absorbed and hydrolyzed in the body [8]. These properties make MCT preferred carrier for flavors, vitamins, essences, and colors and can be further processed into emulsifier and biodiesel [6,9]. VCO with more than 50% lauric acid has been proved that the body could convert it into monolaurin. Monolaurin is antimicrobial and antiviral activity. Moreover, it is used as anti obesity treatment [10,11,12].
VCO manufacturing technology through a wet process is diverse, namely enzymatic, fermentation and centrifugation [1,3,4]. Some are considered as an inferior quality product, which indicated by high moisture and free fatty acid content [13]. This product is easy to be rancid, turned brown and exhibited relatively short lifetime. Fermentation process has more beneficial and safety effect rather than other wet process methods [14,15]. Coconut milk fermentation process using minimal energy produces VCO with low rancidity, longer shelf life, bright color and the aromatic is typical of coconut oil [2,10].
Saccharomyces cerevisiae is a potential microbial starter for extracting VCO through fermentation system. S. cerevisiae is mold and able to separate the layers of fermented in a short time [16]. During the fermentation process, the microbe produces enzymes protease and lipase. This enzyme acts as a breaker of molecules contained in coconut milk to produce coconut oil [6].
Fermented coconut milk has been affected by several parametric factors namely pH, temperature, stirring speed, inoculum concentration, fermentation time, and types of bacteria [2,4,5,15]. So far, the effect of each variable on the yield of VCO produced has been reported widely. However, the effect of the interaction of parametric factors simultaneously to yield VCO is still limited.
This study is aimed to observe the impact of three major factors affecting the fermentation of coconut milk; they are the stirring speed, the concentration of inoculum added to the process, and fermentation time. The methods of observations were carried out simultaneously to obtain the effect of the interaction of parametric factors and the optimum conditions that could be achieved [17,18]. Optimization is one of the most important engineering tools for creating a process that is economical, safe, and environmentally benign throughout the whole lifetime of the plant [19,20].
Interaction effects were observed using RSM with the Box-Behnken design. RSM is a sequential procedure with an initial objective to lead the experiments rapidly and efficiently to the general vicinity of the optimum. RSM is preferred because of its responsible high efficiency, and it can simultaneously consider several factors at many different levels and corresponding interactions among these factors using a small number of observations [16,21]. Through these methods, the effect of interactions on every two factors to response variable (the percentage of oil recovery) is observed.
Bearing the explanation above, the objectives of the study reported in this paper are to develop a response surface method using Box-Behnken design and to evaluate the interaction effect of three dominant parametric factors that can be increased VCO production in the fermentation process using Saccharomyces cerevisiae.
Materials and Methods
Materials
Uniformly sized of a 12 (twelve) month old (matured) nuts were collected from the local market where the study was carried out. Yeast (Saccharomyces cerevisiae) was a commercial yeast namely Le Saffre® from PT. Saf Indonusa, Indonesia. All chemicals and solvent used were of analytical grades.
Experimental Design
RSM with Box-Behnken design was used to analyze the interaction effect between the variable of fermentation of coconut milk. The Minitab 17® trial version software (Minitab Inc. USA) was used for design and regression analysis of the experimental data. The experimental design was carried out by three independent parameters with three levels (-1, 0, +1) as shown in Table 1. The independent parameters were as follows: stirring speed (rpm), inoculum concentration (% w/v), and fermentation time (h). The response (dependent parameter) was oil recovery (%). A Box-Behnken design and three replications at the center point (leading to a total number of 15 experiments) were employed for optimization of fermentation condition. The experimental data were analyzed by RSM to fit the second-order polynomial equations [22].
Fermentation of Coconut Milk
The endosperm of mature coconut was made into a viscous slurry and squeezed through cheese cloth to obtain fresh coconut milk. Fresh coconut milk was added to distilled water with the ratio of 1:1 and then it was extracted for 30 minutes in a separation funnel to produce two layers. The bottom layer was water (skimmed), and the upper layer was coconut milk. Both layers were then separated. In the coconut oil, the acetate acid was added to increase pH 4. Then, the coconut oil was stirred at 100-300 rpm for 20 minutes. At the time of stirring, the S. cerevisiae 0.1-0.3% (w/v) was added. The mixture was then left to stand for 8-24 h at room temperature. As the layers of oil and water became separated, the upper oil layer was directly decanted. The acquired oil was prepared in duplicate and kept refrigerated until further use. This procedure was modified from the method of Prapun et al. [4] and Mansor et al. [10].
Oil Recovery
The determination of oil recovery was calculated according to the initial oil content in the coconut milk to the oil extracted [10]. The official AOAC Soxhlet method [23] and Gerber method using Gerber butyrometer [24] were applied to ascertain the oil content in the coconut milk. The oil recovery was determined by the following equation [4,10].
Fatty Acids Analysis
Fatty acid composition in VCO was analyzed by Gas Chromatography instrument (HP6890) equipped with a flame ionization detector (FID) and a high-temperature 190-200oC, flow rate 1.0 cm/s, fused silica capillary column (3 m length), and volume of sample injection was 4 (four) μL [5]. Fatty acids were identified by comparing their retentions times with those of individually purified standards.
Statistical Analysis
The experimental data in Table 1 were analyzed by response surface regression procedures of Minitab 17® trial version software to fit the following second-order polynomial equation of the form:

where Y = oil recovery (%) ; X1 = stirring speed (rpm); X2 = inoculum concentration (% w/v); X3 = fermentation time (h); b0 = intercept (constant); bi = linear coefficient; bii = quadratic coefficients; bij =cross product coefficient [20]. The regression analysis, statistical significance and response surfaces were done using Minitab 17® trial version software package.
Results and Discussion
The production of VCO from coconut milk using S. cerevisiae was performed. These microbes are expected to separate the layers of fermented in short time. During the fermentation process, S. cerevisiae would produce the enzymes protease and lipase, which would break down the protein molecules surrounding the oil in coconut milk [3,10]. In this period the oil phase would be separated to the liquid phase.
Optimization of VCO Production by Regression Analysis
Acquisition of coconut oil through a fermentation process is generally low [14]. Hence, it is important to improve the acquisition by studying the relationship between the parameters, in which significantly influence the fermentation process.
In the present study, the levels of parameters (stirring speed, inoculum concentration and fermentation time) and the effect of interaction on fermentation process are determined by the Box-Behnken design of RSM. Table 1 shows the independent parameters, levels, and factorial design in term of coded and actual and the experimental values as well. Out of total 15 experiments, the treatment number 12 (stirring speed 200 rpm, inoculum concentration 0.3% (w/v), and fermentation time 24 h) provides the greatest yield (92.73%). Whereas the treatment number 5 (stirring speed 100 rpm, inoculum concentration 0.2% (w/v), and fermentation time eight h gives the lowest yield (30.58%).
Table 1: The independent variables, levels, and factorial design in term of coded and actual, together with the experimental values
| TestRun |
Coded (Actual) Variables |
|||
| Stirring Speed, X1 (rpm) | Inoculum Concentration,X2 (% w/v) | Fermentation Time, X3 (h) | Oil Recovery,Y (%) | |
| 1 | -1 (100) | -1 (0.1) | 0 (16) | 44.75 |
| 2 | 1 (300) | -1 (0.1) | 0 (16) | 78.34 |
| 3 | -1 (100) | 1 (0.3) | 0 (16) | 71.34 |
| 4 | 1 (300) | 1 (0.3) | 0 (16) | 82.98 |
| 5 | -1 (100) | 0 (0.2) | -1 (8) | 30.58 |
| 6 | 1 (300) | 0 (0.2) | -1 (8) | 40.26 |
| 7 | -1 (100) | 0 (0.2) | 1 (24) | 73.84 |
| 8 | 1 (300) | 0 (0.2) | 1 (24) | 91.25 |
| 9 | 0 (200) | -1 (0.1) | -1 (8) | 43.64 |
| 10 | 0 (200) | 1 (0.3) | -1 (8) | 65.27 |
| 11 | 0 (200) | -1 (0.1) | 1 (24) | 82.82 |
| 12 | 0 (200) | 1 (0.3) | 1 (24) | 92.73 |
| 13 | 0 (200) | 0 (0.2) | 0 (16) | 85.94 |
| 14 | 0 (200) | 0 (0.2) | 0 (16) | 91.32 |
| 15 | 0 (200) | 0 (0.2) | 0 (16) | 88.56 |
The regression analysis taken shows that the second-order polynomial model is an adequate representation of the actual relationship between the response and significant parameters with small p value (<0.05) and satisfactory coefficient of determination (R2). The high value of R2 = 0.9757 means that the quadratic regression model can be employed to explain the fermentation process. The smaller the p values the significant is the corresponding variables [18,20].
The analysis also shows that the most important factors are the linear term of the stirring speed (X1) and fermentation time (X3) and the quadratic term of stirring speed (X1X1) and fermentation time (X3X3). The linear term of inoculum concentration (X2), the interaction between stirring speed and inoculum concentration (X1X2), and inoculum concentration and fermentation time (X2X3) are significant but less important. The interaction between stirring speed and fermentation time (X1X3) and the quadratic term of inoculum concentration (X2X2) do not produce a significant effect on the VCO production within the designed intervals.
The best fitting of response function can be described by Eq. 3.

where Y is the percentage of oil recovery, and X1, X2, X3 are the stirring speed, inoculum concentration and fermentation time, respectively.
Analysis of the Response Surface
To study the effect of the three parameters as well as their interactions on the fermentation of coconut milk, response surface, and contour plots are generated using software Minitab 17® trial version, as shown in Figure 1-3. The two-dimensional contour plot describes the interactive effect between a pair of independent parameters with the other one maintained at the respective zero level.
Figure 1 shows the VCO synthesis interactive effects of inoculum concentration and stirring speed. The surface plot in Figure 1 indicated that the oil recovery could be achieved up to 90% at the middle level stirring speed and the highest level of inoculum concentration. Contour plot in Figure 1 illustrates more clearly that the increase of inoculum concentration and stirring speed both of them increases the percentage of oil recovery. In the range of observed values, further increasing the stirring speed reduces the amount of oil recovery. As the result of analysis of variance, the contour plots in Figure 1 shows a significant interaction between inoculum concentration and stirring speed. The optimal oil recovery is around 90% at inoculum concentration 0.2-0.3% (w/v) and stirring speed 175-250 rpm.
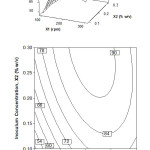 |
Figure 1: Surface and contour plot of oil recovery, Y (%), as function of inoculum concentration, X2 (% w/v) and stirring speed, X1 (rpm) at fermentation time, X3 = 16 h Click here to View figure |
When the inoculum concentration rises, there is more S. cerevisiae is available to produce the proteolytic enzymes. The function of enzymes is to separate the peptide bonds of proteins in coconut milk. The more proteolytic enzymes, the more the oil can be extracted from the protein clumps [4,15,]. Hence, the higher percentage of oil recovery can be produced.
As for the stirring speed, an optimum speed of stirring is needed to get the maximum mass transfer. The increasing of stirring speed is initially aimed to increase the mass transfer through the increasing of fluid turbulence. However, in Figure 1, it can be seen that further increasing of stirring speed decreases mass transfer. It is indicated by, the decreasing of oil recovery percentage. It is due to the fact that after gaining the optimum value in which the coconut oil has been produced the maximum in the mixture, the viscosity of the mixture is increased and thus, the laminar flow is occurred (Reynolds number is low). The laminar flow means reduced mass transfer. Although the stirring speed is an increase, it cannot increase the yield of coconut oil and it fact, and the oil recovery is reduced. The result is consistent with that report of Bregas et al. [25], the increasing of stirring speed ends with the decreasing the oil mass transfer coefficient.
The relationship between fermentation time and inoculum concentration with oil recovery is shown in Figure 2. The data were obtained at the stirring speed of zero level (constant at 200 rpm). The surface plot indicates that the inoculum concentration is significantly increasing the oil recovery to the fermentation time. It is also proved by the contour plot shown in Figure 2 that the oil recovery is optimum at the inoculum concentration of 0.15% (w/v) and fermentation time more than 20 h. For fermentation time of 15 h, the optimum oil recovery can be obtained when the inoculum concentration is maximum (0.3% w/v).
From these results and for the economic reason, the optimum fermentation to produce VCO can be concluded at the inoculum concentration of 0.15% (w/v) and the fermentation time of 18 h. Under this condition, the oil recovery can be obtained about 90%. In short, it is the best compromise state among the optimum results where there is worth amount of inoculum concentration and the short of fermentation time.
The addition of S. cerevisiae as inoculum uses carbohydrate in the coconut milk as the primary energy source. As a result, the coconut milk substrate is broken because the bonding among carbohydrate, fats, and protein becomes loose and finally detached [26,27]. Also, when S. cerevisiae hydrolyze the carbohydrate (glucose), then acetic acid and water are produced. In the final process, there are three layers are created, they are water in the bottom layer, oil at the mild layer and clumps of protein at the top layer. Moreover, the acid can detach the bonding of fats and proteins, and thus, the more fats are released from protein [10]. Based on this facts, the increasing of fermentation time and inoculum concentration resulting in the increasing of oil recovery but fermentation time and inoculum concentration should be standby at the optimum value in order to avoid the examine water produced as “by product.”
From Figure 2, it can be concluded that inoculum concentration of 0.15-0.3% (w/v) and fermentation time of 15-24 h, are the useful condition for the production of VCO. The result of the study shows a similar agreement to Neela [14] and Aladin et al. [27]. They reported that for fermentation using Lactobacillus sp., the usage of inoculum concentrations exceeding its optimum value ended with the low quality of VCO product.
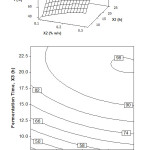 |
Figure 2: Surface and contour plot of oil recovery, Y (%), as function of fermentation time, X3 (h) and inoculum concentration, X2 (% w/v) at stirring speed, X1 = 200 rpm Click here to View figure |
The relative effect of fermentation time and stirring speed on the percentage of oil recovery can be explained in Figure 3. In this study, the fermentation time was carried out from 8 to 24 hours and stirring speed of 100-300 rpm at a constant inoculum concentration of 0.2% (w/v). Percentage of oil recovery increases from low to high level of fermentation time and the low level of stirring speed. But after 18 h of fermentation time, prolong the fermentation time do not increase the percentage of oil recovery. For fermentation time below 15 h, the increasing of stirring speed, in the beginning, decrease the oil recovery. In contrast, when the stirring speed is gained up to 175 rpm, the increasing of oil recovery is achieved.
From the surface and contour plots, the optimum interaction effect is observed between fermentation time and stirring speed. It is found an optimal area in which the fermentation of coconut milk produces the highest oil recovery. The conditions are at high levels of fermentation time and middle level of stirring speed. In detail, the conditions are at the stirring speed 175-250 rpm, the fermentation time of 16-24 hours where inoculum concentration is at 0.2% (w/v). It is due to the reason that stirring is aimed to destabilize the emulsion so that oil can be realized out from the protein sheath. When stirring is optimum, the increasing of fermentation time provide an adequate time to destabilize the protein layer which covering the oil so that the dissolution is reduced [2,5]. Under this condition, protein is coagulated and turns out, and water is separated.
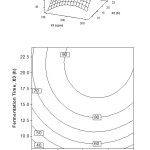 |
Figure 3: Surface and contour plot of oil recovery, Y (%), as function of fermentation time, X3 (h) and stirring speed, X1 (rpm) at inoculum concentration, X2 = 0.2% (w/v) Click here to View figure |
Fatty acid Analysis
The results of GC analysis of the samples can be explained in Figure 4 and Table 2. It shows that VCO contains 11 types of fatty acids. Lauric acid dominates the fatty acid composition with the percentage ranging from 53.0249%. It is under the category of VCO standard according to APCC 2003 [28]. The fatty acid composition in Table 2 shows that VCO has a reasonably high content of saturated fatty acids (SFA) compares to unsaturated fatty acids. Polyunsaturated fatty acid (PUFA) found is linoleic acid (C18:2), and mono-unsaturated fatty acid (MUFA) found are oleic acid (C18:1) and gadoleic acid (C20:1). PUFA is more prone to oxidation than MUFA and SFA. Thus, the low degree of unsaturation leads to the high resistance to oxidative rancidity [2,9,10].
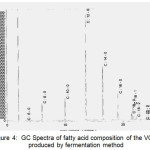 |
Figure 4: GC Spectra of fatty acid composition of the VCO produced by fermentation method Click here to View figure |
Table 2: Fatty acid composition of the VCO produced by fermentation method
| Peak | Type of Fatty Acid | RetentionTime (min) | Composition (%) | Standards APCCfor VCO (%) [28] |
| 1 | C6 (Caproic) | 3.264 | 0.0571 | 0.4-0.6 |
| 2 | C8 (Caprylic) | 6.007 | 4.5892 | 5.0-10.0 |
| 3 | C10 (Capric) | 9.981 | 5.7501 | 4.5-8.0 |
| 4 | C12 (Lauric) | 13.640 | 53.0249 | 43.0-53.0 |
| 5 | C14 (myristic) | 16.569 | 19.6641 | 16.0-21.0 |
| 6 | C16 (Palmitic) | 19.133 | 8.4652 | 7.5-10.0 |
| 7 | C18 (Stearic) | 21.425 | 2.1247 | 2.0-4.0 |
| 8 | C18:1 (Oleic) | 21.716 | 5.2182 | 5.0-10.0 |
| 9 | C18:2 (Linoleic) | 22.260 | 1.0755 | 1.0-2.5 |
| 10 | C20 (Arachidic) | 23.734 | 0.0209 | <0.5 |
| 11 | C20:1 (Gadoleic) | 24.117 | 0.0100 | <0.5 |
Conclusion
A parametric study using Box-Behnken design was found as an efficient and useful tool in studying VCO production through the fermentation method. Fermentation time has the most significant affecting the percentage of oil recovery. The highest of fermentation time provide an adequate time to destabilize the protein layer which covering the oil to coagulate and turns out, and water was separated from the virgin coconut oil. Interaction effects of stirring speed, inoculum concentration, and fermentation time, shows that oil recovery conversion increase with the increasing values of these three variables. From the model, the optimum oil recovery 88.607% obtained in stirring speed of 175-250 rpm, inoculum concentration of 0.2-0.3% (w/v), and fermentation time of 16-24 h. Moreover, the 53.0249% of lauric acid was succeeded obtain under the optimal condition of stirring speed of 200 rpm, inoculum concentration of 0.3% (w/v) and fermentation time of 24 h. The statistical analysis obtained show that the value of determination coefficient of (R2) of 97.57%. The values indicated that the model is significant to represent at least 97% of the variation dependent variable value in this study.
References
- Senphan, T.; Benjakul, S. Eur. J. Lipid Sci. Technol. 2016, 118(5), 761-769
CrossRef - Boateng, L.; Ansong, R.; Owusu, W.B.; Steiner-Asiedu, M. Ghana Med J. 2016, 50(3),189-196
- Wong, Y.C.; Hartina, H. Orient. J. Chem. 2014, 30(1), 237-245
CrossRef - Prapun, R.; Cheetangdee, N.; Udomrati, S. Inter. Food Res. J. 2016, 23(5), 2117-2124
- Oseni, N.T.; Fernando, W.M.A.D.B.; Coorey, R.; Gold, I.; Jayasena, V. Afr. J. Food Sci. 2017, 11(3), 58-66
CrossRef - Senphan, T.; Benjakul, S. J. Food Process. Preserv. 2016, 41(1), 1-12
- Ahmad, Z.; Hasham, R. J. Adv. Res. Materi. Sci. 2015, 13(1), 1-10
- Vijayakumar, M.; Vasudevan, D.M.; Sundaram, K.R.; Krishnan, S.; Vaidyanathan, K.; Nandakumar, S.; Chandrasekhar, R.; Mathew, N. Indian Heart J. 2016, 68, 498-506
CrossRef - Khan, M.S.; Lari, Q.H.; Khan, M.A. Int. J. Pharm. Sci. Res. 2016, 7(3), 1286-1291
- Mansor, T.S.T.; Che Man, Y.B.; Shuhaimi, M.; Abdul Afiq, M.J.; Ku Nurul, F.K.M. Int. Food Res. J. 2012, 19(3), 837-845
- Lee, S.T.; Arifin, A.; Son, R.; Ghazali, H.M. Int. Food Res. J. 2015, 22(1), 46-54
- Nitbani, F.O.; Jumina; Siswanta, D.; Solikhah, E.N. Procedia Chem. 2016, 18, 132-140
CrossRef - Omar, M.N.; Nor-Hazwani, M.H.; Nazreen, M.N.M.; Zuberdi, A.M. Orient. J. Chem. 2014. 30(3), 1279-1286
CrossRef - Neela S. Annals. Food Sci. Technol. 2015, 16(1), 115-126
- Thanuja, T.T; Sreekala, G.S. Trends Biosci. 2015, 8(19), 5279-5285
- Ghosh, S.; Chakraborty, R.; Raychaudhuri, U. Int. Food Res. J. 2012, 19(4), 1633-1639
- Singh, A.K.; Mukhopadhyay, M. Arab J. Sci. Eng. 2014, 39, 24632474. DOI 10.1007/s13369-013-0919-0
- Hosseini, S.; Tarzi, B.G.; Gharachorloo, M.; Ghavani, M.; Bakhoda, H. Orient. J. Chem. 2014, 31(2), 1223-1230
CrossRef - Takriff, M.S.; Mansor, N.M.; Kamarudin, S.K. J. App. Sci. 2010, 10(21), 2493-2498
CrossRef - Masyithah, Z. Orient. J. Chem. 2016, 32(3), 1361-1371
CrossRef - Masyithah, Z.; Herawan, T.; Sembiring, S.B.; Alfian, Z. Indones. J. Chem. 2011, 11, 223228.
- Gaffari-Moghaddam M.; Yekke-Ghasemi, Z.; Khajeh, M.; Rakhshanipour, M.; Yasin, Y. Russ. J. Bioorg. Chem. 2014, 40, 252-262
CrossRef - AOAC Official Methods of Analysis. Association of Official Agricultural Chemists. 20th ed. 2017. Retrieved from AOAC Website: http://www.aoac.org/ imisi5_prod/AOAC/
- Standards International Dairy Federation (IDF) 105. Milk-Determination of Fat Content – Gerber butyrometers. 2008. Retrieved from http://www.hsevi.ir/RI_standard/File/5407-2/pdf
- Bregas, S.T.; Sembodo, Noorlyta, A.; Laila, N.E. Ekuilibrium, 2010, 9 (1), 17-2
- Thanuja, T.T.; Sreekala, G.S.; Meenakumari, K.S. Inter. J. Adv. Res. 2016. 4(6), 1927-1934
- Aladin, A.; Yani, S.; Wiyani, L.; Nurjannah, Subaedah, S. ARPN J. Eng. App. Sci. 2016, 11(8), 5171-5176
- Standards Asian Pacific Coconut Community (APCC). Standard for Virgin Coconut Oil. 2003. Retrieved from http://www.cocoscience.com/pdf/apcc_vco_specs.pdf

This work is licensed under a Creative Commons Attribution 4.0 International License.
![]()
A New Edition of Web of Science
Journal Impact Factor
2022: 0.5
Five Year: 0.8
Journal is Indexed in

Cabells Whitelist
![]()


