Adsorption Kinetic of Malachite Green Dye from Aqueous Solutions by Electrospun Nanofiber Mat
Juman A. Naser, Taki A. Himdan and Ahmed J. Ibraheim
Department of Chemistry, College of Education for Pure Sciences- Ibn Al-Haitham/ University of Baghdad, Baghdad, Iraq.
Corresponding Author E-mail: Juman_chem@yahoo.com
DOI : http://dx.doi.org/10.13005/ojc/330654
A resin of 2-aminophenol-formaldehyde (2-A-Ph-F) was prepared and characterized by FT-IR technique. This resin was loaded on polystyrene (PS) as a matrices using DMF solvent, after that the polymer solution was used in electrospinning process in order to result electrospun nanofiber mat (2-A-Ph-F)/PS which has been used as adsorbent surface for studying the adsorption kinetic of malachite green dye (MG) at different temperatures to observe the behavior of this adsorption system. Generally, there is an increase in the values of rate constants with increasing temperature and the experimental results obeyed very well the first order Lagergren's equation. So, the activation energy value Ea was estimated by Arrhenius equation. While the diffusion mechanism and the rate controlling steps explained according to Weber’s intraparticle diffusion.
KEYWORDS:Adsorption; Diffusion; Kinetic; Malachite Green; Electrospun; Nanofiber
Download this article as:| Copy the following to cite this article: Naser J. A, Himdan T. A, Ibraheim A. J. Adsorption Kinetic of Malachite Green Dye from Aqueous Solutions by Electrospun Nanofiber Mat. Orient J Chem 2017;33(6). |
| Copy the following to cite this URL: Naser J. A, Himdan T. A, Ibraheim A. J. Adsorption Kinetic of Malachite Green Dye from Aqueous Solutions by Electrospun Nanofiber Mat. Orient J Chem 2017;33(6). Available from: http://www.orientjchem.org/?p=40984 |
Introduction
Many industries throw their waste in large quantities such as dyes and organic or inorganic pollutants in water without any treatments. These pollutants have serious damage to the biotic ecosystem of all organisms1-4. So these environmental pollutants can be treated in industrial waste water by using chemical, biologic and physical methods5-10. Adsorption is one of the most effective methods of physical and economic treatments. In this technique the particles accumulate on the surface of the adsorbent material9.
Dyes are one of the types of organic pollutants, which are widely used in the manufacture of textiles, paper, plastics and printing as well as used as additives in the oil industry11,12. Malachite green dye raises the concern about its use because it has toxic effects, so it must be treated before being given as a waste13.
Nanomaterials have been widely used for the removal of pollutants because they are effective adsorbent because of their large surface area and dispersion resistance14. Researchers used carbon nanotubes, nanoparticles and nanocomposites as adsorbent surfaces to remove pollutants from their solutions 15-19. Nanofibers technology is one of the most important research topics in recent years in the field of the removal of pollutants. Polymer nanofibers contain a porous composition with a proportion of large surface to volume. As well as, they were used in electrical applications such as condensers, rechargeable batteries and sensor instruments20,21. Continually, they have a great importance as they have been developed as highly efficient adsorbents because of the flexibility in surface modification, the very high ratio of surface area to volume and better mechanical properties compared to traditional adsorbents22-24.
Nanofibers are prepared in a simple process called electrospinning technology, their diameters ranging from several micrometers (10 – 100) μm to sub-micron or nanometers (10-1-10-2) μm25. Many of the polymers can be electrically spinning and their properties differ depending on the different properties of the solution, processing parameters and environmental conditions26.
In the present study, 2-amino phenol-formaldehyde (2-A-Ph-F) resin was prepared and loaded on polystyrene (PS) as a matrices in order to produce electrospun nanofibers mat (2-A-Ph-F)/PS by electrospinning method. Kinetic adsorption of malachite green dye was studied by the resulting electrospun mat as a low cost adsorbent surface.
Materials and Methods
Instruments
Double beam FT-IR spectrophotometer-Shimadzu 1800, Double beam UV/VIS spectrophotometer- PG Instrument Ltd T80+, Electrospinning device- NE300, Scanning electron microscope- Angstrom Advanced AA8000, Shaking Water Bath-HYSC Ltd SWB 25, Ultra sonic device-Wisd Lab Instrument WUC-A06H, Mechanical stirrer- DAIHAN Scientific WiseStir HS300 and vacuum drying oven -HYSC Ltd VO-27.
Materials
Malachite green dye (C23H26N2Cl) Fig. 1, acetic acid and hydrochloric acid were supplied by BDH. Formaldehyde (40%), 2-aminophenol, N,N-dimethylformamide (DMF) and polystyrene (PS) with average Mw (200,000) were purchased from Sigma-Aldrich.
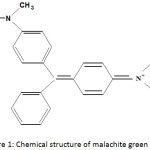 |
Figure 1: Chemical structure of malachite green dye. Click here to View figure |
Preparation of The Resin 2-aminophenol-formaldehyde (2-A-Ph-F)
(2) mL of concentrated acetic acid was mixed with (5) mL of formaldehyde in a beaker has capacity (100) mL, then (16) g of 2-aminophenol added to the previous mixture with the continuous stirring. A few drops of concentrated hydrochloric acid added to the reaction mixture and after that the reaction container putted in a water bath at (80) °C with the continuously stirring and heating until a homogeneous brown sticky block was obtained.
Determination The Maximum Wavelength and Calibration Curve
The maximum wavelength λmax which at the highest absorbance of the dye solution was determined by recording the absorption spectra by using the Uv-Vis spectrophotometer in the range (200-1000) nm by quartz cells with a pitch length of (1) cm, its value was (617) nm, Fig. 2. Also, the calibration curve, which represents the relation between absorbance and concentration, six concentrations (5, 10, 20, 30 ,40 and 50) ppm was prepared. The absorbance of these concentrations was measured at λmax of the dye, and the standard curve was drawn between absorbance and concentration, Fig. 3.
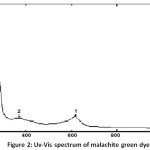 |
Figure 2: Uv-Vis spectrum of malachite green dye. Click here to View figure |
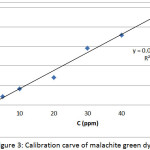 |
Figure 3: Calibration carve of malachite green dye Click here to View figure |
Preparation of The Standard Solution
The stock solution with a concentration of (500) ppm was prepared by dissolve (0.5) g of MG dye in (100) mL of distilled water. The standard solution (40) ppm of MG dye that studied its adsorption on the surface of the nanofiber mat (2-A-Ph-F)/PS was prepared by diluting the previous stock solution.
For the purpose of determining the time that required for the equilibrium between the surface adsorbent and the absorption material and studying the kinetic of this system, six round flasks have a volume (50) mL used, and (2) pieces of the electrospun nanofiber mat with a weight (0.004) g putted in every one of the round flasks then (20) mL of the dye solution with a concentration of (40) ppm added, after that all these systems putted in shaker water bath. The determination of solutions concentrations accrued at successive times. The adsorption kinetic of MG dye was studied at different temperatures (298, 303, 308, 313 and 318) K at a shaking speed (180) rpm for all temperatures.
Electrospinning Process Setting
(10) mL of polymer solution used consisting of mixing (9) mL of polystyrene with a concentration (20) %w/v and (1) mL of 2-aminophenol-formaldehyde resin with a concentration (30) %w/v by using DMF as a solvent for two polymer solutions, which mixed by a mechanical stirrer with a shaking speed (60) rpm.
The polymer mixture was transferred to a (10) mL plastic syringe that attached to a nozzle with an aperture (0.9) mm, which is the positive electrode of the electrical outfitter. The polymer mixture was pumped at a speed average (0.03) mL/min to a direction rotation cylinder at (50) rpm, that wrapped with an aluminum foil which is the negative electrode of the electrical outfitter. The voltage between the two electrodes was (32) kv while the distance between this electrodes was (15) cm.
The produced nanofibers mat was placed in the (50)°C at a vacuum oven for drying then it was cut by a mechanical cutter tool with diameter (10) mm, Fig. 4.
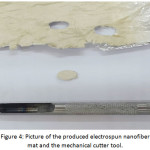 |
Figure 4: Picture of the produced electrospun nanofiber mat and the mechanical cutter tool. Click here to View figure |
Results and Discussion
Characterization of The Prepared Resin (2-A-Ph-F)
Infrared FT-IR Spectroscopy
In the recorded IR spectrum of the prepared resin Figure (5), a broad beam at (3412) cm-1 was observed due to the stretching vibration of the phenolic hydroxyl group O-H and N-H in the NH2 group in the ortho position. The peaks at (2920) cm-1 and (2926) cm-1 were observed that attributed to stretching and bending vibration of alkaline group CH2 respectively.
It is worth noting that the carbonyl group C=O disappeared, which is expected to appear at (1700) cm-1 in the formaldehyde spectrum.
The emergence of peaks at (1637) cm-1 and (1616) cm-1 were also attributed to the stretching vibrations of C=C groups in the aromatic ring. While the vibration of the C=C group that connected to the mthylene bridge CH2 appeared at (1521) cm-1, so the bending vibration of the N-H group showed at (1508) cm-1.
The appearance of the peak at (1436) cm-1 is attributed to the intra level bending vibration of the O-H group. It is also observed that a peak at (1386) cm-1 is likely to be due to the asymmetric stretching vibration of the phenolic group C-C-OH. The stretching vibrations of the single-bond C-O group at frequencies (1340) cm-1 and (1053) cm-1 in the CH2OH group. The frequencies at (864) cm-1 and (806) cm-1 were attributed to the outside level bending vibrations of the C-H group for the para and ortho position respectively.
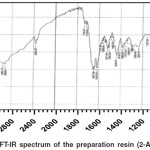 |
Figure 5: FT-IR spectrum of the preparation resin (2-A-Ph-F). |
Scanning Electron Microscopy SEM
The surface morphology of electrospun nanofiber mat (2-A-Ph-F)/PS was studied by the scanning electron microscope after the sample was coated with a layer of gold. As shown in Fig. 6, where a network of continuous fibers was observed in the form of smooth and the diameter average of the fiber (170±30) nm.
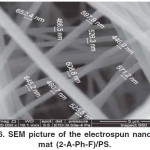 |
Figure 6: SEM picture of the electrospun nanofiber mat (2-A-Ph-F)/PS. Click here to View figure |
The Adsorption Kinetic
The kinetic study was carried out at different temperatures to determine the effect of temperature on the kinetic functions.
The amount of material absorbed (qt)mg.g-1 at time (t) was calculated using the following formula:
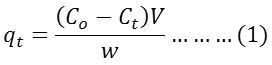
Where mgL-1 is the primary concentration of the dye solution,) mgL-1 is the concentration of the dye solution at time (t) is the solution volume measured by L and the weight of the surface is measured by g.
The amount of material absorbed (qe)mg.g-1 at equilibrium time was estimated according to the following equation:
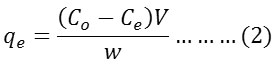
Where (Ce) mgL-1 is the concentration of the dye solution at equilibrium time.
The plot between the adsorbed amount of the MG dye (qt)mg.g-1 and time (t) min-1 is shown in Fig. 7. The adsorption concentrations increase gradually with increasing time then approach a constant value at time (150) min for all studied temperatures, that means the adsorbed surface reaches to the saturation state at this time which considers as an equilibrium time.
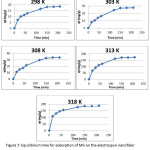 |
Figure 7: Equilibrium time for adsorption of MG on the electrospun nanofiber mat (2-A-Ph-F)/PS at studied temperatures. Click here to View figure |
In this study, the pseudo-first order equation was applied, Lagergren’s first order rate equation. The oldest and most famous equation to explain the rate of adsorption which depends on adsorption capacity, equation 3 shows the linear form of the first order Lagergren’s equation27:
![]()
Where (qe) mg.g-1 is an amount of the adsorbed material at the equilibrium time, (qt) mg.g-1 is the adsorbed dye amount in time (t), (k1) min-1 is the rate constant of pseudo-first order, that calculated from the equation (3) when drawing In (qe-qt) versus time (t), while qe was founded from the straight line equation intercept.
Fig. 8 shows plots of In (qe-qt) versus time (t) for all the studied temperatures. The linearity of the line and the large values of correlation coefficient R2 show that the studied system follows the pseudo-first order equation.
Table 1 shows the adsorption kinetic coefficients. The theoretical quantities of the adsorbed material (qe cal.) consistent with the experimental quantities of the adsorbed material (qe exp.).
When the values of rate constants are extracted, generally we observe an increase in the values of these constants with increasing temperature, as a result to the increasing in the arriving rate to the equilibrium state of the studied adsorption system.
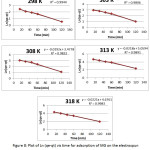 |
Figure 8: Plot of Ln (qe-qt) vis time for adsorption of MG on the electrospun nanofiber mat (2-A-Ph-F)/PS at studied temperatures. Click here to View figure |
Table 1: The kinetic coefficients for adsorption of MG dye on the electrospun nanofiber mat (2-A-Ph-F)/PS.
|
T (K) |
qeexp (mg.g-1) |
qecal (mg.g-1) |
k (min-1) |
R2 |
|
298 |
14.585 |
18.150 |
0.017 |
0.994 |
|
303 |
28.846 |
27.182 |
0.018 |
0.980 |
|
308 |
32.362 |
32.774 |
0.019 |
0.983 |
|
313 |
157.433 |
171.591 |
0.021 |
0.989 |
|
318 |
107.339 |
185.892 |
0.022 |
0.998 |
In order to obtain activation energy Ea, It is determine the influence of the temperature on the reaction rate, ln k versus was plotted according to the following equation28:
![]()
Where k is the rate constant, A is the frequency coefficient, Eα is the activation energy, R is the gas constant and T is the temperature in Kelvin.
Generally, from the value of activation energy Ea we can recognize if there is a physical or chemical adsorption occur in the studied system. In the physical adsorption, the equilibrium is speedily and easily reversible so that the activation energy has usually a small magnitude less than (4.2) kJmol-1, while the activation energy in the chemical adsorption is larger than this value, that involves bonding forces larger than in physical adsorption.
Fig. 9 represents the plot of Arrhenius’s equation. The value of activation energy Ea was extracted from the slope of equation 4, which represents the minimum energy that required for a molecules of MG dye to adsorb on the electrospun nanofibers mat (2-A-Ph-F)/PS. It has been value (10.542) kJ.mol-1, that means the adsorption involves activated chemical adsorption in addition to physical adsorption since the rate increase with increasing temperature.
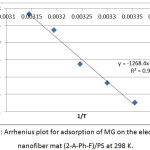 |
Figure 9: Arrhenius plot for adsorption of MG on the electrospun nanofiber mat (2-A-Ph-F)/PS at 298 K. Click here to View figure |
In order to take a look at the mechanism and the rate controlling steps that affecting on the adsorption kinetic, the experimental results kinetic were applied to Weber’s intraparticle diffusion29 to explain the diffusion mechanism, according to the following equation(5), the kinetic results were analyzed with the intraparticle diffusion model:
![]()
Where C is the intercept, kid is intraparticle diffusion rate constant (mg/gh1/2), which can be estimated from the slope of the straight line drawn that represents qt against t1/2. While, the straight line intercept represents an influence of the secondary layer thickness. Fig. 10 shows the plots of Weber’s equation for all studied temperatures. So, the values of calculated intraparticle diffusion coefficients were abstracted in Table 2.
If the slope of qt versus t1/2 is linear and passes through the original points, the intraparticle diffusion is the limiting controlling step for the specified rate. While if the straight line does not pass through the original points this indicates that intraparticle diffusion is not only a rate controlling step29.
The first step (surface) shows that adsorption occurs on the outer surface and ends at time (60) min, then begins the step of intraparticle diffusion control until time (120) min, and finally the equilibrium step that begins at time (150) min. From the values of correlation coefficient, it can be observed that the adsorption of the MG dye on the surface of electrospun nanofibers mat (2-A-Ph-F)/PS involves more than one process, and the intraparticle diffusion process is not just a rate controlling step30. The straight line fails to pass through the original points largely at temperatures (313) K and (318) K, as a result to the difference in the rate of molecules transfer in the initial and final stages of adsorption that causes from the increasing in temperatures. Continuously, the correlation coefficient values of intraparticle diffusion system were smaller than that in pseudo first order system, this confirms the adsorption process may be followed by intraparticle diffusion process. So, the large value of intercept reflects the increase of the surface contribution in the sorption at the rate controlling step.
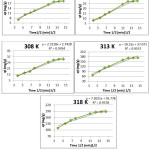 |
Figure 10: Plot of qt versus t1/2 for adsorption of MG on the electrospun nanofiber mat (2-A-Ph-F)/PS at studied temperatures. Click here to View figure |
Table 2: Intraparticle diffusion rate constants and the influence of the secondary layer for adsorption of MG dye on the electrospun nanofiber mat (2-A-Ph-F)/PS.
|
Temperature (K) |
kid(mg/gt1/2) |
The influence of the secondary layer |
|
298 |
1.096 |
3.781 |
|
303 |
2.036 |
0.414 |
|
308 |
2.312 |
2.742 |
|
313 |
10.32 |
37.07 |
|
318 |
7.202 |
92.77 |
Conclusion
In this study, the kinetic adsorption of a basic dye Malachite green (MG) from aqueous solution at different temperatures was investigated, by using electrospun nanofiber mat (2-A-Ph-F)/PS as an adsorbent surface. The results obtained from two kinetic models, the adsorption kinetic described by the Lagergren’s pseudo-first order rate equation , while the intraparticle diffusion analyzed by Weber’s model. The results obtained there is more than one process in studied system, an adsorption process followed by intraparticle diffusion process.
Acknowledgement
We are grateful to Department of Chemistry and The Central Service Laboratory in College of Education for Pure Sciences/ Ibn Al-Haitham/ University of Baghdad for providing this work.
References
- Sun, J.H.; Sun, S.P.; Wang, G.L.; Qiao, L.P. Dyes Pigments, 2007, 74, 647-652.
CrossRef - Dizge, N.; Aydiner, C.; Demirbas, E.; Kobya, M.; Kara, S. Journal of Hazardous Materials, 2008, 150, 737-746.
CrossRef - Aber, S.; Daneshvar, N.; Soroureddin, S.M.; Chabok, A; Asadpour-Zeynali, K. Desalination, 2007, 211, 87-95.
CrossRef - Gong, R.; Zhang, X.; Liu, H.; Sun, Y.; Liu; B. Biores. Technol., 2007, 98, 1319-1323.
CrossRef - Rondon, W.; Freire, D.; de Benzo Z.; Sifontes, A.B.; Gonzalez, Y.; Valero, M; Brito, J.L. American Journal of Analytical Chemistry, 2013, 4, 584-594.
- Shavandi, M.A.; Haddadian, Z.; Ismail, M.H.; Abdullah, S.N.; Abidin, Z.Z. Journal of the Taiwan Institute of Chemical Engineers, 2012, 43, 934-941.
CrossRef - Elmorsi, T.M.; Riyad, Y.M.; Mohamed, Z.H; Abd El Bary, H.M. Journal of Hazardous Materials, 2010, 174, 352-358.
CrossRef - Motsi, T.; Rowson, N.A.; Simmons, M.J.H. International Journal of Mineral Processing, 2009, 92, 42-48.
CrossRef - Bhattacharyya, K.G.; Sharma, A. Journal of Hazardous Materials, 2004, B113, 97-109.
CrossRef - Moyo, M.; Chikazaza, L. American Journal of Analytical Chemistry, 2013, 4, 689-695.
CrossRef - Aksu, Z. Process Biochem, 2005, 40, 997-1026.
CrossRef - Rostad, C.E. Fuel, 2010, 89, 997-1005.
CrossRef - Hameed, B.H.; El-Khaiary, M.I. Journal of Hazardous Materials, 2008, 159, 574-579.
CrossRef - Nekouei F.; Nekouei, Sh.; Tyagi, I.; Gupta V.K. J. Mol. Liq, 2015, 201, 124-133.
CrossRef - Gupta, V.K.; Saleh, T.A. Environ. Sci. Pollut. Res., 2013, 20, 2828–2843.
CrossRef - Gupta, V.K.; Kumar, R. ; Nayak, A.; Saleh, T.A.; Barakat, M.A. Adv. Colloid Interf. Sci,. 2013, 194, 24-34.
CrossRef - Pahlavan, A.; Gupta, V.K.; Sanati, A.L.; Karimi, F.; Yoosefian, M.; Ghadami, M. Electrochim. Acta, 2014, 123, 456-462.
CrossRef - Gupta, V.K.; Jain, R.; Mittal, A.; Saleh, T.A.; Nayak, A. ; Agarwal, S.; Sikarwar, S. Mater. Sci. Eng., 2012, C32, 12-17.
CrossRef - Gupta, V.K.; Jain, R.; Nayak, A.; Agarwal, S.; Agarwal, S. ; Shrivastava, M. Mater. Sci. Eng., 2011, C31, 1062-1067.
CrossRef - Cho, S.I; Lee, S.B. Acc. Chem. Res., 2008, 41, 699-707.
CrossRef - Huang, L.M.; Lin, H.Z.; Wen, T.C.; Gopalan, A. Electrochim. Acta, 2006, 52, 1058-1063.
CrossRef - Yuan, Y.; Zhao, Y.; Li, H.; Li, Y.; Gao, X.; Zheng, C.; Zhang, J. Journal of Hazardous Materials, 2012, 227, 427-435.
CrossRef - Zhang, C.; Li, X.; Bian, X.; Zheng, T.; Wang, C. Journal of Hazardous Materials, 2012, 229, 439-445.
CrossRef - Sang, Y.; Li, F.; Gu, Q.; Liang, C.; Chen, J. Desalination, 2008, 223, 349-360.
CrossRef - Huang, Z.M; Zhang, Y.Z.; Kotaki, M.; Ramakrishna, S. Composites science and technology, 2003, 63, 2223-2253.
CrossRef - Liu, G.; Ding, J.; Qiao, L.; Guo, A.; Dymov, B.P.; Gleeson, J.T.; Hashimoto, T.; Saijo, K. Chemistry-A European Journal, 1999, 5, 2740-2749.
CrossRef - Lagergren S., Handl., 1898, 24,1-39.
- Elsayed A. E.; Mahdy, A.M.; Bbrakat, N.H. Soil and Water Res., 2007, 2, 135-140.
- Weber, W.J. ; Morris, J.C.; J Sanit Eng Div. Am. Soc. Civ. Eng.,1963, 89, 53-61.
- Panday, K.K.; Prasad, G.; Singh, V.N. Environ. Tech. Lett. 1986, 7, 547-554.
CrossRef

This work is licensed under a Creative Commons Attribution 4.0 International License.
![]()
A New Edition of Web of Science
Journal Impact Factor
2022: 0.5
Five Year: 0.8
Journal is Indexed in

Cabells Whitelist
![]()


