Unique and Novel Hydrogen Bonding at the Frontiers: 2-Dimethylaminobenzoic Acid and MFn Interaction as Model
Tareq Irshaidat
Department of Chemistry, College of Science, Al-Hussein Bin Talal University, Ma’an, Jordan.
Corresponding Author E-mail: tirshaidat@yahoo.com
DOI : http://dx.doi.org/10.13005/ojc/330511
H-bond plays key roles in the continuation of the life of all the living creatures and continues to attract attention as elementary concept. As a continuation to the pioneering inspiring efforts of Mori and Yáñez, in this computational organic chemistry study, the effect of the interaction between each of MFn (SrF2, YF3, ZrF4, AgF, CdF2, BF3, AlF3, GaF3, InF3, SnF4, and SbF5) and 2-dimethylaminobenzoic acid was studied using density functional theory (DFT). Fundamental characterization was performed for selected features; the structural parameters, the atomic charges, the infrared (IR) stretching frequencies, the nuclear magnetic resonance chemical shifts of hydrogen (1H-NMR), the bond critical point electron densities, and the charge delocalization energies. Consistent with the previous results all the studied features provided solid evidences that the interaction with the Lewis acid boosts the hydrogen bond strength significantly. To best of our knowledge, the strongest possible neutral H-bond (N…H-O) and their properties are reported to the first time in the literature.
KEYWORDS:H-bond; DFT; Charge Delocalization Energy; Lewis Acid
Download this article as:| Copy the following to cite this article: Irshaidat T. Unique and Novel Hydrogen Bonding at the Frontiers: 2-Dimethylaminobenzoic Acid and MFn Interaction as Model. Orient J Chem 2017;33(5). |
| Copy the following to cite this URL: Irshaidat T. Unique and Novel Hydrogen Bonding at the Frontiers: 2-Dimethylaminobenzoic Acid and MFn Interaction as Model. Orient J Chem 2017;33(5). Available from: http://www.orientjchem.org/?p=39133 |
Introduction
The H-bond is a dipole-dipole or an ion-dipole interaction while the original picture of H-bond definition may be visualized as X-H…Y where X and Y are nitrogen, oxygen, or fluorine, where X-H is hydrogen bond donor and Y is the H-bond acceptor [1-5]. In 2011 IUPAC suggested a broader perspective [6]. When a hydrogen atom bonds to an atom (X-H) that has higher electronegativity a partial positive charge builds up on the hydrogen atom which allows an attraction (H-bond) to occur with a neighboring atom(s) carrying a negative charge or a partial negative charge and carries electron pair(s). This may include C-H (and other bonds X-H) as H-bond donor as in Cl3C-H where the three chlorine atoms participate in increasing the polarization of the C-H bond [7]. Another unconventional case is the interaction of X-H with a π-system [8]. Also, the hydrogen atom in the H-bond donor (X-H) may be involved in two interactions (Y…H…Y) or two H-bond donors (X-H) may share the same acceptor ((X-H)2…Y). Both cases are commonly called bifurcated H-bond (two-forked H-bond) [9].
This attraction force may exist inside the same molecule or among molecules. Studies gave evidences that it may exist in all types of compounds; organic as well as inorganic structures. Also, it varies; it may be weak, medium, or strong but never reaches the strength of a full covalent or ionic bond [10]. However, it can decrease the distance between atoms to less than what the atomic radii may allow. The interatomic distance (H…Y) varies depending on the strength of the H-bond; strong (~ 1.2-1.5Å; 14-40 kcal/mol), moderate (1.5-2.2Å; 4-14 kcal/mol), and weak (2.2-3.2Å; <4 kcal/mol) [11].
H-bond is the reason behind many phenomena that plays vital roles in our life. The uniqueness of H2O comes basically from the fact that it can participate in larger number of H-bonds through the two hydrogen atoms and the two lone pairs on oxygen [12, 13]. Other examples on the importance of H-bond in our life are the amazing 3D-structures of DNA and the biological proteins; all are shaped based on H-bond recognition [14]. Their specific 3D-structures are responsible for the physiological roles and biochemical reactions that guarantee continuation of life. As with these macromolecules, the physical properties of many natural and artificial polymers are sensitive to the existence of these interactions among the chains. Valuable H-bonds are formed when amide group is part of polymer chain, as in nylons. Also, hydroxyl groups participate significantly in the physical appearance of cellulose polymers, as in wood and cotton.
A special case of H-bond is when a hydrogen atom is nearly centered between two identical atoms (X-H-X). May be the most interesting example on these cases is the FHF anion. The XHX structure is described as three-center four-electron interaction. The H-bond in FHF anion is classified as a strong H-bond. The other cases of strong H-bond are found mainly in charged segments (O-H…O(-), N-H…N(-), (+)O-H…O, (+)N-H…N) [1-5]. Another special case of X-H…Y interaction is when the acceptor (Y) is a neighboring negatively charged hydrogen atom, which is commonly called dihydrogen bonding [15-19].
Regarding the title compound, X-ray crystallography and infrared analyses indicate that the structure of 2-dimethylaminobenzoic acid in the solid state exist as Zwitterion [20-23]. On the other hand, gas phase infrared spectrum of the acid shows a strong signal in the 1700-1800 cm-1 region which indicates that the carboxylic acid group exists in the RCOOH neutral form [24]. A gas phase theoretical study produced similar results and revealed that the structure may exist as three conformers among them the most stable conformation is the case in which there is a stabilizing H-bond between the amine and the carboxylic acid groups (N…H-O). [25]. Compared with a model reference structure, the calculations estimated the H-bond stabilization energy larger than 10 kcal/mol, which indicated that 2-dimethylaminobenzoic acid include within its structure the strongest neutral H-bond compared to the examples that are not resonance assisted H-bonds.
In the pioneering works of Mori [26] and Yáñez [27] based on B3LYP density functional theory calculations, they illustrated that Lewis acids can change the electronic structure parameters, including H-bond, noticeably [27]. Similarly, effect of strong Lewis acids on the electronic structure of 2-aminobenzoic acid was investigated using the same theory [28]. The calculations indicated that a Lewis acid may cause breaking of the H-O σ-bond and spontaneous transfer of the proton to the neighboring amine group to convert the structure into the Zwitterion form. Effect of Lewis acids on the electronic structure of organic skeletons that include H-bond within their structures needs further investigation for better understanding. In light of the pioneering works [26-28] and consequently, we examined effect of various Lewis acids on the electronic structure of 2-dimethylaminobenzoic acid (as a model of neutral H-bond) (Figure 1) with a special focus on the relationship between the studied aspects and the H-bond. The following text is presented as the following: the computational methods section, the structural parameters section, the atomic charges section, the infrared (IR) and the nuclear magnetic resonance (NMR) spectroscopic data section, the Atoms-In-Molecules (AIM) bond critical point electron density section, the charge delocalization energy section, and the conclusion.
Computational Method
The Gaussian03 [29] was used for all the calculations. The B3LYP/6-31G(d,p)-SDD protocol was employed as recommended earlier [30-32] for the geometry optimization and the frequency calculations. The B3LYP functional is composed of the Becke three parameter exchange functional [33], the non-local correlation provided by Lee, Yang, and Parr (LYP) [34, 35], and local correlation functional (III) developed by Vosko, Wilk, and Nusair (VWN) [36]. The 6-31G(d,p) basis set [37] was assigned for carbon, hydrogen, nitrogen, oxygen, and fluorine. On the other hand, the SDD basis set [38] along with its effective core potential (ECP) [39-41] was assigned for the Lewis acid centers; boron, aluminum, gallium, indium, silver, cadmium, tin, antimony, strontium, yttrium, and zirconium. All the calculated frequencies (for the structures in Figure 1) are positive values which confirm that each is a true minimum. Malonaldimine transition state shows one imaginary frequency that represents resonance motion of the transferring proton between the two nitrogen atoms. The Atoms-In-Molecules program (AIM) [42-44] was used as implemented in Gaussian03 to calculate the bond critical point electron densities (BCP). Similarly, the 6-311+G(2d,p) (C, H, N, O, and F) [45] and the SDD-ECP basis sets combination was used to analyze the natural bond orbitals (NBO) within the implemented NBO program [46] in which the charge delocalization energy is calculated using the second order perturbation theory. Also, the 6-311+G(2d,p)-SDD-ECP combination was employed to calculate the nuclear magnetic resonance (NMR) shielding tensors using the Gauge-Independent Atomic Orbital (GIAO) method [47] and the chemical shifts were calculated by considering the signal of tetramethylsilane as a reference.
Results and Discussion
Structural Parameters
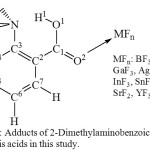 |
Figure 1: Adducts of 2-Dimethylaminobenzoic acid and the Lewis acids in this study. Click here to View figure |
Tables 1, 2, and 3 present selected structural parameters of 2-dimethylaminobenzoic acid (DMAB) and the Lewis acid adducts (Figure 1). The shorter O1-H1 and the longer N…H1 indicate that H1 is less attracted to the nitrogen atom and indicate that the H-bond is weaker. In case of DMAB, it appears that the interaction with Lewis acids affects mostly the carboxylic acid group and the Me2N…HOOC interaction. On the other hand, it appears that the effect of the Lewis acid does not extend to influence the structural parameters of the benzene ring noticeably; therefore, with the focus on the H-bond interaction, the data of the benzene ring are not presented in Tables 1, 2, and 3.
The increase in the O1-H1 bond length, the decrease in the O1-C1bond length, and the increases in the C1-O2 bond length after the interaction of DMAB with any of the Lewis acids (data between parentheses) illustrate that all the Lewis acid are effective in dragging electron density through the O2=C1-O1 segment from the O1-H1 σ-bond and consequently weakens it and increases its length. Among the BF3, AlF3, GaF3, and InF3 Lewis acids it appears that InF3 is more effective than the others (Table 1). This is a complex effect of the size of the atomic orbitals, the population of the atomic orbitals, and the effective nuclear charge without the possibility of a simple straight forward analysis.
Table 1: Selected structural parameters (Å) of group 3A Lewis acids derivatives (Figure 1). The value between parentheses is the difference with respect to DMAB.
|
Parameter |
DMAB |
BF3 |
AlF3 |
GaF3 |
InF3 |
|
O1-H1 |
1.005 |
1.038 |
1.049 |
1.047 |
1.051 |
|
– |
-0.033 |
-0.044 |
-0.042 |
-0.046 |
|
|
N…H1 |
1.674 |
1.557 |
1.531 |
1.536 |
1.526 |
|
– |
-0.117 |
-0.143 |
-0.138 |
-0.148 |
|
|
O1…N |
2.626 |
2.546 |
2.531 |
2.533 |
2.527 |
|
– |
-0.08 |
-0.095 |
-0.093 |
-0.099 |
|
|
O1-C1 |
1.336 |
1.297 |
1.296 |
1.298 |
1.299 |
|
– |
-0.039 |
-0.04 |
-0.038 |
-0.037 |
|
|
C1-O2 |
1.214 |
1.248 |
1.249 |
1.248 |
1.248 |
|
– |
-0.034 |
-0.035 |
-0.034 |
-0.034 |
|
|
O2-M |
– |
1.711 |
1.919 |
2.049 |
2.163 |
|
O1…M |
– |
2.9 |
3.11 |
3.092 |
3.171 |
Table 2: Selected structural parameters (Å) of silver, cadmium, indium, tin, and antimony Lewis acids derivatives (Figure 1). The value between parentheses is the difference with respect to DMAB.
|
Parameter |
DMAB |
AgF |
CdF2 |
InF3 |
SnF4 |
SbF5 |
|
O1-H1 |
1.005 |
1.035 |
1.036 |
1.051 |
1.041 |
1.054 |
|
– |
-0.03 |
-0.031 |
-0.046 |
-0.036 |
-0.049 |
|
|
N…H1 |
1.674 |
1.569 |
1.564 |
1.526 |
1.552 |
1.515 |
|
– |
-0.105 |
-0.11 |
-0.148 |
-0.122 |
-0.159 |
|
|
O1…N |
2.626 |
2.554 |
2.548 |
2.527 |
2.543 |
2.523 |
|
– |
-0.072 |
-0.078 |
-0.099 |
-0.083 |
-0.103 |
|
|
O1-C1 |
1.336 |
1.31 |
1.325 |
1.299 |
1.302 |
1.29 |
|
– |
-0.026 |
-0.011 |
-0.037 |
-0.034 |
-0.046 |
|
|
C1-O2 |
1.214 |
1.238 |
1.229 |
1.248 |
1.244 |
1.255 |
|
– |
-0.024 |
-0.015 |
-0.034 |
-0.03 |
-0.041 |
|
|
O2-M |
– |
2.155 |
2.472 |
2.163 |
2.267 |
2.158 |
|
O1…M |
– |
3.196 |
2.788 |
3.171 |
3.195 |
3.332 |
It appears that SbF5 is the most influential among the five Lewis acids in Table 2. The properties that antimony owns over indium are (1) the higher oxidation state and (2) the more effective nuclear charge. These two reasons make antimony more electron deficient and stronger electron withdrawing group. The O2-Sn bond length (Table 2) implies that bonding is not as efficient as in case of InF3 and SbF5. Similar to group 3A Lewis acids, this may also be due to a complex interplay among the size of the atomic orbitals, population of the atomic orbitals, the oxidation state, and the effective nuclear charge. Compared to O2-M in general, the relatively larger O1…M intermolecular distance indicates that there is no significant interaction between O1 and M in the Lewis acids adducts in Tables 1 and 2. ZrF4 (Table 3) exhibits the same feature; no bonding interaction between O1 and Zr.
According to the O1-H1 and N…H1 values in Table 1 and 2 cases of the H-bond strength are arranged qualitatively in the following order:
Group III A Lewis acids: DMAB<BF3<GaF3<AlF3<InF3;
The fifth period Lewis acids: DMAB<AgF<CdF2<SnF4<InF3<SbF5;
The arrangement of the cases in Table 1 and 2 is as the following:
DMAB<AgF<CdF2<BF3<SnF4<GaF3<AlF3<InF3<SbF5.
Table 3: Selected structural parameters (Å) of strontium, yttrium, and zirconium Lewis acids derivatives (Figure 1). The value between parentheses is the difference with respect to DMAB.
|
Parameter |
DMAB |
SrF2 |
YF3 |
ZrF4 |
|
O1-H1 |
1.005 |
1.078 |
1.487 |
1.036 |
|
– |
-0.073 |
-0.482 |
||
|
N…H1 |
1.674 |
1.469 |
1.092 |
1.565 |
|
– |
-0.205 |
-0.582 |
||
|
O1…N |
2.626 |
2.499 |
2.518 |
2.551 |
|
– |
-0.127 |
-0.108 |
||
|
O1-C1 |
1.336 |
1.33 |
1.289 |
1.307 |
|
– |
-0.006 |
-0.047 |
||
|
C1-O2 |
1.214 |
1.232 |
1.251 |
1.239 |
|
– |
-0.018 |
-0.037 |
||
|
O2-M |
– |
2.65 |
2.474 |
2.34 |
|
O1…M |
– |
2.718 |
2.551 |
3.51 |
On the other hand, in cases of SrF2 and YF3 (Figure 2, Table 3) the O1-M and O2-M distances are close to each other and within the range that confirms bonding of the metal center to O2 as well as to O1. Another structural feature observed in the SrF2 and YF3 adducts that does not exist in the other derivatives is the presence of a stabilizing interaction between F atom and C-H of a methyl group (Figure 2, the intra-molecular F…H-C distances are: in SrF2 adduct= 1.994 and in YF3 adduct= 2.038 Å). Accompany these phenomena in the case of strontium derivative the longest H1-O1 bond and the shortest N…H1 distance, which implies that the N…H1-O1 H-bond is the strongest among all the cases. On the other hand, yttrium Lewis acid shows the strongest interaction with DMAB which is interpreted through breaking the H1-O1 σ-bond and causing spontaneous transfer of H1 to form a bond with the nitrogen atom. As a result, the structure of yttrium derivative can be described as a Zwitterion. These observations illustrate that strontium and yttrium push the electronic structure of DMAB to the frontier to generate the strongest possible H-bond and the Zwitterion structure. Therefore, the O1-H1 bond length and the N…H1 distance produces the following arrangement of the (N…H1-O1) H-bond strength: DMAB<AgF <ZrF4 and CdF2 <BF3 <SnF4 < GaF3 <AlF3 <InF3 < SbF5 <SrF2.
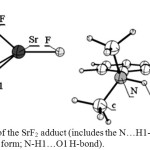 |
Figure 2: The structures of the SrF2 adduct (includes the N…H1-O1 H-bond) and YF3 adduct (in the Zwitterion form; N-H1…O1 H-bond). Click here to View figure |
The Natural Population Analysis Atomic Charges
The interaction between the electron deficient M (in MFn) with DMAB, for sure, will withdraw electron density and causes changes in the atomic charges of each atom in the skeleton. Shedding light on the values of the atomic charges can help in understanding the changes in the electron density distribution in general and the consequences of the Lewis acid (MFn) on the H-bond (as a sub-molecular event) specifically. Table 4 presents the natural population analysis charges of all the derivatives. The data show that the interaction of a Lewis acid with DMAB has only small effect on the charge of H1 even with the increase in the O1-H1 bond length. In general, the charge values of H1, O1, C1, and O2 do not show systematic change with the H-bond strength that is predicted based on the structural parameters (O1-H1 and N…H1 values) which indicates that the change may be a result of a complex effect of intra-molecular parameters that are not straight forward to analyze.
On the other hand, it appears that the atomic charge of C2 is affected noticeably. Figure 3 of group IIIA shows that the C2 charge changes smoothly with the change in the O1-H1 bond length and therefore with the N…H1-O1 H-bond strength (the predicted H-bond order DMAB<BF3<GaF3<AlF3<InF3). On the other hand, the fifth period Lewis acids group shows random effects on the values of the C2 atomic charges. In general, the variations in the C2 atomic charges imply that the change may be also a result of a complex effect of intra-molecular parameters. However, in general, adding the Lewis acid increases the value of the negative charge of C2. This is attributed to the increase in the electron withdrawing capability of the carboxylic acid group after bonding to the Lewis acid. Therefore, a negative charge accumulates on C2 to stabilize the electron deficiency of the carboxylic acid group. The smaller C2 charge value is found in the YF3 adduct in which the carboxylic acid group is converted to the carboxylate group which is less deficient in and therefore weaker as electron withdrawing group.
Table 4: The natural population analysis atomic charges of all the derivatives.
|
Substrate |
H1 |
O1 |
C1 |
O2 |
N |
C2 |
|
DMAB |
0.49482 |
-0.7006 |
0.80422 |
-0.6044 |
-0.6011 |
-0.1682 |
|
BF3 |
0.49802 |
-0.6299 |
0.86654 |
-0.6386 |
-0.5971 |
-0.1755 |
|
AlF3 |
0.4982 |
-0.632 |
0.86759 |
-0.75 |
-0.5948 |
-0.1823 |
|
GaF3 |
0.49897 |
-0.6388 |
0.85845 |
-0.7183 |
-0.5952 |
-0.1811 |
|
InF3 |
0.49918 |
-0.6448 |
0.85493 |
-0.7315 |
-0.5941 |
-0.1831 |
|
AgF |
0.49847 |
-0.6647 |
0.83815 |
-0.6743 |
-0.5979 |
-0.1765 |
|
CdF2 |
0.50272 |
-0.7021 |
0.82688 |
-0.6414 |
-0.5966 |
-0.1745 |
|
SnF4 |
0.5006 |
-0.6486 |
0.85639 |
-0.7132 |
-0.5965 |
-0.1787 |
|
SbF5 |
0.49739 |
-0.6173 |
0.86779 |
-0.7362 |
-0.5933 |
-0.181 |
|
SrF2 |
0.49947 |
-0.7389 |
0.82567 |
-0.6743 |
-0.5874 |
-0.1767 |
|
YF3 |
0.47886 |
-0.7025 |
0.79316 |
-0.7712 |
-0.4993 |
-0.1494 |
|
ZrF4 |
0.49895 |
-0.651 |
0.86026 |
-0.6778 |
-0.5976 |
-0.1773 |
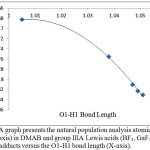 |
Figure 3: A graph presents the natural population analysis atomic charge of C2 (Y-axis) in DMAB and group IIIA Lewis acids (BF3, GaF3, AlF3, and InF3) adducts versus the O1-H1 bond length (X-axis). Click here to View figure |
Figures 4 and 5 illustrate that the charge of the nitrogen atom decreases (versus O1-H1 bond length) due to the interaction between DMAB and the Lewis acid for both group 3A Lewis acids and the fifth period Lewis acids groups. Despite of the small change in the charge of nitrogen, this smooth decrease as the H-bond strength increase may allow picturing the electron density of the nitrogen lone pair extending in the intra-molecular space toward H1 and supports that the (N…H1-O1) H-bond is not a pure positive-negative interaction but involves a charge delocalization and may have a covalent character. Further support to this conclusion comes when the H1transfer spontaneously (without a transition state) and bonds to the nitrogen atom where the nitrogen electron density becomes the smallest (-0.49925) in case of YF3.
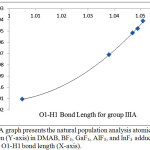 |
Figure 4: A graph presents the natural population analysis atomic charge of nitrogen (Y-axis) in DMAB, BF3, GaF3, AlF3, and InF3 adducts versus the O1-H1 bond length (X-axis). Click here to View figure |
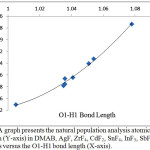 |
Figure 5: A graph presents the natural population analysis atomic charge of nitrogen (Y-axis) in DMAB, AgF, ZrF4, CdF2, SnF4, InF3, SbF5, and SrF2 derivatives versus the O1-H1 bond length (X-axis). Click here to View figure |
The Infrared (IR) Stretching Frequencies and the Nuclear Magnetic Resonance Chemical Shifts (1H-NMR)
Table 5 presents the O1-H1 stretching frequency of DMAB and the Lewis acids adducts. The values illustrate that bonding to the Lewis acid (as it increases the O1-H1 bond length) is accompanied by weakening the O1-H1 bond. For group 3A, the values illustrate that the O1-H1 bond strength show the following order: DMAB>BF3>GaF3>AlF3>InF3. It confirms that the N…H H-bond strength is stronger in case of indium adduct. On the other hand, the order of the O1-H1 bond strength of the fifth period Lewis acids is: AgF> CdF2> ZrF4> SnF4> InF3> SbF5> SrF2. This sequence also confirms that SrF2 is the most effective Lewis acid and the H-bond in its adduct is also the strongest among these cases. This classification is consistent with the order of the H-bond strength that is predicted based on the O1-H1 bond length and the N…H distance. The H-bond strength according to the infrared stretching frequencies is arranged as the following: DMAB< AgF< CdF2< ZrF4< BF3< SnF4< GaF3< AlF3< InF3< SbF5< SrF2.
Table 5: The O1-H1 infrared stretching frequencies (cm-1) of DMAB and the Lewis acid derivatives (Figure 1). The value between parentheses is the difference with respect to DMAB value.
|
Substrate |
O1-H1 |
Substrate |
O1-H1 |
|
DMAB |
2999 (—) |
AgF |
2556 (443) |
|
BF3 |
2506 (493) |
CdF2 |
2538 (461) |
|
AlF3 |
2362 (637) |
SnF4 |
2472 (527) |
|
GaF3 |
2387 (612) |
SbF5 |
2288 (711) |
|
InF3 |
2332 (667) |
ZrF4 |
2532 (467) |
|
SrF2 |
2032 (967) |
Table 6: The 1H-NMR chemical shift data (versus tetramethylsilane; ppm) for DMAB and the Lewis acid derivatives (Figure 1).
|
Substrate |
H1 |
Substrate |
H1 |
|
DMAB |
14.6 |
AgF |
17.9 |
|
BF3 |
18.2 |
CdF2 |
17.7 |
|
AlF3 |
19 |
SnF4 |
18.4 |
|
GaF3 |
18.9 |
SbF5 |
19.3 |
|
InF3 |
19.4 |
ZrF4 |
18 |
|
SrF2 |
20.1 |
Protons that are involved in strong hydrogen bonding are known to be highly deshielded (15-17ppm) [48]. The chemical shifts in this study were calculated versus tetramethylsilane (TMS) using the B3LYP/6-311+G(2d,p)-SDD level of theory. Table 6 presents the values of H1. In general, bonding of the Lewis acid increases the chemical shift which illustrates that this decreases the net electron density around H1 nuclei. The change among the values in group 3A Lewis acids adducts is consistent with the change in the infrared stretching frequency of the O1-H1 bond (Table 5) and the O1-H1 bond length values (Table 1). The 1H-NMR values of group 3A adducts indicate that the lowest electron density around H1 and therefore the strongest H-bond is due to InF3 (as a result of increasing the O1-H1 bond length in response to the N…H1 H-bond). The order of the H-bond strength is identical to that estimated by the IR and the structural parameters data (DMAB< BF3< GaF3< AlF3< InF3). On the other hand, the lower chemical shift value of the SbF5 adduct (compared to InF3) implies that there is an interfering factor(s) (other than the N…H1 H-bond) causes the value to be slightly lower. It is assumed that the unexpected variation among the fifth period chemical shifts is due to a through-space shielding effect by the Lewis acid.
The AIM Bond Critical Point Electron Densities (BCP)
The bond critical point electron density (BCP) of malonaldimine tautomer (Figure 6) can be used to estimate the bond order of the N…H1 H-bond in the adducts, which allows understanding the nature of this interaction (electrostatic or covalent). Table 7 presents the BCP values of malonaldimine (BCP-T) and its transition state (BCP-TS) calculated using six protocols based on the B3LYP/6-31G(d,p) geometries. The results show that the three basis sets give the same bond order in each group (B3LYP or HF) and the two groups produce very similar results. Therefore, the B3LYP/3-21G and HF/3-21G protocols were adopted to calculate the BCP values of the Lewis acids adducts (Table 8). Some BCP values could not be obtained due to unknown reasons. Therefore, the bond order values of these incomplete calculations were estimated as illustrated (Table 8).
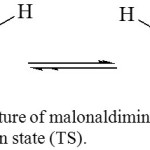 |
Figure 6: The structure of malonaldimine tautomer (T) and its transition state (TS). Click here to View figure |
Table 7: The bond critical point values of malonaldimine tautomer (BCP-T) and its transition state (BCP-TS).
|
Method |
BCP-T |
BCP-TS |
Approximate |
|
Bond Order |
|||
|
B3LYP |
|||
|
6-311+G(2d,p) |
0.323 |
0.161 |
0.5 |
|
6-31G(d,p) |
0.327 |
0.164 |
0.5 |
|
3-21G |
0.3 |
0.15 |
0.5 |
|
HF |
|||
|
6-311+G(2d,p) |
0.326 |
0.155 |
0.48 |
|
6-31G(d,p) |
0.332 |
0.158 |
0.48 |
|
3-21G |
0.298 |
0.143 |
0.48 |
Previous study by Koch and Popelier illustrated that when there is electron density delocalization that exceeds 0.04 (a. u.) from the H-bond acceptor toward the H-bond donor then the H-bond starts to have a covalent character [49]. Both B3LYP and HF calculations show that all the (N…H1) H-bonds have covalent nature not just electrostatic interactions. Also, the BCP value increases after adding Lewis acid and the bond order values are in the 0.27-0.34 range (B3LYP/3-21G calculations). The highest BCP and bond order values of the N…H1 interaction are found in the derivative of SrF2. On the other hand, the values confirm that the strongest interaction between DMAB and Lewis acid is in case of YF3, which causes crossing the borderline from the case of the strongest H-bond (in SrF2 derivative) to the spontaneous transfer of H1 to the nitrogen atom to generate the Zwitterion structure where it forms a strong covalent bond (bond order= 0.84).
Table 8: The calculated bond critical point electron densities (BCP) and the approximate bond order (BO) values of DMAB and the Lewis acid derivatives using B3LYP and Hartree-Fock (HF) methods.
|
B3LYP/3-21G |
HF/3-21G |
|||
|
Substrate |
BCP |
BO |
BCP |
BO |
|
DMAB |
0.066 |
0.22 |
0.063 |
0.21 |
|
BF3 |
0.084 |
0.28 |
0.08 |
0.27 |
|
AlF3 |
– |
0.29a |
0.084 |
0.28 |
|
GaF3 |
– |
0.29a |
0.083 |
0.28 |
|
InF3 |
0.09 |
0.3 |
0.085 |
0.29 |
|
AgF |
0.082 |
0.27 |
0.078 |
0.26 |
|
CdF2 |
0.083 |
0.28 |
0.078 |
0.26 |
|
SnF4 |
– |
0.28a |
0.08 |
0.27 |
|
SbF5 |
0.092 |
0.31 |
– |
0.30b |
|
SrF2 |
0.101 |
0.34 |
0.096 |
0.32 |
|
YF3 |
0.253 |
0.84 |
0.248 |
0.83 |
|
ZrF4 |
– |
0.28a |
0.079 |
0.27 |
a: Estimated by multiplying the HF value by (0.50/0.48; (B3LYP/3-21G)/(HF/3-21G) bond order values of malonaldimine transition state in Table 7).
b: Similarly, estimated by multiplying the B3LYP value by (0.48/0.50).
The Charge Delocalization Energy
The data presented in Table 9 are the charge delocalization energies that are associated with a charge delocalization from nitrogen lone pair to empty (anti-bonding) orbital on H1. It is important to realize that these energy values are not bond energies but they are intra-molecular stabilization energies. Also, the increase in the value indicates that the (N…H-O1) H-bond is stronger. This applies to any other charge delocalization process.
The theory predicts the H-bond in the CdF2 derivative stronger than that in BF3 derivative which is opposite to what became known from the structural parameters and the infrared stretching vibrations. The exact reason for this is unknown yet however it is possible to confirm qualitatively that the H-bond strength follows similar order: DMAB<AgF, BF3, CdF2< ZrF4< SnF4< GaF3< AlF3< InF3< SbF5< SrF2. Determining the H-bond energy may be estimated from the model equilibrium that is presented in Figure 7. This model has one advantage over the model that was proposed previously [26] to estimate the H-bond strength of DMAB. The nitrogen atom in the new model (Figure 7) has the same hybridization (sp3) as the nitrogen atom in DMAB while it is sp2 in the previous model (CH2=N-CH=CH-COOH), which in turn provides more accurate estimation of the H-bond. It was noticed that replacing the potassium ion with the sodium ion caused formation of the Zwitterion structure. The potassium ion provides advantage over the other Lewis acids by its simplicity and by being in the range of the atoms that can be covered in the B3LYP/6-311+G(2d,p) calculations (single point) of the model equilibrium.
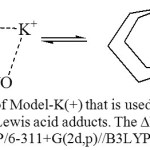 |
Figure 7: The equilibrium of Model-K(+) that is used to estimate the H-bond stabilization energy in the Lewis acid adducts. The ∆E (13.37 kcal/mol) was calculated using the B3LYP/6-311+G(2d,p)//B3LYP/6-31G(d,p) protocol. Click here to View figure |
Table 9: The charge delocalization energy (kcal/mol) of the (N…H1-O1) H-bond, the H-bond energy based on Model-K(+) (HBE(1)), and the H-bond energy based on malonaldimine transition state (HBE(2)) (Figure 6) (kcal/mol).
|
Substrate |
N→H1-O1 |
HBE(1) |
HBE(2) |
|
DMAB |
27.22 |
7.08 |
7.57 |
|
BF3 |
44.81 |
11.65 |
12.47 |
|
AlF3 |
83.99 |
21.84 |
23.37 |
|
GaF3 |
82.32 |
21.4 |
22.9 |
|
InF3 |
85.75 |
22.3 |
23.86 |
|
AgF |
42.22 |
10.98 |
11.75 |
|
CdF2 |
72.55 |
18.86 |
20.19 |
|
SnF4 |
76.25 |
19.83 |
21.22 |
|
SbF5 |
89.52 |
23.28 |
24.91 |
|
ZrF4 |
73.17 |
19.02 |
20.36 |
|
SrF2 |
106.27 |
27.63 |
29.57 |
This model (Figure 7) allows calculating the energy difference (∆E) that represents the estimated H-bond energy using the fully optimized structures, which eliminates any stabilizing or destabilizing intra-molecular interactions. In addition to that, it is possible to calculate the charge delocalization energy (CDE) that is associated with the (N…H1-O1) H-bond energy. We could calculate the two values for the potassium ion derivative (∆E= 13.37 and CDE= 52.14 kcal/mol). The ratio (∆E/CDE= 0.26) between the two values was used to estimate the H-bond energy for DMAB and the Lewis acid derivatives (Table 9) by multiplying this ratio by the CDE of each Lewis acid derivative of DMAB.
A further support to the estimated H-bond energies (HBE(2), Table 9) was obtained from malonaldimine molecular system in a slightly different approach. This compound can go through a proton transfer transition state to generate the second identical tautomer. The bond critical point electron density (BCP) was calculated for the tautomer (BCP-T= 0.300; B3LYP/3-21G) and the transition state (BCP-TS= 0.150; B3LYP/3-21G) and the values were used to calculate the bond order of the (N…H1) H-bond in the transition state (BO= 0.50). This indicates that the electron density of the nitrogen lone pair can extend in space toward the proton, which implies that the transferring proton is stabilized by significant charge delocalization from the two nitrogen atoms. The energy of this charge delocalization process is equal to170 kcal/mol (N→H), which covers all the CDE values of DMAB Lewis acid derivatives. The rough estimation (based on MP4(SDTQ)/6-31G(d,p)) for the two (N…H) energies of malonaldimine transition state is equal to 94.5 kcal/mol. This indicates that the 170 kcal/mol of charge delocalization energy (CDE) would be equivalent to 47.3 kcal/mol (of one N…H interaction in the transition state). Therefore, the CDE of the SrF2 Lewis acid derivative (106 kcal/mol) is equivalent to 29.5 kcal/mol (H-bond energy). This value is close and supports the value that was obtained using Model-K(+) (Figure 7). The H-bond energy of the other derivatives were calculated similarly. The HBE(1) and HBE(2) data are in excellent agreement. To best of our knowledge, examining the previous works indicates that the H-bond within the structure of DMAB-SrF2 derivative (27.6-29.5 kcal/mol) is the highest H-bond energy of neutral system in the literature.
Conclusion
In this study, the density functional theory was employed to understand possible effects of Lewis acids on organic structures, specifically, on various electronic structure aspects related to H-bond of 2-dimethylaminobenzoic acid (DMAB) interacting with various Lewis acids as model. We summarize the results in the following.
It appears that the interaction with Lewis acids affects mostly the carboxylic acid group and the Me2N…HOOC interaction. The effect of the Lewis acid does not extend to influence the structural parameters of the benzene ring.. Contrary to the rest of the structures, the SrF2 and YF3 derivatives show that the O1-M and O2-M distances are close to each other and within the range that confirms bonding of the metal center to O2 as well as to O1.
The atomic charge values illustrate that formation of adduct between a Lewis acid and a substrate may not be a simple process (in terms of electron density distribution) as may be expected. The atomic charges of H1, O1, C1, and O2 do not show a systematic change which implies that the net local electron density may be affected by many complex factors. Further from the interaction center (HOCO…MFn), more smooth and systematic change is observed, the electron density of the nitrogen atom decreases due to the interaction between DMAB and the Lewis acid and reaches the lowest value when it bonds to H1 as a result of Zwitterion formation in case of yttrium Lewis acid.
The infrared data of DMAB and the Lewis acids derivatives illustrate that bonding to the Lewis acid (as it increases the O1-H1 bond length) is accompanied by significant shift (decrease) in the O1-H1 stretching frequency (reaches 967 cm-1 less than the value of DMAB). The chemical shifts (calculated versus tetramethylsilane (TMS)) of H1 nuclei indicate that bonding of the Lewis acid increases the chemical shift (20.1 ppm of SrF2 derivative) which illustrates that this decreases the net electron density around H1 nuclei.
Using the Atoms-In-Molecules theoretical protocol and malonaldimine as a model the bond order of the N…H1 interaction could be estimated. The results illustrate that the H-bond is not just electrostatic interaction but have a covalent character that may reach up to 34% (of SrF2 derivative) of the N-H σ-bond in malonaldimine.
We proposed two approaches to estimate the H-bond energy based on charge delocalization energy. This allowed refining the H-bond strength of DMAB. The values indicate that the H-bond energy increases significantly upon interaction of DMAB with Lewis acid. The H-bond energy may reach up to 28-30 kcal/mol (of SrF2 derivative) which is found the strongest possible neutral hydrogen bond in the literature.
The results illustrate that Lewis acids may push the electronic structure of an organic skeleton to the frontiers. The unprecedented result is that a neutral H-bond may maximize to reach up to one-third the energy and the bond order of covalent bond. Therefore, these examples are unique and novel addition to the theory of H-bonding. These findings are of fundamental importance in organic chemistry, inorganic chemistry, biochemistry, physical chemistry, and materials chemistry.
Acknowledgement
We thank Al-Hussein Bin Talal University for supporting this research through research grant number 78/2008.
References
- Desiraju, G.R.; Steiner, T. The Weak Hydrogen Bond in Structural Chemistry and Biology, Oxford University Press Inc., New York, NY, USA, 1999.
- Sobczyk, L.; Chudoba, D.; Tolstoy, P.M.; Filarowski, A. Molecules, 2016, 21, 1657-1675.
CrossRef - Gilli, G.; Gilli, P. The Nature of the Hydrogen Bond, Oxford University Press Inc., New York, NY, USA, 2009.
CrossRef - Grabowski, S.J. Chem. Rev. 2011, 11, 2597-2625.
CrossRef - Grabowski, S.J., Ed., Hydrogen Bonding—New Insights, Springer, Dordrecht, The Netherlands, 2006.
CrossRef - Arunan, E.; Desiraju, G.R.; Klein, R.A.; Sadlej, J.; Scheiner, S.; Alkorta, I.; Clary, D.C.; Crabtree, R.H.; Dannenberg, J.J.; Hobza, P.; et al. Pure Appl. Chem. 2011, 83, 1637–1641.
CrossRef - Doskocz, M.; Gancarz, R. Phosphorus Sulfur Silicon Relat. Elem. 2009, 184, 1363-1373.
CrossRef - Nishio, M.; Hirota, M.; Umezawa, Y. The CH/π Interaction: Evidence, Nature and Consequences, Wiley, New York, NY, USA, 1998.
- Feldblum, E.S.; Arkin I.T. PNAS 2014, 111, 4085-4090.
CrossRef - Larson, J.W.; McMahon, T.B. Inorg. Chem. 1984, 23, 2029–2033.
CrossRef - Emsley, J. Chem. Soc. Rev. 1980, 9, 91–124.
- Jorgensen, W.L.; Madura, J.D. Mol. Phys. 1985, 56, 1381-1392.
CrossRef - Zielkiewicz, J. J. Chem. Phys. 2005, 123, 104501-104506.
CrossRef - Jeffrey, G.A.; Saenger, W. Hydrogen Bonding in Biological Structures, Springer, Berlin, Germany, 1991.
CrossRef - Richardson, T.B.; de Gala, S.; Crabtree, R.H. J. Am. Chem. Soc. 1995, 117, 12875–12876.
CrossRef - Siegbahn, Per E.M.; Eisenstein, O; Rheingold, A.L.; Koetzle, T.F. Acc. Chem. Res. 1996, 29, 348–354.
- Allen, F.H. The Cambridge Structural Database: A quarter of a million crystal structures and rising, Acta Crystallogr. Sect. B—Struct. Sci. 2002, 58, 380–388.
CrossRef - Belkova, N.V.; Shubina, E.S.; Gutsul, E.I.; Epstein, L.M.; Eremenko, I.L.; Nefedov, S.E. J. Organomet. Chem. 2000, 610, 58–70.
CrossRef - Fanfrlík, J.; Lepšík, M.; Horinek, D.; Havlas, Z.; Hobza, P. ChemPhysChem 2006, 7, 1100–1105.
CrossRef - Dhaneshwar, N.N.; Pant, L.M. Acta Crystallogr. B 1973, 29, 2980-2982
CrossRef - Rao, K.R.K.; Jose, C.I. J. Mol. Struct. 1973, 18, 447-456.
CrossRef - Rao, K.R.K.; Jose, C.I. Spectrochim. Acta A 1974, 30, 859-860.
CrossRef - Jose, C.I.; Belhekar, A.A.; Agashe, M.S. Spectrochim. Acta A 1988, 44, 899-901.
CrossRef - http://webbook.nist.gov/cgi/cbook/.cgi?ID=C610162&Mask=80 [24 August 2010].
- Irshaidat, T.; Saraireh, I.A.M.; Akintola, O. J. Chem. Soc. Pak. 2012, 34, 815-818.
- Mori, H.; Miyoshi, E. Bull. Chem. Soc. Jap. 2004, 77, 687-690.
CrossRef - Mó, O.; Yáñez, M.; Alkorta, I.; Elguero, J. J. Chem. Theory Comput. 2012, 8, 2293-2300.
CrossRef - Irshaidat, T. Quim. Nova 2014, 37, 1446-1452.
- Frisch, M.; trucks, G.; Schlegel, H.; Scuseria, G.; Robb, M.; Cheeseman, J.; Montagomery, J.; Verven, JR.; Kudin, K.; Burant, J.; Iyenger, S.; Tomasi, J.; Barone, V.; Mennucci, B.; Cossi, M.; Scalmani, G.; Rega, N.; Petersson, G.; Nakatsuji, H.; Hada, M.; Toyota, K.; Fukuda, R.; Hasegawa, J.; Ishida, M.; Nakajima, T.; Honda, Y.; Kitao, O.; Nakai, H.; Klene, M.; Li, X.; Konx, J.; Hratchian, H.; Cross, J.; Adamo, C.; Jaramillo, J.; Gomperts, R.; Stratmann, R.; Yazyev, O.; Austin, A.; Cammi. R.; Pomelli, C.; Ochterski, J.; Ayala, P.; Moromuka, K.; Voth, G.; Salvador, P.; Dannenberg, J.; Zakrzewski, V.; Dapprich, S.; Daniels, A.; Strain, M.; Farkas, O.; Malick, D.; Rabuck, A.; Raghavachari, K.; Foresman, J.; Ortiz, J.; Cui, Q.; Baboul, A.; Clifford, S.; Cioslwski, J.; Setvanov, B.; Liu, G.; Liashenko, A.; Piskorz, P.; Komaromi, I.; MArton, R.; Fox, D.; Keith, T.; Al-Laham, M.; Peng, C.; Nanayakkara, A.; Challacombe, M.; Gill, P.; Johnson, B.; Chen, w.; Wong, M.; Gonzalez, C.; Pople, J.: Gaussian 03, Revision E.1, Gaussian, Inc., Pittsburgh PA 2003.
- Andrada, D.M.; Oscar, J.; Jimenez-Halla, C.; Solá, M. J. Org. Chem. 2010, 75, 5821-5836.
CrossRef - M.A. Alvarez, I. Amor, M.E. Garciá, D. García-Vivó, M.A. Ruiz, J. Suárez, Organometallics 2010, 29, 4384-4395.
CrossRef - Irshaidat, T. Jordan J. Chem. 2013, 8, 125-137.
- Becke, A.D. J. Chem. Phys. 1993, 98, 5648-5652.
CrossRef - Lee, C.; Yang, W.; Parr, R.G. Phys. Rev. B 1988, 37, 785-89.
CrossRef - Lee, T.J.; Taylor, P.R. Int. J. Quantum Chem., Quant. Chem. Symp. S23 1989, 199-207.
- Vosko, S.H.; Wilk, L.; Nusair, M. Can. J. Phys. 1980, 58, 1200-11.
CrossRef - Francl, M.M.; Pietro, W.J.; Hehre, W.J.; Binkley, J.S.; DeFrees, D.J.; Pople, J.A.; Gordon, M.S. J. Chem. Phys. 1982, 77, 3654-3665.
CrossRef - Dunning Jr., T.H.; Hay, P.J. Modern Theoretical Chemistry, Ed. Schaefer III, H.F. Plenum, New York, 1976, 3, 1-28.
- Igel-Mann, G.; Stoll, H.; Preuss, H. Mol. Phys. 1988, 65, 1321-1328.
CrossRef - Stoll, H.; Fuentealba, P.; Schwerdtfeger, P.; Flad, J.; Szentpaly, L.V.; Preuss, H. J. Chem. Phys. 1984, 81, 2732-36.
CrossRef - Andrae, D.; Haeussermann, U.; Dolg, M.; Stoll, H.; Preuss, H. Theor. Chem. Acc. 1990, 77, 123-141.
CrossRef - Cioslowski, J.; Nanayakkara, A.; Challacombe, M. Chem. Phys. Lett. 1993, 203, 137-142.
CrossRef - Cioslowski, J. Chem. Phys. Lett. 1992, 194, 73-78.
- Cioslowski, J.; Nanayakkara, A. Chem. Phys. Lett. 1994, 219, 151-154.
CrossRef - Raghavachari, K.; Binkley, J.S.; Seeger, R.; Pople, J.A. J. Chem. Phys.1980, 72, 650-654.
CrossRef - Glendening, E.D.; Reed, A.E.; Carpenter, J.E.; Weinhold, F. NBO Version 3.1.
- Wolinski, K.; Hilton, J.F.; Pulay, P. J. Am. Chem. Soc. 1990, 112, 8251-8260.
CrossRef - Antonov, L., Tautomerism: Concepts and Applications in Science and Technology, 2016, Wiley-VCH Verlag GmbH & Co. KGaA, Germany, page 36.
- Koch, U.; Popelier, P. J. Phys. Chem. 1995, 99, 9747-9754.
CrossRef

This work is licensed under a Creative Commons Attribution 4.0 International License.
![]()
A New Edition of Web of Science
Journal Impact Factor
2022: 0.5
Five Year: 0.8
Journal is Indexed in

Cabells Whitelist
![]()


