Adsorption of Thymol Blue and Erythrosine-B on MWCNTs Functionalized by N-(3-nitrobenzylidene)- N'-trimethoxysilylpropyl-ethane-1,2-diamine Equilibrium, Kinetics and Thermodynamic Study
Farveh Raoufi and Hossein Aghaie
Department of Chemistry, Science and Research Branch, Islamic Azad University, Tehran P.O. Box 14515-755, Tehran, Iran.
DOI : http://dx.doi.org/10.13005/ojc/330550
We have accomplished a synthesized of an adsorption material through anchoring N-(3nitro-benzeyliden)-N-trimethoxysilylpropylethan-1,2-diamin onto multi-wall-carbon nanotube. The systems were established via SEM and FT-IR techniques. Then, it was used for removing the ultra-sound-assisted for Thymol Blue (TB) and Erythrosine-B (EB).The pH dependency and initial dyes concentration, sonication time and adsorbent’s dosage for the removing percentage of Thymol Blue and Erythrosine-B which have investigated by CCD or Central-Composite Designing. It was exhibited that the Thymol Blue and Erythrosine-B adsorption follows, while the Langmuir models explain the equilibriums variables.
KEYWORDS:Multi-Walled Carbon Nanotubes; Surface Methodologies; Ultra Sounded-Assisted Dye Removing; Thymol Blue (TB) and Erythrosine-B (EB)
Download this article as:| Copy the following to cite this article: Raoufi F, Aghaie H. Adsorption of Thymol Blue and Erythrosine-B on MWCNTs Functionalized by N-(3-nitrobenzylidene)- N'-trimethoxysilylpropyl-ethane-1,2-diamine Equilibrium, Kinetics and Thermodynamic Study. Orient J Chem 2017;33(5). |
| Copy the following to cite this URL: Raoufi F, Aghaie H. Adsorption of Thymol Blue and Erythrosine-B on MWCNTs Functionalized by N-(3-nitrobenzylidene)- N'-trimethoxysilylpropyl-ethane-1,2-diamine Equilibrium, Kinetics and Thermodynamic Study. Orient J Chem 2017;33(5). Available from: http://www.orientjchem.org/?p=38205 |
Introduction
Dyes and pigments have been released in the waste-waters from textiles, papers, rubbers, plastics, leathers, cosmetics, foods, and drug industries1. These dyes make allergic dermatitis1, skins irritation, cancers and mutations in living1,2 organism. It also causes eyes burn, which might be reason for permanent injuries to the eye’s human and animal also.. Discharge1,2 of a dye into waters sources threaten the water supplies and qualities due to irr-efrangible2 under harshest condition, toxicities, accumulations and magnifications throughout3 the foods chain2,3. The high colored’s effluents not only cause damages for living but human being via producing mutagenic3 effects3.
Dye generally has a complex aromatics structure which makes them stables and difficulty for decomposing. The dye presents in wastewater3 absorbs sunlight’s leading to decreasing in the efficiencies of photo-synthesis in the aquatic plant due to reducing lights penetration4.
Among various types of dye including anionic4, cationic5 (basically dye), and non-anion (disperse5 dye), the positive ion is the most toxic dyes5. Among various methods of dye’s removal from aqueous solutions such as membrane6 separation6 are important. For the chemical oxide materials the adsorption techniques are known as an important methods for dye removal7,8.
Thymol Blues, belongs to tri-phenyl-methane7 groups, have biological activities same stains agents. The TB8 dyes are also used for pH indicators in analytical chemistries. Inhalation leads to respiratory8 tract exposures and subsequently8. Skin Contacts may causes irritations with redness8 and pain9.
Erythrosine-B is a water-soluble xanthenes class of dye. It is extremely used as colorant9 in foods, textiles, drugs and cosmetics10. In high dose it cause several types9,10 of allergies10, thyroid activity, carcinogenicities, DNA damages, and neurotoxicity’s behavior in the human9 and animal. The photo-chemicals and bio-chemicals degradations of the erythrosine10 are not suggested because for formation toxic by-products 10. Adsorptions are the best techniques11 for removing of toxics and noxious12 impurity in comparison12 to other conventional13 protocols same as chemical coagulation12,13, ion exchanges, electrolysis of electrolytes, biological13 treatment which are related to advantages14. Adsorption technique12 also have a lot of efficiencies for the removing pollutant which are highly stables in biological degradations process through economically14 mild pathways11-13. Of those methods14, nanomaterial’s based adsorbent is highly recommended for dye pollutant removal14,15. The suitable figures15 of merit in multi components dye system removing are based on development15 of novel16 methods which permits15 its accurate simultaneous15,16 determination of mixture. The encounters difficulty is serious peak overlapping16 that subsequently17 impossible for its direct determination in the mixtures using general equations like Beer–Lamberts. Derivatives spectroscopies efficiently are applicable17 for resolving absorption peak overlaps through its separations and corrections of background interference16. These methods are based on searching18 the wavelength which able to accurate18 and repeatable17 monitoring for each specie in the complexes without no interferences from the other targets compounds 16,17. The classical optimization of protocols failed for giving useful information of interactions between several variables17. Central composites design or CCD18 under surface methodologies can be applied18 for handling of both variable involving and response without suffers above-mentioned19 draw backs. These approaches enable us for making a suitable predicative models for applying several factor even in the presence19 of complexes interaction for describing and finding the best optimized condition with less times elapsed18,19.
In this Paper, MWCNT has been modified with N-(3-nitro-benzylidene)- N-tri methoxy silylpropyl-ethane1,2diamine as the best adsorbents using FTIR and SEM. This adsorbent was used for the ultrasound-assisted removal of Thymol Blue and Erythrosine-B from aqueous solutions. The influences of variables initial Thymol Blue and Erythrosine-B as well as its interaction were investigated under response surface methodology19.
Experimental
Materials and Instruments
Thymol Blue and Erythrosine-B supply from Merck in Germany. The stocks solution20 of one hundred mg/L for every dyes were getting dissolutions of ten milligram of which in 100 milliliter double distilled waters, separately and are suitable dilute20 on performing for obtain worked solution with desired concentration21. R, N-(3-(tri meth oxysilyl)-propyl) ethylene diamine (TSPED) and 2-nitrobenzaldehyde (NBA) was purchased through SigmaAldrich. Multi-walled carbon nanotube was supplied via RiedelDeHean and other reagents22 was used for analytical grades in the Merck Company22. The pH/Ion-meter was used for the pH measurement. Dye Thymol Blue and Erythrosine-B concentration was determined using Jasco UVVis spectrophotometric model V530, at wave-length of 430 nm and 580 nm, respectively23.
The ultrasonic24 bath including heating systems were used at frequencies 60Hz and power 130W. The morphologies of the NBATSPEDMWCNT were studied by SEM Hitachi, model S4160. The FTIR spectrophotometer for compound was recorded on the JASCO680” instrument in areaof 380-4200 cm−1 using potassium bromide pellets with molratio 1: 100 for the sample of potassium bromide the software MINITAB version 6.2.4.4 were used for experiment designing and its subsequent regression analysis24.
Preparation of NBATSPED-MWCNT
At first step, tri methoxy silylpro pylethylene diamines support on MWCNT-(NH2-MWCNT) were synthesized through the reactions of 1.85 mL N-(3-(tri methoxysilyl)-propyl) ethylene diamine and 0.15 gramm MWCNT in 20 milliliter of dichloromethan under reflux at forty degree in the oil bath for twenty four hours. Then, the obtained solids were filtered. The products were filtered, washed with fifty milliliters of C2H5OH, double distilled water and then dried in oven for 10 h 50oC. These step are presented in the Fig.1.
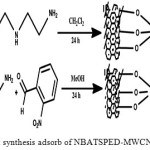 |
Figure 1: synthesis adsorb of NBATSPED-MWCNT. Click here to View figure |
Ultra-sounded-assist a-multicomponent adsorb of Thymol Blue (TB) and Erythrosine-B (EB) on to NBATSPED-MWCNT
The batches process using NBA..MWCNT in presence of ultrasounds were applied for binaries adsorption of Thymol Blue and Erythrosine-B. The vessels were immersed in the ultrasonic baths for four minutes at room temperature and then the solution was centrifuged.
Adsorption equilibrium study
The equation and parameter of the isotherm of the research has been reported in Tables 1 and 2, respectively20-26.
 |
Table 1: Equation model used in this study Click here to View table |
Table 2: parameter applied in this work
| Coefficients | Descriptions |
| KF | Freundlich isotherm constant (dimensionless) |
| n | Freundlich isotherm exponent (dimensionless) |
| KL | Langmuir constants |
| qm | Maximum adsorption capacities |
| Run | X1 | X2 | X3 | X4 | X5 | R %TB | R %EB |
| 1 | 10 | 20 | 7 | 0.035 | 2 | 98 | 100 |
| 2 | 15 | 15 | 4 | 0.025 | 4 | 95 | 95 |
| 3 | 20 | 20 | 7 | 0.035 | 6 | 97.9 | 99.4 |
| 4 | 25 | 15 | 6 | 0.025 | 4 | 98 | 100 |
| 5 | 15 | 15 | 6 | 0.025 | 4 | 94.45 | 94.87 |
| 6 | 10 | 10 | 7 | 0.015 | 2 | 88 | 88 |
| 7 | 10 | 10 | 7 | 0.035 | 6 | 100 | 100 |
| 8 | 15 | 15 | 8 | 0.025 | 4 | 97.5 | 95.77 |
| 9 | 15 | 15 | 6 | 0.025 | 4 | 95 | 95 |
| 10 | 15 | 15 | 6 | 0.025 | 4 | 94.7 | 95 |
| 11 | 20 | 10 | 7 | 0.015 | 6 | 95 | 95 |
| 12 | 10 | 10 | 5 | 0.035 | 2 | 100 | 100 |
| 13 | 15 | 15 | 6 | 0.025 | 4 | 95 | 95 |
| 14 | 15 | 5 | 6 | 0.025 | 4 | 97 | 99 |
| 15 | 10 | 20 | 5 | 0.035 | 6 | 100 | 100 |
| 16 | 15 | 15 | 6 | 0.025 | 4 | 95 | 95 |
| 17 | 20 | 20 | 5 | 0.015 | 6 | 73 | 81.8 |
| 18 | 15 | 15 | 6 | 0.005 | 4 | 70 | 78.8 |
| 19 | 20 | 10 | 5 | 0.015 | 2 | 80 | 96.47 |
| 20 | 20 | 10 | 7 | 0.035 | 2 | 99.69 | 100 |
| 21 | 10 | 20 | 5 | 0.015 | 2 | 88.5 | 90 |
| 22 | 20 | 20 | 5 | 0.035 | 2 | 100 | 98.45 |
| 23 | 15 | 25 | 6 | 0.025 | 4 | 95 | 95 |
| 24 | 15 | 15 | 6 | 0.045 | 4 | 100 | 100 |
| 25 | 15 | 15 | 6 | 0.025 | 8 | 99.48 | 98.52 |
| 26 | 10 | 10 | 5 | 0.015 | 6 | 99.33 | 100 |
| 27 | 5 | 15 | 6 | 0.025 | 4 | 100 | 100 |
| 28 | 10 | 20 | 7 | 0.015 | 6 | 100 | 96 |
| 29 | 15 | 15 | 6 | 0.025 | 4 | 94.57 | 94.7 |
| 30 | 20 | 20 | 7 | 0.015 | 2 | 80 | 81.7 |
| 31 | 20 | 10 | 5 | 0.035 | 6 | 100 | 100 |
| 32 | 15 | 15 | 6 | 0.025 | 4 | 95 | 95 |
Desirability Function (DF)
Desir abilities functions create the function of every individual responses leading to the final outputs of the global functions (D), max values of which support the achievements for optimum value30. The principles and applications of desirability functions for the best predications of real behaviors of adsorptions system were pointed out previously30. The desirability’s profile indicates the predicted level of variable, which produce the most desirable responses.
Results and Discusston
Based on theoretical calculation for comparison to experimental data the references have been considered39-61. and based the experiments results and approaches of related works this work has been investigated62-116
Characterization of Adsorbents
The FT-IR spectrums of NBASPEDMWCN (Fig.2b), exhibits absorption peaks at 1715cm-1 correspond to the stretching modes of vibrations for carbonyl group. The broad peak at 1086 cm-1 could assign to carbon oxygen stretching from phenolic, alcohlic, etherics group. These peaks can be assigned to the OH groups of moistures and carboxylic groups34. The aromatic35 C=C stretching are observed at 1459 cm-1. The FT-IR spectrums (Fig. 3b.) displays the new peaks as a weak shoulders at 2931 cm-1, which correspond to a stretching modes vibration for C–H bond in propyl35 groups.
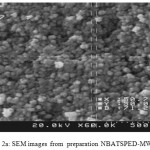 |
Figure 2a: SEM images from preparation NBATSPED-MWCNT. Click here to View figure |
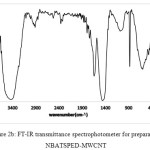 |
Figure 2b: FT-IR transmittance spectrophotometer for preparation NBATSPED-MWCNT Click here to View figure |
Statistical Analysis
Central composites are designed as the most applicable types of RSM were applies for modeling and optimizing of concentrations for TB (X1) and EB (X2),pH(X3),amounts of adsorbent (X4) and (X5) on the ultrasonic-assisted36 adsorption of TB37 and EB38 dye through NBATSPED-MWCNT38. 5 independent variable was set at five level at which the R% of TB and EB dye as response were determined and exhibit in the Tables four and five. Analysis of the variance or ANOVA38 were performed for evaluating the important35 and effectives terms for modeling of the response based on F-test and p-values36-38.
Table 4: Matrixes of designing for CCD designing
|
Factors |
levels |
Star pointα = 2.0 |
|||
|
Low (-1) |
Central (0) |
High(+1) |
-α |
+α |
|
| (X1) TB Concentration (mg L-1) |
10 |
15 |
20 |
5 |
25 |
| (X2) EB Concentration (mg L-1) |
10 |
15 |
20 |
5 |
25 |
| (X3) pH |
5.0 |
6.0 |
7.0 |
4.0 |
8.0 |
| (X4) Adsorbent mass (g) |
0.0150 |
0.025 |
0.0350 |
0.005 |
0.045 |
| (X5) Sonication time (min) |
2.0 |
4.0 |
6.0 |
2.0 |
6.0 |
Table 5: Analysis for variant (ANOVA) of EB and TB
|
TB |
EB |
||||||||
|
Source of variation |
Df |
Sum of square |
Mean square |
F-value |
P-value |
Sum of square |
Mean square |
F-value |
P-value |
|
Model |
20 |
1920.3 |
96.013 |
11.161 |
0.00011 |
977.95 |
48.898 |
8.4833 |
0.000412 |
|
X1 |
1 |
113.71 |
113.71 |
13.218 |
0.003918 |
18.691 |
18.691 |
3.2428 |
0.099187 |
|
X2 |
1 |
25.256 |
25.256 |
2.9359 |
0.11463 |
42.987 |
42.987 |
7.4579 |
0.019546 |
|
X3 |
1 |
21.584 |
21.584 |
2.509 |
0.1415 |
1.0753 |
1.0753 |
0.18655 |
0.67415 |
|
X4 |
1 |
959.63 |
959.63 |
111.55 |
< 0.0001 |
515.97 |
515.97 |
89.516 |
< 0.0001 |
|
X5 |
1 |
74.495 |
74.495 |
8.6597 |
0.013382 |
24.653 |
24.653 |
4.277 |
0.062979 |
|
X1X2 |
1 |
32.948 |
32.948 |
3.83 |
0.076198 |
49.421 |
49.421 |
8.5741 |
0.013736 |
|
X1X3 |
1 |
28.676 |
28.676 |
3.3335 |
0.095127 |
1.809 |
1.809 |
0.31385 |
0.58655 |
|
X1X4 |
1 |
140.54 |
140.54 |
16.337 |
0.001942 |
17.808 |
17.808 |
3.0896 |
0.10655 |
|
X1X5 |
1 |
21.669 |
21.669 |
2.5189 |
0.14079 |
21.206 |
21.206 |
3.6791 |
0.081416 |
|
X2X3 |
1 |
7.6176 |
7.6176 |
0.88551 |
0.3669 |
25.806 |
25.806 |
4.4772 |
0.057977 |
|
X2X4 |
1 |
18.148 |
18.148 |
2.1096 |
0.1743 |
48.372 |
48.372 |
8.3921 |
0.014525 |
|
X2X5 |
1 |
30.914 |
30.914 |
3.5936 |
0.084568 |
0.7569 |
0.7569 |
0.13132 |
0.72394 |
|
X3X4 |
1 |
44.156 |
44.156 |
5.1329 |
0.044651 |
4.5369 |
4.5369 |
0.78711 |
0.39396 |
|
X3X5 |
1 |
34.164 |
34.164 |
3.9714 |
0.071677 |
35.462 |
35.462 |
6.1524 |
0.030552 |
|
X4X5 |
1 |
58.599 |
58.599 |
6.8119 |
0.024259 |
15.366 |
15.366 |
2.6659 |
0.13079 |
|
X12 |
1 |
12.981 |
12.981 |
1.509 |
0.24493 |
26.291 |
26.291 |
4.5613 |
0.056021 |
|
X22 |
1 |
24.53 |
24.53 |
2.8515 |
0.1194 |
26.291 |
26.291 |
4.5613 |
0.056021 |
|
X32 |
1 |
0.011948 |
0.011948 |
0.001389 |
0.97094 |
1.2151 |
1.2151 |
0.21081 |
0.65508 |
|
X42 |
1 |
233.96 |
233.96 |
27.196 |
0.000288 |
84.299 |
84.299 |
14.625 |
0.002822 |
|
X52 |
1 |
2.9101 |
2.9101 |
0.33829 |
0.57254 |
0.28347 |
0.28347 |
0.049179 |
0.82856 |
|
Residual |
11 |
94.627 |
8.6025 |
63.404 |
5.764 |
||||
|
Lack of Fit |
5 |
71.027 |
14.205 |
3.6115 |
0.074721 |
41.28 |
8.2561 |
2.2391 |
0.17741 |
|
Pure Error |
6 |
23.6 |
3.9334 |
22.123 |
3.6872 |
0.000412 |
|||
|
Cor Total |
31 |
2014.9 |
1041.4 |
0.099187 |
|||||
Analysis of Central Composite Designing
ANOVA was performed for obtaining information of the most important variable and its possible interaction (Table 5). Generally, they applied for the model of 11.16 and 8.48 of TB and EB respectively. The value calculated of the determination coefficient are R2 0.96 and 0.94 for TB and EB respectively. The removal percentage of for TB and EB has been calculated. Therefore, the following semi-empirical expression applies for models of the removal percentage (R%) for TB and EB respectively36:
R%TB=95.709-2.1767X1-1.0258X2+0.94833X3+6.3233X4+2.0955X5-1.4350X1X2+1.3388X1X3+2.9638X1X4-1.1638X1X5+0.69000X2X3+1.0650X2X4-1.3900X2X5-1.6612X3X4+1.4612X3X5-1.9138X4X5+0.66726X12+0.91726X22-0.020244X32-2.8327X42-0.41595X52 (5)
R%EB=95.775-0.88250X1-1.3383X2-0.21167X3+4.6367X4+1.2054X5-1.7575X1X2+0.33625X1X3+1.0550X1X4-1.1513X1X5+1.2700X2X3+1.7388X2X4-0.21750X2X5+0.53250X3X4+1.4887X3X5-0.98000X4X5+0.94960X12+0.94960X22-0.20415X32-1.7004X42-0.12982X52 (6)
Table 6: several isotherms including the correlation coefficient calculation dyes adsorption over NBATSPED-MWCNT.
|
Isotherm |
Equation |
parameters |
Value of parameters for MO( 0.025g) |
Value of parameters For DSB( 0.025g) |
|
Langmuir |
qe=qm bCe/(1+bCe) |
Qm(mg g-1) |
50 |
100 |
|
Ka (L mg-1) |
1.53 |
0.487 |
||
|
R2 |
0.997 |
0.998 |
||
|
Freundlich |
ln qe=ln KF + (1/n) ln Ce |
1/n |
0.24 |
0.55 |
|
KF (L mg-1) |
3.66 |
4.09 |
||
|
R2 |
0.985 |
0.982 |
For making other assessments on the applicability37 of the model, the predicted and observed value of the removal percentages of TB and EB dye on NBATSPED-MWCNT were compared in (Fig. 3).
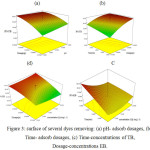 |
Figure 3: surface of several dyes removing: (a) pH- adsorb dosages, (b) Time- adsorb dosages, (c) Time-concentrations of TB, Dosage-concentrations EB. Click here to View figure |
Response Surface Methodologies
Fig (3a, b) exhibits the removal percentages change versus the adsorbents dosages. The positive increasing in the dyes removal percentages with increasing in the adsorbent masses can be seen. Significant38 diminishes in removal percentages at lower amounts of NBTSPEDMWCN are at attributes to higher ratio of dyes molecules. Fig (3c) exhibits sonication times can be concluded the maximum adsorption of EB37 could be riches when the sonication times were increased. Fig (3d) exhibits the removal percentages changing versus the adsorbent dosages.
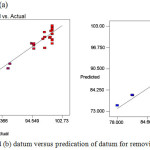 |
Figure 4: (a) and (b) datum versus predication of datum for removing TB and EB. Click here to View figure |
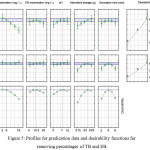 |
Figure 5: Profiles for predication data and desirability functions for removing percentages of TB and EB. Click here to View figure |
Conclusion
Sonication’s methods are effectives, very fast and sensitive to adsorbed materials compare to other methods especially, for the removal of Thymol Blue and Erythrosine-B. The influence of experiments parameter on the dye removal percentage was accomplished through experimental designing and the methodology of RSM. The adsorptions characteristics were examined with the variation of pH, sonication times, NBATPED-MWCNT dosages, initial TB concentrations and initial EB concentrations. The removal of TB and EB forms aqueous solution in short time (5 min) are feasible with high removal percentages at optimum pH (6.5) which are neutral and are advantages for the adsorption process.
References
- Parham,H., Zargar, B., Heidari, Z., Hatamie, A. Journal of the Iranian Chemical Society, 2011, 8, 9-16.
- Hameed, B.H., Mahamoud, D.K., Ahmad, A.L. J. Hazard. Mater, 2008, 158, 65-72.
CrossRef - Zhang, W., Yang, H., Dong, L., Yan, H., Li, H., Jiang, Z., Kan, X., Li, A., Cheng, R. Carbohydrate Polymers, 2012, 90, 887-893.
CrossRef - Afkhami, A., Saber-Tehrani, M., Bagheri, H. Desalination, 2010, 263, 240-248.
CrossRef - Hao, J.O., Kim, H., Chiang, P.C. Crit. Rev. Environ. SciTechnol, 2000, 30, 449–505.
CrossRef - Purkait, M.K., Das Gupta, S., De, S. J. Hazard. Mater, 2006, 136, 972–977.
CrossRef - Hejazifar, M., Azizian, S. J. Dispersion Sci. Technol, 2012, 33, 846–853.
CrossRef - Yahyaei, B., Azizian, S. Chem. Eng. J, 2012, 209, 589–596.
CrossRef - Hussein, F., AlKhateeb, A., Ismail, J.K. E-Journal of Chemistry, 2008, 5, 243-250
CrossRef - Mittal, A., Mittal, J., Kurup, L., Singh, A.K. J. Hazard. Mater, 2006, 138, 95-104.
CrossRef - Khosravi, I., Eftekhar, M, Powder Technol, 2013, 250, 147-156.
CrossRef - Fu, J., Chen, Z., Wang, M., Liu, S., Zhang, J., Zhang, J., Han, R., Xu, Q. Chem. Eng. J, 2015, 259, 53-64.
CrossRef - Ghaedi, M., Rozkhoosh, Z., Asfaram, A., Mirtamizdoust, B., Mahmoudi, Z., Bazrafshan, A.A. Spectrochim. Acta, A: Mol. Biomol. Spectrosc, 2015, 138, 176-185.
CrossRef - Ertas, M., Acemioglu, B., Alma, M.H., Usta, M. J. Hazard. Mater, 2010,183, 421-432.
CrossRef - Ravanan, M., Ghaedi, M., Ansari, A., Taghizadeh, F., Elhamifar, D. Biomol. Spectrosc, 2014, 123, 467-477.
CrossRef - Vargas, A.M., Martins, A.C., Almeida, V.C. Chem. Eng. J, 2012, 195, 173-182.
CrossRef - Coelho, T., Vidotti, E., Rollemberg, M., Medina, A., Baesso, M., Cella, N., Bento, A. Talanta, 2010, 81, 202-212.
CrossRef - Shahrokhian, S., Rastgar, S., Amini, M.K., Adeli, M. Biochem, 2012, 86, 78-87.
- Pavlovic, M.D., Buntic, A.V., Mihajlovski, K.R. J.T Siler, aiwanInstChemEng, 2014, 45, 1691 – 1699.
- Langmuir, I. J Am ChemSoc, 1916, 38, 2221–2295.
CrossRef - Ho, Y.S. Water Res. 2006, 40, 119–125.
CrossRef - Juang, R., Wu, F., Tseng, R. Environ Technol, 1997, 18, 525–531.
CrossRef - Robinson, T., Mc – Mullan, G., March, R., Nigam, P. Bioresour, Technol, 2001, 77, 247 –55.
CrossRef - Hashemian, S.; Parsaei, Y. Orient. J. Chem. 2015, 31(1), 177-184.
CrossRef
- Mohammadkhani, S.; Gholami, M.R.; M. Aghaie. Orient. J. Chem. 2016, 32(1), 591-599.
CrossRef - Srinivasan, S.; Chelliah, P.; Srinivasan, V.; Stantley, A. B.; Subramani, K. Orient. J. Chem.2016, 32(1).
- Hajati, S., Ghaedi, M., Yaghoubi, S. J. Local, IndEngChem, 2015, 21, 760 –767.
CrossRef - Hameed, B., Tan, I., Ahmad, A. J Hazard Mater, 2008, 158, 324–332.
CrossRef - Sahu, J., Acharya, J., Meikap, B. J Hazard Mater, 2009, 172, 818–825.
CrossRef - Malenovic, A., Dotsikas, Y., Maskovic, M., Jancic-Stojanovic, B., Ivanovic,D., Medenica, M. Micro chem J, 2011, 99, 454–460.
CrossRef - Waldron, R.D. Phys. Rev. 1995, 99, 1727-1732.
CrossRef - Asfaram, A., Ghaedi, M., Agarwal, S., Tyagi, I., Kumar Gupta, V. RSCAdv, 2015, 5, 18438–18450.
- Ho, Y.S., Mc Kay, G. Water Res, 2000, 34, 735–742.
CrossRef - Ozdes, D., Gundogdu, A., Kemer, B., Duran, C., Senturk, H.B., Soylak, M. Journal of Hazardous Materials. 2009,166 (2-3), 1480-1487.
CrossRef - Sari, A., Mendil, D., Tuzen, M., Soylak, M. Journal of Hazardous Materials. 2009, 162(2-3), 874-879.
CrossRef - Roosta, M., Ghaedi, M., Daneshfar, A., Darafarin, S., Sahraei, R., Purkait, M. UltrasonSonochem, 2014, 21, 1441–1450.
CrossRef - Liu, Y., Cui, G., Luo, C., Zhang, L., Guo, Y., Yan, S. RSC Adv, 2014, 4, 55162–55172.
CrossRef - Asfaram, A., Ghaedi, M., Hajati, S., Goudarzi, A., Bazrafshan, A.A. Spectrochim. Acta, Part A, 2015, 145, 203–212.
CrossRef - Monajjemi,M.; Nayyer T. Mohammadian J. Comput. Theor. Nanosci. 2015, 12, 4895-4914.
CrossRef - . Monajjemi, M.; Lee, V.S.; Khaleghian, M.; B. Honarparvar, B.; F. Mollaamin, F. J. Phys.Chem C. 2010, 114, 15315
CrossRef - Monajjemi, M. Struct Chem. 2012, 23,551–580
CrossRef - Monajjemi, M.; Boggs, J.E. J. Phys. Chem. A, 2013, 117, 1670 −1684
CrossRef - Monajjemi, M.; Khaleghian, M, Journal of Cluster Science. 2011, 22 (4),673-692
CrossRef - Monajjemi, M.; Wayne Jr, Robert. Boggs, J.E. Chemical Physics. 2014, 433, 1-11
- Monajjemi, M. Falahati, M.; Mollaamin, F.; Ionics, 2013, 19, 155–164
CrossRef - Monajjemi, M.; Mollaamin, F. Journal of Cluster Science, 2012, 23(2), 259-272
CrossRef - Tahan, A.; Monajjemi, M. Acta Biotheor, 2011, 59, 291–312
CrossRef - Mollaamin, F.; Monajjemi, M. Physics and Chemistry of Liquids .2012, 50, 5, 2012, 596–604
- Monajjemi, M.; Khosravi, M.; Honarparvar, B.; Mollaamin, F.; International Journal of Quantum Chemistry, 2011, 111, 2771–2777
CrossRef - Monajjemi, M. Theor Chem Acc, 2015, 134:77 DOI 10.1007/s00214-015-1668-9
CrossRef - Monajjemi, M. Journal of Molecular Modeling , 2014, 20, 2507
CrossRef - Monajjemi, M.; Khaleghian, M.; Mollaamin, F. Molecular Simulation. 2010, 36, 11, 865–
- Monajjemi, M. Biophysical Chemistry. 2015 207,114 –127
CrossRef - Jalilian,H.; Monajjemi, M. Japanese Journal of Applied Physics. 2015, 54, 8, 08510
- Monajjemi, M.; Mollaamin, F. Journal of Computational and Theoretical Nanoscience, 2012, 9 (12) 2208-2214
CrossRef - Mollaamin F, Varmaghani Z, Monajjemi M. 2011; 49: 318-336.
- Mollaamin, F.; Baei, MT.; Monajjemi, M.; Zhiani, R.; Honarparvar, B.; Russian Journal of Physical Chemistry A, Focus on Chemistry, 2008, 82 (13), 2354-2361
CrossRef - M Monajjemi, L Mahdavian, F Mollaamin, B Honarparvar,Fullerenes, Nanotubes and Carbon Nanostructures,2010, 18 (1), 45-55, 2010
- Monajjemi, M. Falahati, M.; Mollaamin, F.; Ionics, 2013, 19, 155–164
CrossRef - Monajjemi, M., Chahkandi, B. Journal of Molecular Structure: THEOCHEM, 2005, 714 (1), 28, 43-60.
CrossRef - V.K. Gupta, A. Mittal, L. Kurup, J. Mittal, J. Colloid Interface Sci. 304 (2006) 52–57.
CrossRef - A. Mittal, J. Mittal, L. Kurup, A.K. Singh, J. Hazard. Mater. 138 (2006) 95–105.
CrossRef - F.C. Caliman, L.C. Apostol, L. Bulgariu, D. Bulgariu, M. Gavrilescu, Environ.Eng. Manage. J. 8 (2009) 1081–1087.
CrossRef - F.C. Caliman, L.C. Apostol, L. Bulgariu, D. Bulgariu, M. Gavrilescu, Environ.Eng. Manage. J. 8 (2009) 1339–1346.
CrossRef - R. Jain, S. Sikarwar, J. Hazard. Mater. 164 (2009) 627–633.
CrossRef - G.J. Jesus, C.R. Corso, A. Campos, S.M.M. Franchetti, Braz. Arch. Biol. Technol. 53 (2010) 473–480.
CrossRef - L. Pereira, R. Pereira, C.S. Oliveira, L.C. Apostol, M. Gavrilescu, M.N. Pons, O. Zahraa, M.M. Madalena Alves, 89 (2013) 33–39.
- L.C. Apostol, C. Smaranda, M. Diaconu, M. Gavrilescu, Environ. Eng. Manage. J. 14 (2015) 465–471.
CrossRef - S. Motoc, F. Manea, A. Pop, A. Baciu, G. Burtica ˘, R. Pode, Environ. Eng. Manage. J. 12 (2013) 509–516.
CrossRef - D. Suteu, G. Biliuta, L. Rusu, S. Coseri, G. Nacu, Environ. Eng. Manage.J. 14 (2015) 525–532.
CrossRef - G. Crini,. Technol. 97 (2006) 1061–1085.
- Y.S. Al-Degs, R. Abu-El-Halawa, S.S. Abu-Alrub, Chem. Eng. J. 191 (2012) 185–194
CrossRef - L.C. Apostol, F.C. Ca ˘liman, M. Gavrilescu, Chem. Eng. Section LVI (LX) (2010) 47–56.
- L.A. Colar, L. Cocheci, E.C. Ilinoiu, F. Manea, C. Orha, R. Pode, Eng. Manage. J. 11 (2012) 1375–1381.
CrossRef - M.C. Alexandrica, M. Silion, D. Hritcu, M.I. Popa,Environ. Eng. Manage. J. 14(2) (2015) 381–388.
CrossRef - C. Smaranda, D. Bulgariu, M. Gavrilescu, Environ. Eng. Manage. J. 9 (2010) 57–66.
CrossRef - L.S. Tan, K. Jain, C.A. Rozaini, J. Appl. Sci. Environ. Sanit. 5 (2010) 283–294.
- P. SenthilKumar, R. Gayathri, D.K. Selvaraj, P. Vijayalakshmi, P. RajKumar, J. Nandagopal, S.Sivanesan, Environ. Eng. Manage. J. 10 (2011) 451–460.
CrossRef - I. Cretescu, M. Diaconu, C. Cojocaru, R.E. Benchea, C. Pohontu, Environ. Eng. Manage. J 9 (2010) 107–112.
CrossRef - M.R. Samarghandi, M. Zarrabi, A. Amrane, M.M.Soori, M.M. Sepehr, Environ. Eng. Manage. J. 12 (2013) 2137–2147.
CrossRef - R. Jain, M. Bhargave, N. Sharma, J. Sci. Ind. Res. 64 (2005) 191–197.
- M.A. Hasnat, M.M. Uddin, A.J.F. Samed, S.S. Alam, S. Hossain, J. Hazard. Mater. 147 (2007) 471–477.
CrossRef - R. Jain, S. Sikarwar, Technol. 31 (2010) 1403–1410.
- I. Dahlan, A.S.M. Noor, Environ. Eng. Manage. J. 13 (2014) 197–204.
CrossRef - A. Elaziouti, N. Laouedj, B. Ahmed, . Chem. Eng.Process Technol. 2 (2011) 1–9.
- N. Fiol, I. Villaescusa, Environ.Chem. Lett. 7 (2008) 79–84.
CrossRef - K. Bourikas, J. Vakros, C. Kordulis, A. Lycourghiotis, J. Phys. Chem. B 107 (2003) 9441–9451.
CrossRef - Y.S. Aldegs, M.I. Elbarghouthi, A.H. Elsheikh, G.M. Walker, Dyes Pigm. 77 (2008) 16–23.
CrossRef - M. Colombini, C.Y. Wu, A food dye, erythrosine B, Biochim. Biophys. Acta (BBA) 648 (1981) 49–54.
CrossRef - S.S. Moghaddam, M.R. Alavi Moghaddam, M. Arami, J. Environ. Health Sci. Eng. 7 (2010) 437–442.
- V. Jaikumar, K. Sathish Kumar, D. Gnana Prakash, Int. J. Appl. Sci. Eng. 7 (2009) 115–125.
- X. Pan, D. Zhang, Electron. J. Biotechnol. 12 (2009) 1–10.
- R. Ansari, Z. Mosayebzadeh, Removal of Eosin Y, Iran. Polym. J. 19 (2010) 541–551.
- R.M. Dhoble, S. Lunge, A.G. Bhole, S. Rayalu, Water Res. 45(16) (2011) 4769–4781.
CrossRef - M. Malakootian, M. Moosazadeh, N. Yousefi, A. Afr. J. Environ. Sci. Technol. 5 (2011) 299–306.
- M. Wawrzkiewicz, Z. Hubicki, Biochem. Eng. J. 157 (2010) 29–34.
- S. Banerjee, M.C. Uma Chattopadhyaya, Y.C. Sharma, Environ. Eng. Manage. J. 12 (2013) 2183–2190.
CrossRef - K.Y. Foo, B.H. Chem. Eng. J. 156 (2010) 2–10.
CrossRef - R. Ahmad, J. Hazard. Mater. 171 (2009) 767–773.
CrossRef - S.D. Khattri, M.K. Singh, J. Hazard. Mater. 167 (2009) 1089–1094.
CrossRef - A.N. Oladoja, C.O. Aboluwoye, Y.B. Oladimeji, Turkish J. Eng. Environ. Sci. 32 (2008) 303–312.
- T.V.N. Padmesh, K. Vijayaraghavan, G. Sekaran, M. Velan, Biorem. J. 10 (2006) 37–44.
CrossRef - Y.S. Ho, G. Mckay,. Environ. Protect. 76 (1998) 183–191.
- S. Patil, V. Deshmukh, S. Renukdas, N. Patel, Int. J. Environ. Sci. 1 (2011) 1116–1134.
- B.H. Hameed, M.I. El-Khaiary, J. Hazard. Mater. 155 (2008) 601–609.
CrossRef - M. Arami, N.Y. Limaee, N.M. Mahmoodi, Chem. Eng. J. 139 (2008) 2–10.
CrossRef - B.K. Nandi, A. Goswami, M.K. Purkait, J.Hazard. Mater. 161 (2009) 387–395
CrossRef - V.K. Gupta, Suhas, A review, J. Environ. Manage. 90 (2009) 2313–2342.
CrossRef - A.U. Itodo, H.U. Itodo, EJEAFChe. 9 (2010) 1792–1802.
- N.T. Abdel-Ghani, M.M. Hefny, G.A. El-Chaghaby, J. Chil. Chem. Soc. 53 (2008) 1585–1587.
CrossRef - R. Klimaviciute, J. Bendoraitiene, R. Rutkaite, A. Zemaitaitis, J. Hazard. Mater. 181 (2010) 624–632.
CrossRef - S.M. de Oliveira Brito, H.M. Carvalho Brito, L.F. Soares, R.P. de Azevedo, J. Hazard. Mater. 174 (2010) 84–92.
CrossRef - C.T. Hsieh, H. Teng, J. Chem. Technol. Biotechnol. 75 (1980) 1066–1072.
CrossRef - F. Deniz, S.D. Saygideger, Technol. 101 (2010) 5137–5143.
- F.C. Caliman, M. Gavrilescu, Eng. Manage. J. 7 (2008) 301–308.–2904
CrossRef

This work is licensed under a Creative Commons Attribution 4.0 International License.
![]()
A New Edition of Web of Science
Journal Impact Factor
2022: 0.5
Five Year: 0.8
Journal is Indexed in

Cabells Whitelist
![]()


